151 Cecil Meneffee Dr · Moorefield, WV
Flood risk 1/10 · Minimal
- FEMA flood zone
- X (unshaded)
- Chance of flooding over 30 yrs
- 0.0%
- Est. flood insurance / yr
- $507 – $1,088
Fire risk 4/10 · Minor
- Est. fire insurance / yr
- $787 – $1,461
Heat risk 5/10 · Moderate
- Hot days now (above 102°F)
- 7 days/yr
- Hot days in 30 yrs
- 17 days/yr
Wind risk 2/10 · Minimal
- Chance of severe wind over 30 yrs
- 0.0%
Air-quality risk 1/10 · Minimal
- Unhealthy air days now
- 0 days/yr
- Unhealthy air days in 30 yrs
- 0 days/yr
Risk factors via First Street. Map © Google.
Why this score? — see what drove the B+ grade
The composite is a weighted blend of 9 inputs, each scored 0–100. Each bar is that input's sub-score; the figure is the points it added to the 100-point composite (weight × sub-score).
- Cash flow +30.0/30.0
- 1% rule +10.0/10.0
- DSCR +10.0/10.0
- Appreciation +7.6/10.0
- ARV discount +7.5/15.0
- Livability +3.3/5.0
- Rent growth +2.5/5.0
- Schools +2.5/10.0
- Condition / age +2.2/5.0
$50,000
🖨 Deal sheet (PDF) 📄 Offer letter ✓ Due diligence
Listing remarks
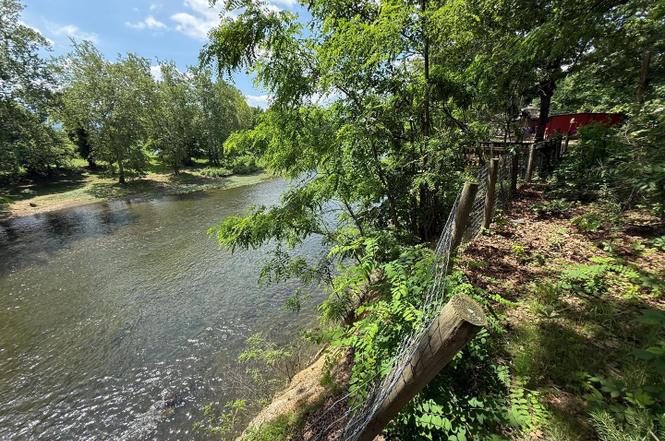
Bungalow on the Potomac Valley River. Handyman's special.
Key facts
- 0.23 acre lot
- Built 1964
Property features AI
Finance
- Other: Above-grade finished area is 529 (source: assessor); Total below-grade area reported as 0; Year built source: assessor; Land and improvement assessed values recorded
- Financial info: Ownership: Fee simple
Exterior
- Parking: Driveway
- Utilities: Public water; On-site septic
- Home design: Detached structure; Frame construction
- Construction: Frame construction; Block foundation; Above-grade and below-grade structures
- Exterior features: Located outside city limits; Directions: Use GPS; Tidal water not present
Interior
- Bedrooms: One bedroom on the main level
- Bathrooms: One full bathroom on the main level
- Heating & cooling: Electric heating; Electric hot water
- Interior features: No basement
Neighborhood map
What this means for you Summary
Snapshot
- This is a 1-bed/1.0-bath single-family listed at $50k. Condition is rated fair.
Deal economics
- At list price, monthly cash flow is $301 ($4k/yr) — positive.
- The deal already cash-flows at list — no discount required.
- Meets the 1% rule at list price ($818 rent vs $50k).
Location & tenants
- Location reads 66/100 on livability (#114 in WV) — a middle-class / working-renter tenant base. Strengths: cost of living A+, housing A+, health & safety A+; Watch: employment C-, schools D, crime F.
- Hardy County Schools (rural): math 22% / reading 37% proficiency, ranked #34 of 55 in WV (top 62%) — low school quality limits family demand, transient renter base, plan for 1-2y turnover.
- Market conditions: 39 active listings in the ZIP; 150 units permitted in Hardy County in 2024 (65 in 5+ unit buildings).
Forward outlook
- In year one you build about $3k of equity ($346 loan paydown + $3k appreciation (5.1% local appreciation)).
- Hardy County population projected at -18% by 2050 — secular population decline; favor cash flow + early exit over multi-decade hold.
- At projected returns (5.1% appreciation + 3.0% rent growth), your $14k cash investment doubles in ~3 years — after that, you're playing with house money.
Negotiation context
- Only 1 days on market — expect competitive offers; lowballing is unlikely to land.
Risks & watch-outs
- Climate carrying-cost: extreme-heat days projected 7→17/yr by 2055 (HVAC capex compounding) — expect insurance premiums to compound above CPI over the hold.
Questions for the listing agent
- Have any recent inspections been done? Can we get a copy of the seller's disclosures and any deferred-maintenance estimates?
- Built in 1964 — when were the roof, HVAC, electrical panel, plumbing, and water heater last replaced?
- Is there a deadline driving the sale (1031 exchange, divorce, estate, relocation)? That informs how much negotiation room exists.
- Schools are D-rated, which usually means shorter tenancies and higher turnover. Who's the typical renter profile here, and what's been the actual vacancy rate?
- Crime grade is F in this area — have there been break-ins, vandalism, or insurance claims at this property in the last 3 years? What carrier currently insures it and at what premium?
- What's the average days-on-market for RENTAL listings here right now (not sales)? A rising rental-DOM trend means longer vacancies and softer asking-rent achievability than the comps imply.
- What's the recent tenant-quality profile in this submarket — average credit score on applications, eviction rate, late-payment / NSF rate, and stable-employment percentage? A property-management company in the area should have these aggregated.
- How much new for-sale + rental construction is in the pipeline within 1–3 miles? Heavy new supply typically softens prices + rents 12–24 months out; constrained supply supports both.
Investment metrics
- 1% rule
- 1.64% ✓
- Cap rate
- 13.51%
- Cash-on-cash
- 25.78%
- DSCR
- 2.15
- GRM
- 5.1
CMA / ARV
No comps found within radius.
Projected returns pro-forma
5.11% appreciation · 3.0% rent growth · sell at horizon
- IRR
- 35.6%
- Equity multiple
- 3.22×
- Total profit
- $31,014
- Equity at exit
- $28,678
- IRR
- 33.8%
- Equity multiple
- 6.51×
- Total profit
- $77,080
- Equity at exit
- $49,782
Cash invested: $14,000 (down + closing). Projections, not guarantees.
Landlord ↔ Tenant lean methodology
- Overall (STATE)
- 83 Strongly Landlord-Friendly
- State West Virginia
- 83 Strongly Landlord-Friendly · R+22
- County
- — inherits STATE
- City
- — inherits STATE
ZIP-level market 26836
- Home prices YoY
- 2.8%
- Active inventory
- 39
- Price-to-rent
- 5.1×
Monthly cashflow live
- Estimated rent
- $818 medium interval (Pro) →
- Mortgage (P&I)
- −$262
- Tax est. 1.5%
- −$62 /mo · $750/yr
- Insurance
- −$21
- HOA
- −$0
- Vacancy / Maint / Mgmt
- −$172
- Net cashflow
- $301
Break-even live
Sensitivity live
| Price | -10% $335 | -5% $318 | +0% $301 | +5% $283 | +10% $266 |
|---|---|---|---|---|---|
| Rent | -10% $236 | -5% $268 | +0% $301 | +5% $333 | +10% $365 |
| Rate | -1.0pp $326 | -0.5pp $313 | base $301 | +0.5pp $288 | +1.0pp $275 |
UW: 25.0% down · 7.5% · 30yr · 1.5% tax · 5.0% vac · 8.0% maint · 8.0% mgmt
Financing live
Cash to close
- Down payment
- $12,500
- Closing costs
- $1,500
- Reserves months
- —
- Total cash needed
- —
Loan-product check · same deal, 3 products live
Conventional
25% down · 7.5% · 30yr
- Down + closing
- —
- Monthly P&I
- —
- Monthly cashflow
- —
- DSCR
- —
- Eligible?
- —
Personal DTI + credit; lowest rate.
DSCR
20% down · 8.5% · 30yr
- Down + closing
- —
- Monthly P&I
- —
- Monthly cashflow
- —
- DSCR
- —
- Eligible?
- —
No personal income docs; deal must DSCR.
Hard money
10% down · 12.0% · 12mo
- Down + closing
- —
- Monthly P&I
- —
- Monthly cashflow
- —
- DSCR
- —
- Eligible?
- —
Short-term bridge; refi at stabilization.
Listing history 2 events
-
2026-06-15remarks 57-char remark
-
2026-06-15$50,000 Pending 1 DOM
ⓘ Source: listings_history table (triggers on properties + properties_extension) + one-shot
backfill from property_details.listing_events for pre-trigger history.
Climate risk First Street
- Flood 1/10 Low FEMA zone X (unshaded) · 0% chance over 30 yrs
- Wildfire 4/10 Moderate
- Heat 5/10 Major 7 d/yr ≥102°F today · 17 d/yr by 30 yrs out
- Wind 2/10 Low 0% chance of damaging wind over 30 yrs
- Air quality 1/10 Low 0 unhealthy d/yr today · 0 by 30 yrs out
Nearby sold comps map
Loading sold comps map…
Walkable amenities ~0.75 mi
Loading nearby amenities…
Taxation est. · year 1
- Rental income
- $9,817
- − Mortgage interest
- −$2,801
- − Property taxes
- −$750
- − Insurance
- −$250
- − Repairs & maintenance
- −$785
- − Management
- −$785
- − Depreciation
- −$1,455
- Taxable income
- $2,991
- Est. tax owed @ 24.0%
- −$718
- After-tax cash flow
- $2,891/yr
For passive investors: Depreciation is non-cash, so a rental often shows a tax loss while cash-flowing — sheltering income. Rental losses are passive: they offset passive income freely, and up to $25,000/yr can offset ordinary (W-2) income if you actively participate and your MAGI is under $100k (phasing out to $0 by $150k); unused losses carry forward. On sale, claimed depreciation is recaptured at up to 25%, and gains may owe capital-gains tax (a 1031 exchange can defer both). Figures are a year-1 estimate at your 24.0% rate — not tax advice; consult a CPA.
Condition & rehab AI · 12 photos
This bungalow on the Potomac Valley River requires moderate rehabilitation, including painting and landscaping, to improve its condition and resale value.
Repairs flagged
- Major Paint — Peeling paint on exterior and interior
- Major Landscaping — Overgrown vegetation needs trimming
- Minor Exterior siding — No visible damage
Value-add opportunities
- Both Painting the exterior and interior — Enhances curb appeal and interior aesthetics
- Both Landscaping and trimming overgrown vegetation — Improves curb appeal and creates a more inviting environment
Renovation cost estimate screening
| Repair item | Severity | Est. cost |
|---|---|---|
| Paint · Peeling paint on exterior and interior | Major | $15,000–50,000 |
| Landscaping · Overgrown vegetation needs trimming | Major | $15,000–50,000 |
| Exterior siding · No visible damage | Minor | $500–3,000 |
| Total estimated repair cost · 3 items | $30,500–103,000 |
Value-add ROI direction
- Both Painting the exterior and interior — Enhances curb appeal and interior aesthetics ↑
- Both Landscaping and trimming overgrown vegetation — Improves curb appeal and creates a more inviting environment ↑
ⓘ Cost ranges are severity-bucket heuristics (US national rule-of-thumb). Get contractor quotes + a written scope before underwriting a rehab budget.
Schools (NCES district)
- District
- Hardy County Schools
- NCES district ID
- 5400480
- Math proficiency
- 22% ▼ -9.00%
- Reading proficiency
- 37% ▼ -5.00%
- Median HH income
- $37,412
- Composite
- 24.53/100
- National rank
- #7646
- State rank
- #34 of 55 in WV
Livability — Moorefield
- Score
- 66/100
- State rank
- #114
- US rank
- #12229
Category grades
Schools grade is shown separately in the Schools card above.
Census & demographics
- Population (ZIP)
- 6,171
Population outlook (Hardy County) Hauer SSP2
- Today (2025)
- 13,424 people
- By 2030
- 13,009 · -3.1%
- By 2040
- 12,015 · -10.5%
- By 2050
- 11,041 · -17.8%
- By 2075
- 9,433 · -29.7%
- By 2100
- 8,269 · -38.4%
Race, ethnicity, and origin ACS 2023
- Neighborhood character
- Predominantly White (82%)
- Race & ethnicity
- White 82% Black 11% Hispanic / Latino 7% Two or more races 3%
- Hispanic origin (detail)
- Mexican 2% Puerto Rican 4%
- Common ancestry
- Hispanic 3% Slovak 1% English 1%
- Foreign-born
- 3% · Canada
- Languages at home
- 94% English-only · Spanish 4% German/W. Germanic 1%
Political lean MEDSL · Hardy
- 2024 margin
- Solid R (+57.7) · D 20.2% · R 77.9% · Other 1.8%
- 2008→2024 swing
- -30.4pp toward R · 2008: -27.3pp · 2024: -57.7pp
- All cycles
- 2024: R+57.7 2020: R+54.9 2016: R+54.7 2012: R+39.7 2008: R+27.3
Not yet ingested
- Civics
- —
Market trends
- HPI YoY
- ▲ 5.11%
- Current HPI
- 186.7106
- Rent YoY
- —
- Metro
- —
- State GDP YoY
- —
- F500 in state
- 0
Price history
2 events — show timeline
- 2026-06-14 Pending — BRIGHT MLS
- 2026-06-14 Listed $50,000 BRIGHT MLS
Cash-flow waterfall
monthlySold comps — $/sqft
last 12 mo · ≤1 miLoading sold comps…