 Duplex
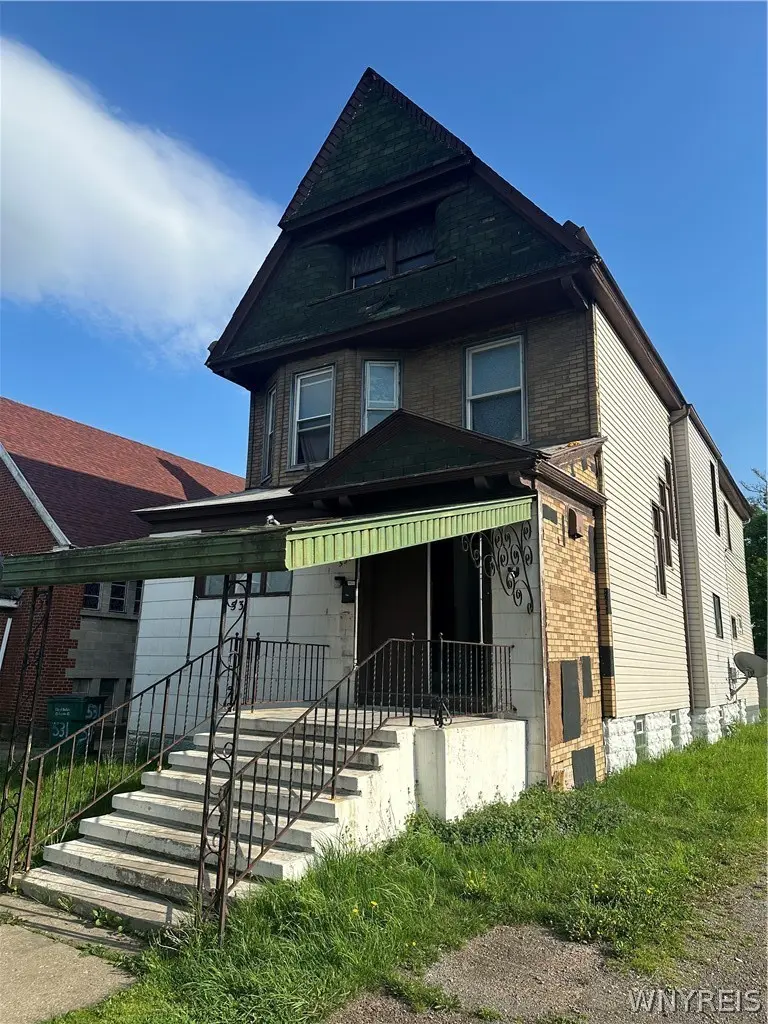
531 S Park Ave · Buffalo, NY
Flood risk 6/10 · Moderate
- FEMA flood zone
- X (unshaded)
- Chance of flooding over 30 yrs
- 0.75%
- Est. flood insurance / yr
- $473 – $860
Fire risk 1/10 · Minimal
- Est. fire insurance / yr
- $691 – $1,283
Heat risk 3/10 · Minor
- Hot days now (above 91°F)
- 7 days/yr
- Hot days in 30 yrs
- 15 days/yr
Wind risk 1/10 · Minimal
- Chance of severe wind over 30 yrs
- —
Air-quality risk 4/10 · Minor
- Unhealthy air days now
- 4 days/yr
- Unhealthy air days in 30 yrs
- 9 days/yr
Risk factors via First Street. Map © Google.
Why this score? — see what drove the B grade
The composite is a weighted blend of 9 inputs, each scored 0–100. Each bar is that input's sub-score; the figure is the points it added to the 100-point composite (weight × sub-score).
- Cash flow +30.0/30.0
- 1% rule +10.0/10.0
- DSCR +10.0/10.0
- ARV discount +7.5/15.0
- Rent growth +3.9/5.0
- Livability +3.9/5.0
- Appreciation +3.3/10.0
- Schools +3.3/10.0
- Condition / age +2.5/5.0
$139,000
🖨 Deal sheet 📄 Offer letter ✓ Due diligence
Multi-family units
County records classify this as Multi-Family (2-4 Unit). Listing-text estimate: 2 units. confirmed
Listing remarks
531 South Park Avenue, Buffalo, NY 14204 Competitively priced value add This is a classic two-family duplex (upper/lower) built in 1910 in Buffalo's First Ward neighborhood along South Park Avenue. The property offers a hefty 2,982 sq ft of living space on a 6,300 sq ft lot (0.14 acres), with separate utilities (boilers) typical for these older multi-family homes. Key highlights for investors:Upper unit is currently tenanted for $1200 per month— providing immediate rental income and cash flow from day one. Lower unit requires rehab — offering strong value-add potential through cosmetic and mechanical updates to bring it to market rents. Solid bones in a location near Sou
Key facts
- Separate utilities
- Solid bones
- Value-add potential
Tags
Property features AI
Finance
- Other: Property configured as 2 units total; Each unit has separate gas and electric meters
- Financial info: Water/Sewer operating expense included (multi-unit); Owner pays water; rent includes water (for rental units)
Exterior
- Parking: 2-car garage; Multiple parking spaces (two or more)
- Utilities: Public water connected; Sewer connected
- Home design: 2-story property; Resale condition
- Construction: Vinyl siding
- Exterior features: Rectangular residential lot; City street frontage; Lot dimensions approximately 35 x 180
Interior
- Flooring: Laminate; Varies by room
- Bathrooms: 2 full bathrooms
- Heating & cooling: Electric heating; Heating details listed in remarks
- Interior features: Full basement; Laminate and varied flooring
- Laundry & utility: Gas water heater
Neighborhood map
What this means for you Summary
Snapshot
- This is a 2 × 3-bed/1.0-bath units multifamily listed at $139k.
Deal economics
- At list price, monthly cash flow is $3k ($33k/yr) — positive. Per door: $1k/mo.
- The deal already cash-flows at list — no discount required.
- Meets the 1% rule at list price ($5k rent vs $139k).
- Recommended offer: $137k (1.5% below list) — sets the bar for market timing.
- Cap rate 30.0% vs local median 8.0% in Buffalo — top-decile yield for the area; either an underpriced asset or a hidden risk that comps aren't pricing in. Stress-test before assuming the spread holds.
Location & tenants
- Location reads 77/100 on livability (#195 in NY, #3,011 nationally) — a middle-class / working-renter tenant base. Strengths: commute A+, housing A+, health & safety A+; Watch: crime F, employment D-.
- Buffalo City School District (urban): math 41% / reading 40% proficiency, ranked #535 of 590 in NY (top 91%) — families likely to look elsewhere, expect single-tenant / working-renter base with shorter leases; 75% free/reduced lunch — lower-income household profile, screen leases tightly.
- Market conditions: Rents rising fast (+5.5%/yr); 33 active listings in the ZIP; 2 comparable units currently listed for rent nearby; lower-income renter base — watch delinquency; 1,244 units permitted in Erie County in 2024 (563 in 5+ unit buildings).
- At $4,688/mo this rent would consume 200% of the median local household income ($28k/yr) (locally 945% of renters already pay >50% of income on rent) — very limited rent-growth headroom before tenants either downsize or default.
Forward outlook
- Local home prices are declining (-3.0%/yr); year-one equity from $961 of loan paydown is wiped out by about $4k of value loss. Plan a longer hold.
- At projected returns (-3.0% appreciation + 5.5% rent growth), your $39k cash investment doubles in ~2 years — after that, you're playing with house money.
Negotiation context
- It's been on market 30 days — a 2% lower offer ($137k) is reasonable based on typical stale-listing flexibility.
- 2 sale attempts; this cycle's ask has dropped $20k (13%) from the opening price — seller is motivated, your offer sets the floor, not the list.
- Current owner paid $76k; list at $139k implies a 83% gain — meaningful room to come down on a strong offer.
Risks & watch-outs
- Watch-outs: built in 1910 — expect roof / HVAC / electrical / plumbing capex.
- Climate carrying-cost: major flood risk — expect insurance premiums to compound above CPI over the hold.
Questions for the listing agent
- Can we see the unit-by-unit rent roll, current vacancy, and any below-market leases? What's the average tenancy length?
- What capital expenditures (roof, boiler, parking lot, exteriors) have been made in the last 5 years, and what's planned in the next 2?
- Built in 1910 — when were the roof, HVAC, electrical panel, plumbing, and water heater last replaced?
- Is there a deadline driving the sale (1031 exchange, divorce, estate, relocation)? That informs how much negotiation room exists.
- Crime grade is F in this area — have there been break-ins, vandalism, or insurance claims at this property in the last 3 years? What carrier currently insures it and at what premium?
- What's the average days-on-market for RENTAL listings here right now (not sales)? A rising rental-DOM trend means longer vacancies and softer asking-rent achievability than the comps imply.
- What's the recent tenant-quality profile in this submarket — average credit score on applications, eviction rate, late-payment / NSF rate, and stable-employment percentage? A property-management company in the area should have these aggregated.
- How much new apartment / multifamily construction is in the pipeline within 1–3 miles? Heavy new supply (>2% of stock underway) typically softens rents 12–24 months out; light construction supports rent growth.
Investment metrics
- 1% rule
- 3.37% ✓
- Cap rate
- 29.97%
- Cash-on-cash
- 84.57%
- DSCR
- 4.76
- GRM
- 2.5
CMA / ARV
No comps found within radius.
Projected returns pro-forma
-3.0% appreciation · 5.48% rent growth · sell at horizon
- IRR
- 87.8%
- Equity multiple
- 5.22×
- Total profit
- $164,232
- Equity at exit
- $20,725
- IRR
- 91.4%
- Equity multiple
- 11.79×
- Total profit
- $420,005
- Equity at exit
- $12,018
Cash invested: $38,920 (down + closing). Projections, not guarantees.
Landlord ↔ Tenant lean methodology
- Overall (STATE)
- 15 Strongly Tenant-Friendly
- State New York
- 15 Strongly Tenant-Friendly · D+10
- County
- — inherits STATE
- City
- — inherits STATE
ZIP-level market 14204
- Home prices YoY
- -1.1%
- Rents YoY
- 5.5%
- Active inventory
- 33
- Price-to-rent
- 4.9×
Monthly cashflow live
- Estimated rent
- $4,688 high interval (Pro) →
- Mortgage (P&I)
- −$729
- Tax est. 1.5%
- −$174 /mo · $2,085/yr
- Insurance
- −$58
- HOA
- −$0
- Vacancy / Maint / Mgmt
- −$984
- Net cashflow
- $2,743
Break-even live
2-unit breakdown (identical units grouped — click to expand)
| Units | Beds | Baths | Est. rent |
|---|---|---|---|
| 2× units | 3 | 1 | $4,688 |
| #1 | 3 | 1 | $2,344 |
| #2 | 3 | 1 | $2,344 |
| Total (2 units) | $4,688 | ||
UW: 25.0% down · 7.5% · 30yr · 1.5% tax · 5.0% vac · 8.0% maint · 8.0% mgmt
Financing live
Cash to close
- Down payment
- $34,750
- Closing costs
- $4,170
- Reserves months
- —
- Total cash needed
- —
Loan-product check · same deal, 3 products live
Conventional
25% down · 7.5% · 30yr
- Down + closing
- —
- Monthly P&I
- —
- Monthly cashflow
- —
- DSCR
- —
- Eligible?
- —
Personal DTI + credit; lowest rate.
DSCR
20% down · 8.5% · 30yr
- Down + closing
- —
- Monthly P&I
- —
- Monthly cashflow
- —
- DSCR
- —
- Eligible?
- —
No personal income docs; deal must DSCR.
Hard money
10% down · 12.0% · 12mo
- Down + closing
- —
- Monthly P&I
- —
- Monthly cashflow
- —
- DSCR
- —
- Eligible?
- —
Short-term bridge; refi at stabilization.
Rent comps 2 comps
| Address | Beds | Baths | Sqft | Rent | $/sqft | DOM | Units | Dist |
|---|---|---|---|---|---|---|---|---|
| 237 Main St Buffalo, NY | 1.0–3.0 | 1.5–2.5 | 1608 | $4,035 | $2.51 | 1d | 9 | 1.05mi |
| 491 Emslie St Buffalo, NY | 3.0 | 1.0 | 2488 | $1,200 | $0.48 | 14d | 1 | 1.42mi |
Listing history 18 events
-
2026-06-18days on market $139,000 Active 30 DOM
-
2026-06-17days on market $139,000 Active 29 DOM
-
2026-06-16days on market $139,000 Active 28 DOM
-
2026-06-15days on market $139,000 Active 27 DOM
-
2026-06-13days on market $139,000 Active 25 DOM
-
2026-06-13days on market $139,000 Active 24 DOM
-
2026-06-10pricedays on market $139,000 Active 22 DOM
-
2026-06-09days on market $159,000 Active 21 DOM
-
2026-06-08days on market $159,000 Active 20 DOM
-
2026-06-07days on market $159,000 Active 19 DOM
-
2026-06-03days on market $159,000 Active 15 DOM
-
2026-06-02days on market $159,000 Active 14 DOM
-
2026-06-01days on market $159,000 Active 13 DOM
-
2026-05-31days on market $159,000 Active 12 DOM
-
2026-05-19$159,000 Active
-
2025-10-02historical $1,200
-
2025-08-30$1,200
-
2021-09-10soldstatus $76,000
ⓘ Source: listings_history table (triggers on properties + properties_extension) + one-shot
backfill from property_details.listing_events for pre-trigger history.
Climate risk First Street
- Flood 6/10 Major FEMA zone X (unshaded) · 75% chance over 30 yrs
- Wildfire 1/10 Low
- Heat 3/10 Moderate 7 d/yr ≥91°F today · 15 d/yr by 30 yrs out
- Wind 1/10 Low
- Air quality 4/10 Moderate 4 unhealthy d/yr today · 9 by 30 yrs out
Nearby sold comps map
Loading sold comps map…
Walkable amenities ~0.75 mi
Loading nearby amenities…
Taxation est. · year 1
- Rental income
- $56,256
- − Mortgage interest
- −$7,786
- − Property taxes
- −$2,085
- − Insurance
- −$695
- − Repairs & maintenance
- −$4,500
- − Management
- −$4,500
- − Depreciation
- −$4,044
- Taxable income
- $32,645
- Est. tax owed @ 24.0%
- −$7,835
- After-tax cash flow
- $25,080/yr
For passive investors: Depreciation is non-cash, so a rental often shows a tax loss while cash-flowing — sheltering income. Rental losses are passive: they offset passive income freely, and up to $25,000/yr can offset ordinary (W-2) income if you actively participate and your MAGI is under $100k (phasing out to $0 by $150k); unused losses carry forward. On sale, claimed depreciation is recaptured at up to 25%, and gains may owe capital-gains tax (a 1031 exchange can defer both). Figures are a year-1 estimate at your 24.0% rate — not tax advice; consult a CPA.
Schools (NCES district)
- District
- Buffalo City School District
- NCES district ID
- 3605850
- Math proficiency
- 41% ▲ 11.00%
- Reading proficiency
- 40% ▲ 7.00%
- Median HH income
- $31,665
- Composite
- 33.17/100
- National rank
- #5544
- State rank
- #535 of 590 in NY
Livability — Buffalo
- Score
- 77/100
- State rank
- #195
- US rank
- #3011
Category grades
Schools grade is shown separately in the Schools card above.
Census & demographics
- Census place
- Buffalo, NY
- County
- Erie County · 714,559 people
- City population
- 440,021
- Metro
- Buffalo-Cheektowaga, NY
- Population (ZIP)
- 7,932
- Household income
- $28,182
- Rent vs Own
- Severe rent burden
- 945.0
Population outlook (Erie County) Hauer SSP2
- Today (2025)
- 933,037 people
- By 2030
- 935,181 · +0.2%
- By 2040
- 928,531 · -0.5%
- By 2050
- 905,725 · -2.9%
- By 2075
- 834,037 · -10.6%
- By 2100
- 708,033 · -24.1%
Race, ethnicity, and origin ACS 2023
- Neighborhood character
- Diverse neighborhood (Simpson 0.60)
- Race & ethnicity
- Black 58% White 19% Hispanic / Latino 18% Two or more races 4%
- Hispanic origin (detail)
- Puerto Rican 14% Dominican 1%
- Common ancestry
- Romanian 2% Subsaharan African 1%
- Foreign-born
- 6% · Canada
- Languages at home
- 81% English-only · Spanish 14% French/Haitian/Cajun 2% Russian/Polish/Slavic 1%
Political lean MEDSL · Erie
- 2024 margin
- Lean D (+9.7) · D 54.8% · R 45.2%
- 2008→2024 swing
- -7.9pp toward R · 2008: 17.5pp · 2024: 9.7pp
- All cycles
- 2024: D+9.7 2020: D+14.7 2016: D+4.8 2012: D+15.6 2008: D+17.5
Not yet ingested
- Civics
- —
Market trends
- HPI YoY
- ▼ -3.36%
- Current HPI
- 312.6232
- Rent YoY
- ▲ 5.48%
- Metro
- Buffalo-Cheektowaga, NY
- State GDP YoY
- ▲ 2.60%
- F500 in state
- 92
Industry mix (Fortune 500 HQ in NY)
| Industry | F500 HQs | Revenue |
|---|---|---|
| Financial Services | 10 | $950B |
|
||
| Consumer Goods | 9 | $162B |
|
||
| Insurance | 4 | $225B |
|
||
| Telecommunications | 2 | $144B |
|
||
| Pharmaceuticals | 2 | $112B |
|
||
| Media / Entertainment | 2 | $69B |
|
||
Price history
+109.2% since first listed4 events — show timeline
- 2026-05-19 Listed $159,000 WNYREIS
- 2025-10-02 Rental Removed $1,200 PROPERTYWARE
- 2025-08-30 Listed for Rent $1,200 PROPERTYWARE
- 2021-09-10 Sold (Public Records) $76,000 Public Records
Property tax history
+2.8%/yrLatest (2025): $179 · +0.0% YoY. Source: county tax records.
Cash-flow waterfall
monthlySold comps — $/sqft
last 12 mo · ≤1 miLoading sold comps…