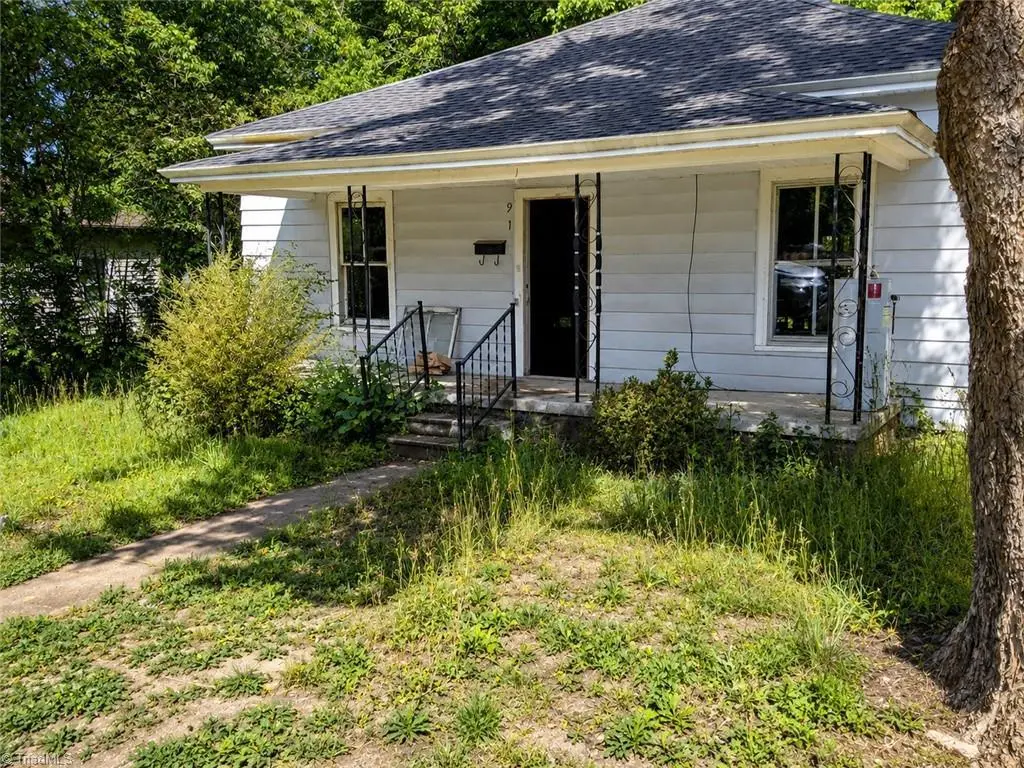
911 Tulloch St · Eden, NC
Flood risk 1/10 · Minimal
- FEMA flood zone
- X (unshaded)
- Chance of flooding over 30 yrs
- 0.0%
- Est. flood insurance / yr
- $507 – $1,088
Fire risk 3/10 · Minor
- Est. fire insurance / yr
- $906 – $1,684
Heat risk 6/10 · Moderate
- Hot days now (above 104°F)
- 7 days/yr
- Hot days in 30 yrs
- 18 days/yr
Wind risk 3/10 · Minor
- Chance of severe wind over 30 yrs
- 6.0%
Air-quality risk 2/10 · Minimal
- Unhealthy air days now
- 2 days/yr
- Unhealthy air days in 30 yrs
- 2 days/yr
Risk factors via First Street. Map © Google.
Why this score? — see what drove the B- grade
The composite is a weighted blend of 9 inputs, each scored 0–100. Each bar is that input's sub-score; the figure is the points it added to the 100-point composite (weight × sub-score).
- Cash flow +30.0/30.0
- 1% rule +10.0/10.0
- DSCR +10.0/10.0
- ARV discount +7.5/15.0
- Livability +3.4/5.0
- Schools +3.3/10.0
- Rent growth +2.5/5.0
- Condition / age +2.5/5.0
- Appreciation +0.0/10.0
$29,900
🖨 Deal sheet 📄 Offer letter ✓ Due diligence
Listing remarks MLS
Priced below tax value! Home with aluminum siding and a covered front porch located on low-traffic street just off Harris Street near the old Boys & Girls Club. Nice double carport and storage building and a deck. Fantastic central location. Payments probably cheaper than rent!
Key facts
- Approx 0.24 acre lot
- Built 1927
- Listed 17 days
Tags
Property features AI
Finance
- Other: Building area reported as 1,016 (area value provided)
- HOA & community: No homeowners association
Exterior
- Parking: Gravel parking; On-street parking available
- Utilities: Public water source; Public sewer; No water heater listed
- Home design: Residential stick/site-built house; One-story; Built in 1927; Existing structure
- Construction: Brick and vinyl siding exterior
- Exterior features: Public maintained road access; Lot located in West Burton subdivision; Lot number 2
Interior
- Bedrooms: Total of 1 room (studio/combined living space)
- Bathrooms: One full bathroom
- Heating & cooling: No central heating; No cooling; No heating fuel (no fuel)
- Interior features: Primary bedroom on main level
Neighborhood map
What this means for you Summary
Snapshot
- This is a 2-bed/1.0-bath single-family listed at $30k.
Deal economics
- At list price, monthly cash flow is $519 ($6k/yr) — positive.
- The deal already cash-flows at list — no discount required.
- Meets the 1% rule at list price ($932 rent vs $30k).
- Recommended offer: $29k (1.5% below list) — sets the bar for market timing.
- Cap rate 27.1% vs local median 4.3% in Eden — top-decile yield for the area; either an underpriced asset or a hidden risk that comps aren't pricing in. Stress-test before assuming the spread holds.
Location & tenants
- Location reads 67/100 on livability (#224 in NC) — a middle-class / working-renter tenant base. Strengths: cost of living A+, housing A+, health & safety A+; Watch: schools F, crime D-, amenities F.
- Rockingham County Schools (rural): math 38% / reading 40% proficiency, ranked #120 of 178 in NC (top 67%) — families likely to look elsewhere, expect single-tenant / working-renter base with shorter leases.
- Market conditions: 208 active listings in the ZIP; 2 comparable units currently listed for rent nearby; 344 units permitted in Rockingham County in 2024 (0 in 5+ unit buildings).
Forward outlook
- Local home prices are declining (-3.0%/yr); year-one equity from $207 of loan paydown is wiped out by about $897 of value loss. Plan a longer hold.
- Rockingham County population projected at -22% by 2050 — secular population decline; favor cash flow + early exit over multi-decade hold.
- At projected returns (-3.0% appreciation + 3.0% rent growth), your $8k cash investment doubles in ~2 years — after that, you're playing with house money.
Negotiation context
- It's been on market 17 days — a 2% lower offer ($29k) is reasonable based on typical stale-listing flexibility.
- 2 sale attempts since 9y ago; this cycle's ask has dropped $10k (25%) from the opening price — seller is motivated, your offer sets the floor, not the list.
Risks & watch-outs
- Watch-outs: built in 1927 — expect roof / HVAC / electrical / plumbing capex.
- Climate carrying-cost: extreme-heat days projected 7→18/yr by 2055 (HVAC capex compounding) — expect insurance premiums to compound above CPI over the hold.
Questions for the listing agent
- Built in 1927 — when were the roof, HVAC, electrical panel, plumbing, and water heater last replaced?
- Is there a deadline driving the sale (1031 exchange, divorce, estate, relocation)? That informs how much negotiation room exists.
- Schools are F-rated, which usually means shorter tenancies and higher turnover. Who's the typical renter profile here, and what's been the actual vacancy rate?
- Crime grade is D in this area — have there been break-ins, vandalism, or insurance claims at this property in the last 3 years? What carrier currently insures it and at what premium?
- What's the average days-on-market for RENTAL listings here right now (not sales)? A rising rental-DOM trend means longer vacancies and softer asking-rent achievability than the comps imply.
- What's the recent tenant-quality profile in this submarket — average credit score on applications, eviction rate, late-payment / NSF rate, and stable-employment percentage? A property-management company in the area should have these aggregated.
- How much new for-sale + rental construction is in the pipeline within 1–3 miles? Heavy new supply typically softens prices + rents 12–24 months out; constrained supply supports both.
Investment metrics
- 1% rule
- 3.12% ✓
- Cap rate
- 27.14%
- Cash-on-cash
- 74.45%
- DSCR
- 4.31
- GRM
- 2.7
CMA / ARV
- ARV (on-the-fly)
- $145,288
- Comps found
- 12
Show comp detail 12 sales within ~0.75 mi
| Address | Dist | Beds/Ba | Sqft | Sold | Price | $/sf | Match |
|---|---|---|---|---|---|---|---|
| 910 Branch St | 0.20mi | 2/1.0 | 1,050 (+3%) | 6mo | $149,900 | $143 | 80 |
| 963 Harris St | 0.13mi | 2/1.5 | 1,066 (+5%) | 10mo | $140,000 | $131 | 75 |
| 508 Prospect St | 0.57mi | 2/1.0 | 1,002 (-1%) | 9mo | $139,900 | $140 | 64 |
| 607 Forbes St | 0.56mi | 2/1.0 | 952 (-6%) | 0mo | $125,000 | $131 | 63 |
| 608 Cedar St | 0.48mi | 2/1.0 | 924 (-9%) | 3mo | $87,000 | $94 | 60 |
| 1008 Lawson St | 0.50mi | 3/2.0 (+1) | 990 (-3%) | 4mo | $185,000 | $187 | 60 |
| 1123 Manning St | 0.42mi | 3/1.0 (+1) | 1,080 (+6%) | 8mo | $171,000 | $158 | 58 |
| 621 Patterson St | 0.40mi | 2/1.0 | 921 (-9%) | 11mo | $70,000 | $76 | 56 |
| 1120 Manning St | 0.39mi | 2/1.0 | 1,167 (+15%) | 10mo | $175,000 | $150 | 49 |
| 1203 Lawson St | 0.62mi | 3/1.0 (+1) | 1,124 (+11%) | 0mo | $169,000 | $150 | 48 |
| 1313 Rivercrest Dr | 0.68mi | 3/1.0 (+1) | 925 (-9%) | 1mo | $110,000 | $119 | 48 |
| 503 Cedar St | 0.63mi | 2/1.0 | 884 (-13%) | 1mo | $145,000 | $164 | 48 |
Match score weights: distance 35% · size 25% · config 20% · recency 20%. Top-matched comps best support the ARV.
Projected returns pro-forma
-3.0% appreciation · 3.0% rent growth · sell at horizon
- IRR
- 74.3%
- Equity multiple
- 4.38×
- Total profit
- $28,256
- Equity at exit
- $4,458
- IRR
- 78.1%
- Equity multiple
- 9.04×
- Total profit
- $67,283
- Equity at exit
- $2,585
Cash invested: $8,372 (down + closing). Projections, not guarantees.
Landlord ↔ Tenant lean methodology
- Overall (STATE)
- 85 Strongly Landlord-Friendly
- State North Carolina
- 85 Strongly Landlord-Friendly · R+3
- County
- — inherits STATE
- City
- — inherits STATE
ZIP-level market 27288
- Home prices YoY
- -26.5%
- Active inventory
- 208
- Price-to-rent
- 2.7×
Monthly cashflow live
- Estimated rent
- $932 medium interval (Pro) →
- Mortgage (P&I)
- −$157
- Tax from tax record
- −$48 /mo · $573/yr
- Insurance
- −$12
- HOA
- −$0
- Vacancy / Maint / Mgmt
- −$196
- Net cashflow
- $519
Break-even live
UW: 25.0% down · 7.5% · 30yr · 1.5% tax · 5.0% vac · 8.0% maint · 8.0% mgmt
Financing live
Cash to close
- Down payment
- $7,475
- Closing costs
- $897
- Reserves months
- —
- Total cash needed
- —
Loan-product check · same deal, 3 products live
Conventional
25% down · 7.5% · 30yr
- Down + closing
- —
- Monthly P&I
- —
- Monthly cashflow
- —
- DSCR
- —
- Eligible?
- —
Personal DTI + credit; lowest rate.
DSCR
20% down · 8.5% · 30yr
- Down + closing
- —
- Monthly P&I
- —
- Monthly cashflow
- —
- DSCR
- —
- Eligible?
- —
No personal income docs; deal must DSCR.
Hard money
10% down · 12.0% · 12mo
- Down + closing
- —
- Monthly P&I
- —
- Monthly cashflow
- —
- DSCR
- —
- Eligible?
- —
Short-term bridge; refi at stabilization.
Rent comps 2 comps
| Address | Beds | Baths | Sqft | Rent | $/sqft | DOM | Units | Dist |
|---|---|---|---|---|---|---|---|---|
| 326 Cedar St Unit H Eden, NC | 2.0 | 1.0 | 780 | $975 | $1.25 | 23d | 1 | 0.82mi |
| 704 Irving Ave Unit A Eden, NC | 2.0 | 1.0 | 900 | $900 | $1.00 | 23d | 1 | 1.06mi |
Listing history 16 events
-
2026-06-09status $29,900 Pending 17 DOM
-
2026-06-08days on market $29,900 Active 17 DOM
-
2026-06-07remarks 622-char remark
-
2026-06-07pricedays on market $29,900 Active 16 DOM
-
2026-06-03days on market $40,000 Active 12 DOM
-
2026-06-02days on market $40,000 Active 11 DOM
-
2026-06-01days on market $40,000 Active 10 DOM
-
2026-05-31days on market $40,000 Active 9 DOM
-
2026-05-31days on market $40,000 Active 8 DOM
-
2026-05-20status Pending
-
2026-05-14$40,000 Active
-
2018-03-23soldstatus $30,000 Sold 286-char remark
Show marketing remark (286 chars)
Priced below tax value! Home with aluminum siding and a covered front porch located on low-traffic street just off Harris Street near the old Boys & Girls Club. Nice double carport and storage building and a deck. Fantastic central location. Payments probably cheaper than rent!
-
2018-03-23soldstatus $30,100
Show marketing remark (286 chars)
Priced below tax value! Home with aluminum siding and a covered front porch located on low-traffic street just off Harris Street near the old Boys & Girls Club. Nice double carport and storage building and a deck. Fantastic central location. Payments probably cheaper than rent!
-
2018-03-01status Pending 286-char remark
Show marketing remark (286 chars)
Priced below tax value! Home with aluminum siding and a covered front porch located on low-traffic street just off Harris Street near the old Boys & Girls Club. Nice double carport and storage building and a deck. Fantastic central location. Payments probably cheaper than rent!
-
2018-02-06historical Due Diligence Period 286-char remark
Show marketing remark (286 chars)
Priced below tax value! Home with aluminum siding and a covered front porch located on low-traffic street just off Harris Street near the old Boys & Girls Club. Nice double carport and storage building and a deck. Fantastic central location. Payments probably cheaper than rent!
-
2017-06-13$30,000 Active 286-char remark
Show marketing remark (286 chars)
Priced below tax value! Home with aluminum siding and a covered front porch located on low-traffic street just off Harris Street near the old Boys & Girls Club. Nice double carport and storage building and a deck. Fantastic central location. Payments probably cheaper than rent!
ⓘ Source: listings_history table (triggers on properties + properties_extension) + one-shot
backfill from property_details.listing_events for pre-trigger history.
Tax reassessment forecast NC · Resets to sale price
- Current annual tax
- $573 · $48/mo
- Projected year-2 tax
- $573 · $48/mo
- Expected delta
- $0/yr ($0/mo · 0.0%)
ⓘ Screening estimate from a state-policy table — verify with the county assessor before closing.
Climate risk First Street
- Flood 1/10 Low FEMA zone X (unshaded) · 0% chance over 30 yrs
- Wildfire 3/10 Moderate
- Heat 6/10 Major 7 d/yr ≥104°F today · 18 d/yr by 30 yrs out
- Wind 3/10 Moderate 6% chance of damaging wind over 30 yrs
- Air quality 2/10 Low 2 unhealthy d/yr today · 2 by 30 yrs out
Nearby sold comps map
Loading sold comps map…
Walkable amenities ~0.75 mi
Loading nearby amenities…
Taxation est. · year 1
- Rental income
- $11,185
- − Mortgage interest
- −$1,675
- − Property taxes
- −$573
- − Insurance
- −$150
- − Repairs & maintenance
- −$895
- − Management
- −$895
- − Depreciation
- −$870
- Taxable income
- $6,129
- Est. tax owed @ 24.0%
- −$1,471
- After-tax cash flow
- $4,762/yr
For passive investors: Depreciation is non-cash, so a rental often shows a tax loss while cash-flowing — sheltering income. Rental losses are passive: they offset passive income freely, and up to $25,000/yr can offset ordinary (W-2) income if you actively participate and your MAGI is under $100k (phasing out to $0 by $150k); unused losses carry forward. On sale, claimed depreciation is recaptured at up to 25%, and gains may owe capital-gains tax (a 1031 exchange can defer both). Figures are a year-1 estimate at your 24.0% rate — not tax advice; consult a CPA.
Schools (NCES district)
- District
- Rockingham County Schools
- NCES district ID
- 3703990
- Math proficiency
- 38% ▼ -2.00%
- Reading proficiency
- 40% ▲ 1.00%
- Median HH income
- $38,914
- Composite
- 32.6/100
- National rank
- #5673
- State rank
- #120 of 178 in NC
Livability — Eden
- Score
- 67/100
- State rank
- #224
- US rank
- #10535
Category grades
Schools grade is shown separately in the Schools card above.
Census & demographics
- Census place
- Eden, NC
- County
- Rockingham County · 22,926 people
- City population
- 22,926
- Metro
- Greensboro-High Point, NC
- Population (ZIP)
- 22,926
- Household income
- $52,594
- Rent vs Own
- Severe rent burden
- 860.0
Population outlook (Rockingham County) Hauer SSP2
- Today (2025)
- 87,103 people
- By 2030
- 83,763 · -3.8%
- By 2040
- 76,082 · -12.7%
- By 2050
- 68,106 · -21.8%
- By 2075
- 52,531 · -39.7%
- By 2100
- 39,871 · -54.2%
Race, ethnicity, and origin ACS 2023
- Neighborhood character
- Predominantly White (67%)
- Race & ethnicity
- White 67% Black 23% Hispanic / Latino 6% Two or more races 5% Native American 1%
- Hispanic origin (detail)
- Mexican 4%
- Common ancestry
- Serbian 2% Slovak 2% Lithuanian 1%
- Foreign-born
- 3% · Canada
- Languages at home
- 94% English-only · Spanish 5% German/W. Germanic 1%
Political lean MEDSL · Rockingham
- 2024 margin
- Solid R (+35.9) · D 31.7% · R 67.6%
- 2008→2024 swing
- -19.9pp toward R · 2008: -16.0pp · 2024: -35.9pp
- All cycles
- 2024: R+35.9 2020: R+32.0 2016: R+30.0 2012: R+21.3 2008: R+16.0
Not yet ingested
- Civics
- —
Market trends
- HPI YoY
- ▼ -66.28%
- Current HPI
- 183.5709
- Rent YoY
- —
- Metro
- Greensboro-High Point, NC
- State GDP YoY
- ▲ 3.28%
- F500 in state
- 26
Industry mix (Fortune 500 HQ in NC)
| Industry | F500 HQs | Revenue |
|---|---|---|
| Financial Services | 2 | $213B |
|
||
| Retail | 2 | $95B |
|
||
| Industrial Conglomerate | 1 | $38B |
|
||
| Metals / Steel | 1 | $35B |
|
||
| Utilities | 1 | $30B |
|
||
| Industrial Machinery | 1 | $19B |
|
||
Price history
+33.3% since first listed7 events — show timeline
- 2026-05-20 Pending — Triad MLS
- 2026-05-14 Listed $40,000 Triad MLS
- 2018-03-23 Sold (Public Records) $30,100 Public Records
- 2018-03-23 Sold (MLS) $30,000 Triad MLS
- 2018-03-01 Pending — Triad MLS
- 2018-02-06 Contingent — Triad MLS
- 2017-06-13 Listed $30,000 Triad MLS
Property tax history
+2.1%/yrLatest (2025): $573 · +0.0% YoY. Source: county tax records.
Cash-flow waterfall
monthlySold comps — $/sqft
last 12 mo · ≤1 miLoading sold comps…