7514 Glen Manor Dr · Houston, TX
Flood risk 3/10 · Minor
- FEMA flood zone
- X (unshaded)
- Chance of flooding over 30 yrs
- 0.2%
- Est. flood insurance / yr
- $507 – $1,088
Fire risk 1/10 · Minimal
- Est. fire insurance / yr
- $1,222 – $2,270
Heat risk 9/10 · Severe
- Hot days now (above 111°F)
- 7 days/yr
- Hot days in 30 yrs
- 24 days/yr
Wind risk 9/10 · Severe
- Chance of severe wind over 30 yrs
- 99.0%
Air-quality risk 3/10 · Minor
- Unhealthy air days now
- 2 days/yr
- Unhealthy air days in 30 yrs
- 3 days/yr
Risk factors via First Street. Map © Google.
Why this score? — see what drove the C grade
The composite is a weighted blend of 9 inputs, each scored 0–100. Each bar is that input's sub-score; the figure is the points it added to the 100-point composite (weight × sub-score).
- Cash flow +15.2/30.0
- ARV discount +14.5/15.0
- Appreciation +7.6/10.0
- 1% rule +4.9/10.0
- DSCR +4.7/10.0
- Livability +3.7/5.0
- Schools +2.7/10.0
- Condition / age +2.2/5.0
- Rent growth +2.1/5.0
$160,000
🖨 Deal sheet 📄 Offer letter ✓ Due diligence
Listing remarks MLS
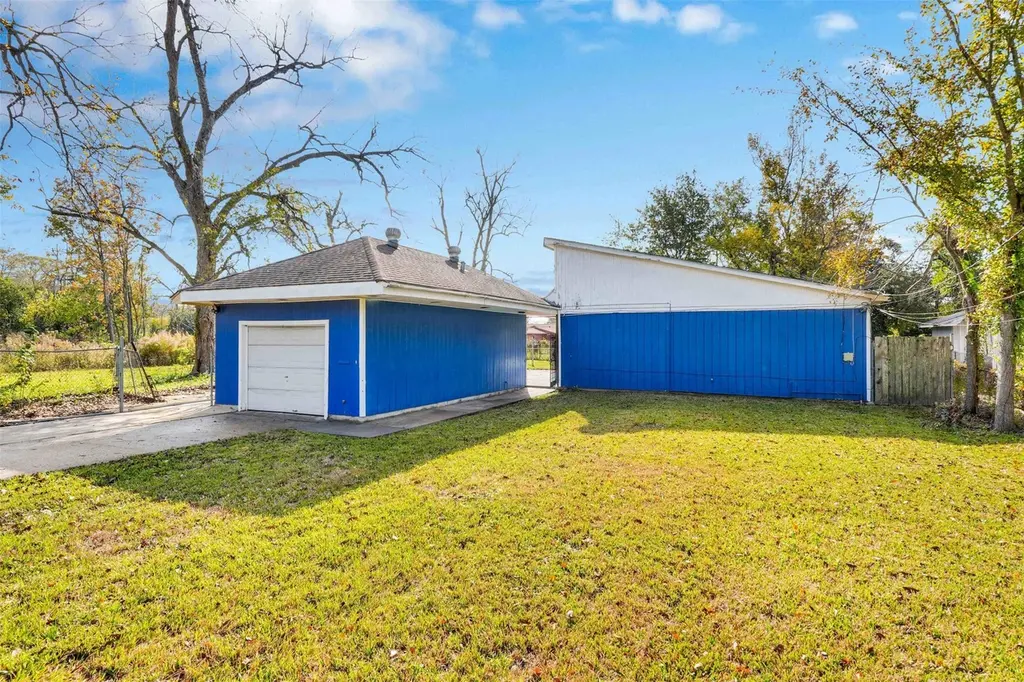
Investor special with income potential in a prime Houston location. Welcome to 7514 Glen Manor Dr — a 3–4 bedroom, 2-bath home with a flexible layout and bonus in-law suite/garage apartment ideal for rental income, multigenerational living, or a value-add strategy. Inside, you’ll find an open-concept layout with oversized tile flooring throughout, abundant natural light, and connected living, dining, and kitchen spaces designed for easy living and entertaining. The clean finishes and functional floor plan make this property move-in ready while still offering upside potential for investors or buyers looking to build equity. The separate living quarters create multiple possibilities: short-term rental, long-term tenant, guest suite, home office, or additional passive income stream. Conveniently located near major highways, shopping, and downtown Houston access. Opportunities with built-in income potential at this price point are hard to find. Tour today!
Key facts
- Private backyard
- Flexible layout
- 8,999 sq ft lot
Tags
Neighborhood map
What this means for you Summary
Snapshot
- This is a 2-bed/1.0-bath single-family listed at $160k. Condition is rated fair.
Deal economics
- At list price, monthly cash flow is $56 ($667/yr) — positive.
- The deal already cash-flows at list — no discount required.
- To meet the 1% rule (rent ≥ 1% of price), the offer needs to be $159k (0.5% below list).
- Recommended offer: $158k (1.5% below list) — sets the bar for market timing.
- Cap rate 6.7% vs local median 3.2% in Houston — top-decile yield for the area; either an underpriced asset or a hidden risk that comps aren't pricing in. Stress-test before assuming the spread holds.
Location & tenants
- Location reads 74/100 on livability (#184 in TX, #4,771 nationally) — a middle-class / working-renter tenant base. Strengths: amenities A+, cost of living A+, housing A+; Watch: schools D, crime F.
- Houston ISD (urban): math 27% / reading 35% proficiency, ranked #593 of 826 in TX (top 72%) — families likely to look elsewhere, expect single-tenant / working-renter base with shorter leases; 71% free/reduced lunch — lower-income household profile, screen leases tightly.
- Market conditions: Rents soft (-1.6%/yr); 353 active listings in the ZIP; 40 comparable units currently listed for rent nearby; rentals at typical pace (median 24d on market — plan ~3-4 weeks tenant-placement turnaround); 48% of comp listings sitting > 30 days — soft ceiling on asking rent; lower-income renter base — watch delinquency; 29,883 units permitted in Harris County in 2024 (8,621 in 5+ unit buildings).
- At $1,592/mo this rent would consume 50% of the median local household income ($38k/yr) (locally 1177% of renters already pay >50% of income on rent) — very limited rent-growth headroom before tenants either downsize or default.
Forward outlook
- In year one you build about $9k of equity ($1k loan paydown + $8k appreciation (5.2% local appreciation)).
- Harris County population projected at +47% by 2050 — long-run rental-demand tailwind backs the buy-and-hold thesis.
- At projected returns (5.2% appreciation + 0.0% rent growth), your $45k cash investment doubles in ~5 years — after that, you're playing with house money.
- By year 4, paydown + projected appreciation supports a ~$32k cash-out refi (75% LTV) — recoverable capital for the next deal without selling this one.
Negotiation context
- It's been on market 24 days — a 2% lower offer ($158k) is reasonable based on typical stale-listing flexibility.
Risks & watch-outs
- Climate carrying-cost: severe wind risk, 99% chance of damaging wind over 30y; extreme-heat days projected 7→24/yr by 2055 (HVAC capex compounding) — expect insurance premiums to compound above CPI over the hold.
Questions for the listing agent
- Have any recent inspections been done? Can we get a copy of the seller's disclosures and any deferred-maintenance estimates?
- Built in 1967 — when were the roof, HVAC, electrical panel, plumbing, and water heater last replaced?
- Is there a deadline driving the sale (1031 exchange, divorce, estate, relocation)? That informs how much negotiation room exists.
- Schools are D-rated, which usually means shorter tenancies and higher turnover. Who's the typical renter profile here, and what's been the actual vacancy rate?
- Crime grade is F in this area — have there been break-ins, vandalism, or insurance claims at this property in the last 3 years? What carrier currently insures it and at what premium?
- What's the average days-on-market for RENTAL listings here right now (not sales)? A rising rental-DOM trend means longer vacancies and softer asking-rent achievability than the comps imply.
- What's the recent tenant-quality profile in this submarket — average credit score on applications, eviction rate, late-payment / NSF rate, and stable-employment percentage? A property-management company in the area should have these aggregated.
- How much new for-sale + rental construction is in the pipeline within 1–3 miles? Heavy new supply typically softens prices + rents 12–24 months out; constrained supply supports both.
Investment metrics
- 1% rule
- 0.99% ✗
- Cap rate
- 6.71%
- Cash-on-cash
- 1.49%
- DSCR
- 1.07
- GRM
- 8.4
CMA / ARV
- ARV (median comp)
- $189,667
- List price
- $160,000
- Delta
- -7.73%
- Verdict
- FAIR
- Comps
- 20 within 1.0 mi
Show comp detail 12 sales within ~0.75 mi
| Address | Dist | Beds/Ba | Sqft | Sold | Price | $/sf | Match |
|---|---|---|---|---|---|---|---|
| 7626 Bellingham Dr | 0.29mi | 3/1.0 (+1) | 1,478 (+5%) | 1mo | $140,000 | $95 | 72 |
| 7101 Weyburn St Unit C | 0.57mi | 3/2.5 (+1) | 1,413 (+0%) | 1mo | $199,990 | $142 | 61 |
| 7131 S Hall St | 0.58mi | 3/1.0 (+1) | 1,348 (-4%) | 2mo | $110,000 | $82 | 59 |
| 7429 Springdale St | 0.17mi | 3/2.0 (+1) | 1,230 (-13%) | 9mo | $190,000 | $154 | 54 |
| 7229 Springdale St | 0.37mi | 3/1.0 (+1) | 1,247 (-12%) | 6mo | $195,000 | $156 | 54 |
| 7930 Carolwood Dr | 0.71mi | 3/1.5 (+1) | 1,366 (-3%) | 3mo | $99,900 | $73 | 52 |
| 7309 Orville St | 0.65mi | 3/1.5 (+1) | 1,490 (+6%) | 4mo | $200,000 | $134 | 50 |
| 7546 Delavan Dr | 0.58mi | 3/2.5 (+1) | 1,505 (+7%) | 4mo | $289,999 | $193 | 48 |
| 7206 Bywood St | 0.48mi | 3/2.0 (+1) | 1,266 (-10%) | 6mo | $230,000 | $182 | 46 |
| 7413 W Knoll St | 0.46mi | 3/2.0 (+1) | 1,616 (+15%) | 5mo | $229,500 | $142 | 41 |
| 7832 Dewitt St | 0.70mi | 3/2.0 (+1) | 1,594 (+13%) | 1mo | $264,900 | $166 | 36 |
| 7939 Carolwood Dr | 0.72mi | 3/2.0 (+1) | 1,620 (+15%) | 2mo | $122,900 | $76 | 31 |
Match score weights: distance 35% · size 25% · config 20% · recency 20%. Top-matched comps best support the ARV.
Projected returns pro-forma
5.25% appreciation · 0.0% rent growth · sell at horizon
- IRR
- 13.3%
- Equity multiple
- 1.85×
- Total profit
- $38,082
- Equity at exit
- $93,061
- IRR
- 12.9%
- Equity multiple
- 3.30×
- Total profit
- $103,243
- Equity at exit
- $162,622
Cash invested: $44,800 (down + closing). Projections, not guarantees.
Landlord ↔ Tenant lean methodology
- Overall (STATE)
- 87 Strongly Landlord-Friendly
- State Texas
- 87 Strongly Landlord-Friendly · R+5
- County
- — inherits STATE
- City
- — inherits STATE
ZIP-level market 77028
- Home prices YoY
- 2.0%
- Rents YoY
- -1.6%
- Active inventory
- 353
- Price-to-rent
- 8.4×
Monthly cashflow live
- Estimated rent
- $1,592 high interval (Pro) →
- Mortgage (P&I)
- −$839
- Tax from tax record
- −$296 /mo · $3,554/yr
- Insurance
- −$67
- HOA
- −$0
- Vacancy / Maint / Mgmt
- −$334
- Net cashflow
- $56
Break-even live
UW: 25.0% down · 7.5% · 30yr · 1.5% tax · 5.0% vac · 8.0% maint · 8.0% mgmt
Financing live
Cash to close
- Down payment
- $40,000
- Closing costs
- $4,800
- Reserves months
- —
- Total cash needed
- —
Loan-product check · same deal, 3 products live
Conventional
25% down · 7.5% · 30yr
- Down + closing
- —
- Monthly P&I
- —
- Monthly cashflow
- —
- DSCR
- —
- Eligible?
- —
Personal DTI + credit; lowest rate.
DSCR
20% down · 8.5% · 30yr
- Down + closing
- —
- Monthly P&I
- —
- Monthly cashflow
- —
- DSCR
- —
- Eligible?
- —
No personal income docs; deal must DSCR.
Hard money
10% down · 12.0% · 12mo
- Down + closing
- —
- Monthly P&I
- —
- Monthly cashflow
- —
- DSCR
- —
- Eligible?
- —
Short-term bridge; refi at stabilization.
Rent comps 40 comps
| Address | Beds | Baths | Sqft | Rent | $/sqft | DOM | Units | Dist |
|---|---|---|---|---|---|---|---|---|
| 7601 Springdale St Houston, TX | 3.0 | 2.0 | 1224 | $1,200 | $0.98 | 15d | 1 | 0.14mi |
| 7418 Bywood St Houston, TX | 3.0 | 2.0 | 1300 | $1,800 | $1.38 | 24d | 1 | 0.29mi |
| 8015 Elbert St Unit A Houston, TX | 2.0 | 2.0 | 1021 | $1,650 | $1.62 | 7d | 1 | 0.40mi |
| 7804 Crestview Dr Unit A Houston, TX | 3.0 | 2.0 | 1150 | $1,550 | $1.35 | 22d | 1 | 0.48mi |
| 9324 Firnat St Unit B Houston, TX | 3.0 | 2.5 | 1600 | $1,900 | $1.19 | 22d | 1 | 0.51mi |
| 9410 Firnat St Unit B Houston, TX | 3.0 | 2.5 | 1500 | $1,900 | $1.27 | 43d | 1 | 0.54mi |
| 9314 Sundown Dr Unit A Houston, TX | 3.0 | 2.5 | 1608 | $1,695 | $1.05 | 15d | 1 | 0.55mi |
| 7119 Bywood St Unit A Houston, TX | 3.0 | 2.5 | 1150 | $1,795 | $1.56 | 43d | 1 | 0.56mi |
| 7914 Laura Koppe Rd Houston, TX | 3.0 | 2.0 | 1400 | $1,850 | $1.32 | 43d | 1 | 0.58mi |
| 8006 Lynette St Houston, TX | 3.0 | 1.0 | 1400 | $1,475 | $1.05 | 24d | 1 | 0.71mi |
| 8102 Crestview Dr Unit A Houston, TX | 3.0 | 2.5 | 1800 | $1,900 | $1.06 | 22d | 1 | 0.83mi |
| 8102 Crestview Dr Unit B Houston, TX | 3.0 | 2.5 | 1600 | $1,900 | $1.19 | 43d | 1 | 0.83mi |
| 7201 Hallshire Dr Houston, TX | 2.0 | 1.0 | 985 | $740 | $0.75 | 43d | 1 | 0.85mi |
| 7201 Hallshire Dr Unit 235 Houston, TX | 3.0 | 1.0 | 1100 | $850 | $0.77 | 43d | 1 | 0.85mi |
| 7201 Hallshire Dr Unit 222 Houston, TX | 2.0 | 1.0 | 985 | $700 | $0.71 | 43d | 1 | 0.85mi |
| 9550 N Wayside Dr Houston, TX | 1.0–3.0 | 1.0–2.0 | 896 | $1,199 | $1.34 | 1d | 5 | 0.86mi |
| 8203 Woodlyn Rd Unit C Houston, TX | 3.0 | 2.5 | 1650 | $1,650 | $1.00 | 7d | 1 | 0.97mi |
| 8113 Denton St Houston, TX | 3.0 | 2.0 | 1150 | $1,750 | $1.52 | 43d | 1 | 1.00mi |
| 8213 Linda Vista Rd Houston, TX | 3.0 | 2.0 | 1298 | $1,625 | $1.25 | 24d | 1 | 1.01mi |
| 8216 Richland Dr Unit B Houston, TX | 3.0 | 2.0 | 1150 | $1,750 | $1.52 | 43d | 1 | 1.03mi |
| 8238 Homewood Ln Houston, TX | 3.0 | 2.0 | 1696 | $1,695 | $1.00 | 24d | 1 | 1.07mi |
| 8309 Carolwood Dr Houston, TX | 3.0 | 1.0 | 938 | $1,350 | $1.44 | 43d | 1 | 1.15mi |
| 7973 Ritz St Houston, TX | 3.0 | 2.0 | 1076 | $2,250 | $2.09 | 7d | 1 | 1.19mi |
| 7252 Parker Rd Houston, TX | 3.0 | 1.0 | 916 | $1,650 | $1.80 | 43d | 1 | 1.21mi |
| 7830 Nashville St Houston, TX | 3.0 | 2.0 | 1175 | $1,800 | $1.53 | 7d | 1 | 1.26mi |
| 9422 Sandra St Unit B Houston, TX | 3.0 | 2.5 | 1461 | $1,875 | $1.28 | 43d | 1 | 1.31mi |
| 8122 Sterlingshire St Unit A Houston, TX | 3.0 | 2.0 | 1160 | $1,525 | $1.31 | 15d | 1 | 1.36mi |
| 8122 Sterlingshire St Unit B Houston, TX | 3.0 | 2.0 | 1160 | $1,450 | $1.25 | 15d | 1 | 1.36mi |
| 7945 Henson St Houston, TX | 3.0 | 2.0 | 1300 | $1,699 | $1.31 | 5d | 1 | 1.36mi |
| 7947 Henson St Houston, TX | 3.0 | 2.0 | 1090 | $1,349 | $1.24 | 5d | 1 | 1.36mi |
| 8235 Locksley Rd Unit A Houston, TX | 3.0 | 2.5 | 1608 | $1,525 | $0.95 | 7d | 1 | 1.37mi |
| 8639 Peachtree St Unit A Houston, TX | 3.0 | 2.5 | 1150 | $1,750 | $1.52 | 43d | 1 | 1.37mi |
| 5609 Denmark St Unit A Houston, TX | 3.0 | 2.0 | 1410 | $1,595 | $1.13 | 43d | 1 | 1.37mi |
| 8126 Sterlingshire St Unit B Houston, TX | 3.0 | 2.0 | 1150 | $1,350 | $1.17 | 24d | 1 | 1.37mi |
| 8346 Tidwell Rd Unit B Houston, TX | 3.0 | 2.0 | 980 | $1,000 | $1.02 | 43d | 1 | 1.39mi |
| 8350 Tidwell Rd Unit A Houston, TX | 3.0 | 2.0 | 980 | $975 | $0.99 | 43d | 1 | 1.40mi |
| 7966 Henson St Unit B Houston, TX | 3.0 | 2.0 | 1608 | $1,410 | $0.88 | 43d | 1 | 1.41mi |
| 7325 Boggess Rd Houston, TX | 3.0 | 2.0 | 1568 | $1,850 | $1.18 | 16d | 1 | 1.41mi |
| 7325 Boggess Rd Houston, TX | 3.0 | 2.0 | 1568 | $1,850 | $1.18 | 43d | 1 | 1.41mi |
| 8508 Wileyvale Rd Houston, TX | 2.0 | 2.0 | 1504 | $1,650 | $1.10 | 43d | 1 | 1.42mi |
Listing history 17 events
-
2026-06-18days on market $160,000 Active 24 DOM
-
2026-06-17days on market $160,000 Active 23 DOM
-
2026-06-16days on market $160,000 Active 22 DOM
-
2026-06-15days on market $160,000 Active 21 DOM
-
2026-06-13days on market $160,000 Active 19 DOM
-
2026-06-09days on market $160,000 Active 15 DOM
-
2026-06-08days on market $160,000 Active 14 DOM
-
2026-06-07days on market $160,000 Active 13 DOM
-
2026-06-04days on market $160,000 Active 10 DOM
-
2026-06-03days on market $160,000 Active 9 DOM
-
2026-06-02days on market $160,000 Active 8 DOM
-
2026-06-01days on market $160,000 Active 7 DOM
-
2026-05-31days on market $160,000 Active 6 DOM
-
2026-05-07price $175,000 984-char remark
Show marketing remark (984 chars)
Investor special with income potential in a prime Houston location. Welcome to 7514 Glen Manor Dr — a 3–4 bedroom, 2-bath home with a flexible layout and bonus in-law suite/garage apartment ideal for rental income, multigenerational living, or a value-add strategy. Inside, you’ll find an open-concept layout with oversized tile flooring throughout, abundant natural light, and connected living, dining, and kitchen spaces designed for easy living and entertaining. The clean finishes and functional floor plan make this property move-in ready while still offering upside potential for investors or buyers looking to build equity. The separate living quarters create multiple possibilities: short-term rental, long-term tenant, guest suite, home office, or additional passive income stream. Conveniently located near major highways, shopping, and downtown Houston access. Opportunities with built-in income potential at this price point are hard to find. Tour today!
-
2026-02-24price $180,000 984-char remark
Show marketing remark (984 chars)
Investor special with income potential in a prime Houston location. Welcome to 7514 Glen Manor Dr — a 3–4 bedroom, 2-bath home with a flexible layout and bonus in-law suite/garage apartment ideal for rental income, multigenerational living, or a value-add strategy. Inside, you’ll find an open-concept layout with oversized tile flooring throughout, abundant natural light, and connected living, dining, and kitchen spaces designed for easy living and entertaining. The clean finishes and functional floor plan make this property move-in ready while still offering upside potential for investors or buyers looking to build equity. The separate living quarters create multiple possibilities: short-term rental, long-term tenant, guest suite, home office, or additional passive income stream. Conveniently located near major highways, shopping, and downtown Houston access. Opportunities with built-in income potential at this price point are hard to find. Tour today!
-
2026-01-30price $189,000 984-char remark
Show marketing remark (984 chars)
Investor special with income potential in a prime Houston location. Welcome to 7514 Glen Manor Dr — a 3–4 bedroom, 2-bath home with a flexible layout and bonus in-law suite/garage apartment ideal for rental income, multigenerational living, or a value-add strategy. Inside, you’ll find an open-concept layout with oversized tile flooring throughout, abundant natural light, and connected living, dining, and kitchen spaces designed for easy living and entertaining. The clean finishes and functional floor plan make this property move-in ready while still offering upside potential for investors or buyers looking to build equity. The separate living quarters create multiple possibilities: short-term rental, long-term tenant, guest suite, home office, or additional passive income stream. Conveniently located near major highways, shopping, and downtown Houston access. Opportunities with built-in income potential at this price point are hard to find. Tour today!
-
2025-12-20$192,000 Active 984-char remark
Show marketing remark (984 chars)
Investor special with income potential in a prime Houston location. Welcome to 7514 Glen Manor Dr — a 3–4 bedroom, 2-bath home with a flexible layout and bonus in-law suite/garage apartment ideal for rental income, multigenerational living, or a value-add strategy. Inside, you’ll find an open-concept layout with oversized tile flooring throughout, abundant natural light, and connected living, dining, and kitchen spaces designed for easy living and entertaining. The clean finishes and functional floor plan make this property move-in ready while still offering upside potential for investors or buyers looking to build equity. The separate living quarters create multiple possibilities: short-term rental, long-term tenant, guest suite, home office, or additional passive income stream. Conveniently located near major highways, shopping, and downtown Houston access. Opportunities with built-in income potential at this price point are hard to find. Tour today!
ⓘ Source: listings_history table (triggers on properties + properties_extension) + one-shot
backfill from property_details.listing_events for pre-trigger history.
Tax reassessment forecast TX · Resets to sale price
- Current annual tax
- $3,554 · $296/mo
- Projected year-2 tax
- $3,554 · $296/mo
- Expected delta
- $0/yr ($0/mo · -0.0%)
ⓘ Screening estimate from a state-policy table — verify with the county assessor before closing.
Climate risk First Street
- Flood 3/10 Moderate FEMA zone X (unshaded) · 20% chance over 30 yrs
- Wildfire 1/10 Low
- Heat 9/10 Extreme 7 d/yr ≥111°F today · 24 d/yr by 30 yrs out
- Wind 9/10 Extreme 99% chance of damaging wind over 30 yrs
- Air quality 3/10 Moderate 2 unhealthy d/yr today · 3 by 30 yrs out
Nearby sold comps map
Loading sold comps map…
Walkable amenities ~0.75 mi
Loading nearby amenities…
Taxation est. · year 1
- Rental income
- $19,100
- − Mortgage interest
- −$8,962
- − Property taxes
- −$3,554
- − Insurance
- −$800
- − Repairs & maintenance
- −$1,528
- − Management
- −$1,528
- − Depreciation
- −$4,655
- Taxable loss
- −$1,927
- Est. tax savings @ 24.0%
- +$462
- After-tax cash flow
- $1,129/yr
For passive investors: Depreciation is non-cash, so a rental often shows a tax loss while cash-flowing — sheltering income. Rental losses are passive: they offset passive income freely, and up to $25,000/yr can offset ordinary (W-2) income if you actively participate and your MAGI is under $100k (phasing out to $0 by $150k); unused losses carry forward. On sale, claimed depreciation is recaptured at up to 25%, and gains may owe capital-gains tax (a 1031 exchange can defer both). Figures are a year-1 estimate at your 24.0% rate — not tax advice; consult a CPA.
Condition & rehab AI · 12 photos
This home requires moderate repairs and maintenance to improve its condition and value. It has a good layout and potential for rental income.
Repairs flagged
- Minor kitchen cabinets — slight wear on cabinet hardware
- Minor bathroom vanity — slight wear on vanity hardware
- Minor exterior siding — slight wear on blue siding
- Minor landscaping — bare patches in lawn
Value-add opportunities
- Both paint interior walls — Fresh paint can significantly improve the home's curb appeal and interior aesthetics.
- Both replace ceiling fans — Modern ceiling fans can enhance the home's functionality and aesthetic appeal.
- Both repair/replace kitchen cabinets — New cabinets can improve the kitchen's functionality and aesthetic appeal.
- Both repair/replace bathroom vanity — A new vanity can improve the bathroom's functionality and aesthetic appeal.
- Both repair/replace exterior siding — New siding can improve the home's curb appeal and increase its value.
- Both landscaping — Landscaping can improve the home's curb appeal and increase its value.
Renovation cost estimate screening
| Repair item | Severity | Est. cost |
|---|---|---|
| kitchen cabinets · slight wear on cabinet hardware | Minor | $500–3,000 |
| bathroom vanity · slight wear on vanity hardware | Minor | $500–3,000 |
| exterior siding · slight wear on blue siding | Minor | $500–3,000 |
| landscaping · bare patches in lawn | Minor | $500–3,000 |
| Total estimated repair cost · 4 items | $2,000–12,000 |
Value-add ROI direction
- Both paint interior walls — Fresh paint can significantly improve the home's curb appeal and interior aesthetics. ↑
- Both replace ceiling fans — Modern ceiling fans can enhance the home's functionality and aesthetic appeal. ↑
- Both repair/replace kitchen cabinets — New cabinets can improve the kitchen's functionality and aesthetic appeal. ↑
- Both repair/replace bathroom vanity — A new vanity can improve the bathroom's functionality and aesthetic appeal. ↑
- Both repair/replace exterior siding — New siding can improve the home's curb appeal and increase its value. ↑
- Both landscaping — Landscaping can improve the home's curb appeal and increase its value. ↑
ⓘ Cost ranges are severity-bucket heuristics (US national rule-of-thumb). Get contractor quotes + a written scope before underwriting a rehab budget.
Schools (NCES district)
- District
- Houston ISD
- NCES district ID
- 4823640
- Math proficiency
- 27% ▼ -18.00%
- Reading proficiency
- 35% ▼ -6.00%
- Median HH income
- $46,054
- Composite
- 26.63/100
- National rank
- #7173
- State rank
- #593 of 826 in TX
Livability — Houston
- Score
- 74/100
- State rank
- #184
- US rank
- #4771
Category grades
Schools grade is shown separately in the Schools card above.
Census & demographics
- Census place
- Houston, TX
- County
- Harris County · 4,702,590 people
- City population
- 3,226,434
- Metro
- Houston-The Woodlands-Sugar Land, TX
- Population (ZIP)
- 19,109
- Household income
- $38,357
- Rent vs Own
- Severe rent burden
- 1177.0
Population outlook (Harris County) Hauer SSP2
- Today (2025)
- 5,571,493 people
- By 2030
- 6,089,821 · +9.3%
- By 2040
- 7,142,806 · +28.2%
- By 2050
- 8,185,864 · +46.9%
- By 2075
- 10,574,329 · +89.8%
- By 2100
- 12,109,958 · +117.4%
Race, ethnicity, and origin ACS 2023
- Neighborhood character
- Majority Black (57%)
- Race & ethnicity
- Black 57% Hispanic / Latino 41% Two or more races 15% White 2%
- Hispanic origin (detail)
- Mexican 36%
- Foreign-born
- 13% · Canada
- Languages at home
- 61% English-only · Spanish 38%
Political lean MEDSL · Harris
- 2024 margin
- Lean D (+5.5) · D 52.0% · R 46.4% · Other 1.6%
- 2008→2024 swing
- +3.9pp toward D · 2008: 1.6pp · 2024: 5.5pp
- All cycles
- 2024: D+5.5 2020: D+13.3 2016: D+12.4 2012: D+0.1 2008: D+1.6
Not yet ingested
- Civics
- —
Market trends
- HPI YoY
- ▲ 5.25%
- Current HPI
- 267.7798
- Rent YoY
- ▼ -1.55%
- Metro
- Houston-The Woodlands-Sugar Land, TX
- State GDP YoY
- ▲ 3.95%
- F500 in state
- 110
Industry mix (Fortune 500 HQ in TX)
| Industry | F500 HQs | Revenue |
|---|---|---|
| Energy | 16 | $1,198B |
|
||
| Technology | 5 | $198B |
|
||
| Engineering / Construction | 4 | $72B |
|
||
| Energy Services | 3 | $60B |
|
||
| Utilities | 3 | $41B |
|
||
| Healthcare | 2 | $330B |
|
||
Price history
-8.9% since first listed4 events — show timeline
- 2026-05-07 Price Changed $175,000 HARMLS
- 2026-02-24 Price Changed $180,000 HARMLS
- 2026-01-30 Price Changed $189,000 HARMLS
- 2025-12-20 Listed $192,000 HARMLS
Cash-flow waterfall
monthlySold comps — $/sqft
last 12 mo · ≤1 miLoading sold comps…