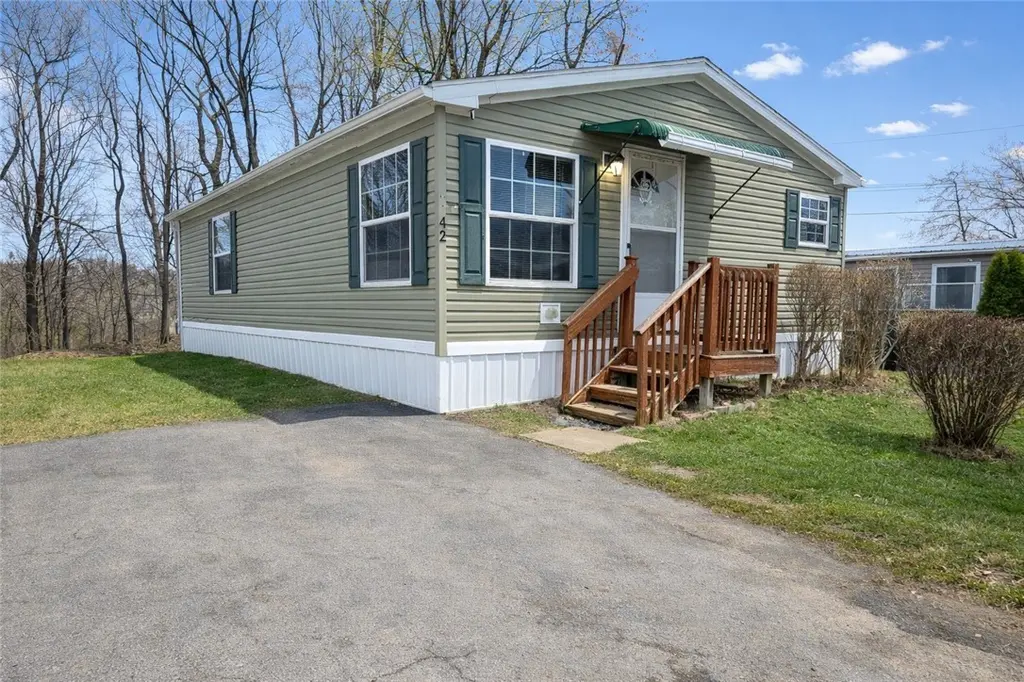
42 Sebastian Dr · Brighton, NY
Flood risk 1/10 · Minimal
- FEMA flood zone
- X (unshaded)
- Chance of flooding over 30 yrs
- 0.0%
- Est. flood insurance / yr
- $507 – $1,088
Fire risk 3/10 · Minor
- Est. fire insurance / yr
- $691 – $1,283
Heat risk 2/10 · Minimal
- Hot days now (above 95°F)
- 7 days/yr
- Hot days in 30 yrs
- 16 days/yr
Wind risk 1/10 · Minimal
- Chance of severe wind over 30 yrs
- —
Air-quality risk 2/10 · Minimal
- Unhealthy air days now
- 1 days/yr
- Unhealthy air days in 30 yrs
- 2 days/yr
Risk factors via First Street. Map © Google.
Why this score? — see what drove the C- grade
The composite is a weighted blend of 9 inputs, each scored 0–100. Each bar is that input's sub-score; the figure is the points it added to the 100-point composite (weight × sub-score).
- Cash flow +15.0/30.0
- ARV discount +11.8/15.0
- Schools +7.5/10.0
- 1% rule +5.0/10.0
- DSCR +5.0/10.0
- Livability +4.0/5.0
- Rent growth +2.5/5.0
- Condition / age +2.2/5.0
- Appreciation +0.0/10.0
$64,900
🖨 Deal sheet 📄 Offer letter ✓ Due diligence
Listing remarks
Welcome to this well-cared-for, one-owner home offering comfortable living in a peaceful, nature-filled setting. This 2-bedroom, 2 full bathroom home features a bright, open layout with a spacious main living area that flows nicely into the kitchen—ideal for everyday living or entertaining. The kitchen provides ample cabinetry and workspace, while the primary bedroom includes its own private full bath. A second bedroom and additional full bathroom offer flexibility for guests, a home office, or additional living space. This home does need some TLC, presenting a great opportunity to make it your own and add value over time. Enjoy a unique setting as the lot backs up to a scenic gorge o
Key facts
- Bright open layout
- Tranquil stream
- Ample cabinetry
Tags
Neighborhood map
What this means for you Summary
Snapshot
- This is a 2-bed/2.0-bath manufactured listed at $65k. Condition is rated fair.
Deal economics
- At list price, monthly cash flow is $2k ($22k/yr) — positive.
- The deal already cash-flows at list — no discount required.
- Meets the 1% rule at list price ($3k rent vs $65k).
- Cap rate 39.7% vs local median 3.9% in Brighton — top-decile yield for the area; either an underpriced asset or a hidden risk that comps aren't pricing in. Stress-test before assuming the spread holds.
Location & tenants
- Location reads 81/100 on livability (#89 in NY, #1,379 nationally) — a professional / high-income tenant draw. Strengths: housing A+, health & safety A+, schools B+; Watch: crime D+, amenities D-.
- Pittsford Central School District (suburban): math 80% / reading 84% proficiency, ranked #34 of 590 in NY (top 6%) — strong family-tenant draw, lease renewals of 3-5y typical; only 2% free/reduced lunch — higher-income household profile.
- Market conditions: 63 active listings in the ZIP; 4 comparable units currently listed for rent nearby; rentals leasing fast (median 3d on market — plan ~1-2 weeks tenant-placement turnaround); 1,169 units permitted in Monroe County in 2024 (591 in 5+ unit buildings).
Forward outlook
- Local home prices are declining (-3.0%/yr); year-one equity from $449 of loan paydown is wiped out by about $2k of value loss. Plan a longer hold.
- Monroe County population projected to shrink 6% by 2050 — rents likely to lag national; underwrite the cash flow, not the appreciation.
- At projected returns (-3.0% appreciation + 3.0% rent growth), your $18k cash investment doubles in ~1 year — after that, you're playing with house money.
Negotiation context
- Only 7 days on market — expect competitive offers; lowballing is unlikely to land.
Questions for the listing agent
- Have any recent inspections been done? Can we get a copy of the seller's disclosures and any deferred-maintenance estimates?
- Is there a deadline driving the sale (1031 exchange, divorce, estate, relocation)? That informs how much negotiation room exists.
- Schools are B-rated — typically a magnet for longer-tenancy family renters. What's the average tenant stay here, and is there a school-zone premium baked into asking?
- Crime grade is D in this area — have there been break-ins, vandalism, or insurance claims at this property in the last 3 years? What carrier currently insures it and at what premium?
- What's the average days-on-market for RENTAL listings here right now (not sales)? A rising rental-DOM trend means longer vacancies and softer asking-rent achievability than the comps imply.
- What's the recent tenant-quality profile in this submarket — average credit score on applications, eviction rate, late-payment / NSF rate, and stable-employment percentage? A property-management company in the area should have these aggregated.
- How much new for-sale + rental construction is in the pipeline within 1–3 miles? Heavy new supply typically softens prices + rents 12–24 months out; constrained supply supports both.
Investment metrics
- 1% rule
- 4.40% ✓
- Cap rate
- 39.73%
- Cash-on-cash
- 119.42%
- DSCR
- 6.31
- GRM
- 1.9
CMA / ARV
- ARV (on-the-fly)
- $71,808
- Comps found
- 12
Show comp detail 12 sales within ~0.75 mi
| Address | Dist | Beds/Ba | Sqft | Sold | Price | $/sf | Match |
|---|---|---|---|---|---|---|---|
| 9 Oakside Dr | 0.32mi | 3/2.0 (+1) | 1,056 (0%) | 2mo | $72,000 | $68 | 79 |
| 2 Easy St | 0.19mi | 2/1.0 | 980 (-7%) | 3mo | $40,000 | $41 | 73 |
| 26 Ewald Dr | 0.15mi | 2/1.0 | 960 (-9%) | 3mo | $113,777 | $119 | 71 |
| 36 Wayside Dr | 0.11mi | 2/1.5 | 924 (-12%) | 2mo | $54,900 | $59 | 70 |
| 2 Beatrice | 0.17mi | 3/2.0 (+1) | 1,143 (+8%) | 9mo | $90,000 | $79 | 66 |
| 11 Bittersweet Dr | 0.16mi | 3/2.0 (+1) | 1,150 (+9%) | 11mo | $77,000 | $67 | 64 |
| 27 Ewald Dr | 0.13mi | 2/2.0 | 907 (-14%) | 8mo | $90,000 | $99 | 64 |
| 27 Glazer Dr | 0.47mi | 2/2.0 | 1,100 (+4%) | 9mo | $65,000 | $59 | 64 |
| 25 Ewald Dr | 0.14mi | 2/2.0 | 907 (-14%) | 9mo | $88,000 | $97 | 63 |
| 25 Patio Dr | 0.33mi | 3/2.0 (+1) | 960 (-9%) | 6mo | $72,500 | $76 | 60 |
| 8 Harway Dr | 0.31mi | 3/2.0 (+1) | 1,173 (+11%) | 7mo | $73,500 | $63 | 56 |
| 26 Fondiller Ave | 0.41mi | 3/2.0 (+1) | 1,200 (+14%) | 5mo | $71,000 | $59 | 49 |
Match score weights: distance 35% · size 25% · config 20% · recency 20%. Top-matched comps best support the ARV.
Projected returns pro-forma
-3.0% appreciation · 3.0% rent growth · sell at horizon
- IRR
- —
- Equity multiple
- 6.76×
- Total profit
- $104,710
- Equity at exit
- $9,677
- IRR
- —
- Equity multiple
- 14.19×
- Total profit
- $239,671
- Equity at exit
- $5,611
Cash invested: $18,172 (down + closing). Projections, not guarantees.
Landlord ↔ Tenant lean methodology
- Overall (STATE)
- 15 Strongly Tenant-Friendly
- State New York
- 15 Strongly Tenant-Friendly · D+10
- County
- — inherits STATE
- City
- — inherits STATE
ZIP-level market 14625
- Home prices YoY
- -15.3%
- Active inventory
- 63
- Price-to-rent
- 1.9×
Monthly cashflow live
- Estimated rent
- $2,857 medium interval (Pro) →
- Mortgage (P&I)
- −$340
- Tax est. 1.5%
- −$81 /mo · $974/yr
- Insurance
- −$27
- HOA
- −$0
- Vacancy / Maint / Mgmt
- −$600
- Net cashflow
- $1,808
Break-even live
UW: 25.0% down · 7.5% · 30yr · 1.5% tax · 5.0% vac · 8.0% maint · 8.0% mgmt
Financing live
Cash to close
- Down payment
- $16,225
- Closing costs
- $1,947
- Reserves months
- —
- Total cash needed
- —
Loan-product check · same deal, 3 products live
Conventional
25% down · 7.5% · 30yr
- Down + closing
- —
- Monthly P&I
- —
- Monthly cashflow
- —
- DSCR
- —
- Eligible?
- —
Personal DTI + credit; lowest rate.
DSCR
20% down · 8.5% · 30yr
- Down + closing
- —
- Monthly P&I
- —
- Monthly cashflow
- —
- DSCR
- —
- Eligible?
- —
No personal income docs; deal must DSCR.
Hard money
10% down · 12.0% · 12mo
- Down + closing
- —
- Monthly P&I
- —
- Monthly cashflow
- —
- DSCR
- —
- Eligible?
- —
Short-term bridge; refi at stabilization.
Rent comps 4 comps
| Address | Beds | Baths | Sqft | Rent | $/sqft | DOM | Units | Dist |
|---|---|---|---|---|---|---|---|---|
| 3540 East Ave Rochester, NY | 1.0–2.0 | 1.0–2.5 | 1261 | $4,123 | $3.27 | 2d | 10 | 0.59mi |
| 278 Penn Ln Rochester, NY | 2.0 | 2.0 | 1184 | $2,100 | $1.77 | 2d | 1 | 1.02mi |
| 18 Brook Hill Ln Rochester, NY | 1.0–2.0 | 1.0–1.5 | 841 | $1,915 | $2.28 | 2d | 1 | 1.04mi |
| 2500 East Ave Rochester, NY | 3.0 | 1.0–3.0 | 1171 | $2,187 | $1.87 | 2d | 17 | 1.47mi |
Listing history 2 events
-
2026-03-30status Pending
-
2026-03-23$64,900 Active
ⓘ Source: listings_history table (triggers on properties + properties_extension) + one-shot
backfill from property_details.listing_events for pre-trigger history.
Climate risk First Street
- Flood 1/10 Low FEMA zone X (unshaded) · 0% chance over 30 yrs
- Wildfire 3/10 Moderate
- Heat 2/10 Low 7 d/yr ≥95°F today · 16 d/yr by 30 yrs out
- Wind 1/10 Low
- Air quality 2/10 Low 1 unhealthy d/yr today · 2 by 30 yrs out
Nearby sold comps map
Loading sold comps map…
Walkable amenities ~0.75 mi
Loading nearby amenities…
Taxation est. · year 1
- Rental income
- $34,283
- − Mortgage interest
- −$3,635
- − Property taxes
- −$974
- − Insurance
- −$324
- − Repairs & maintenance
- −$2,743
- − Management
- −$2,743
- − Depreciation
- −$1,888
- Taxable income
- $21,977
- Est. tax owed @ 24.0%
- −$5,274
- After-tax cash flow
- $16,427/yr
For passive investors: Depreciation is non-cash, so a rental often shows a tax loss while cash-flowing — sheltering income. Rental losses are passive: they offset passive income freely, and up to $25,000/yr can offset ordinary (W-2) income if you actively participate and your MAGI is under $100k (phasing out to $0 by $150k); unused losses carry forward. On sale, claimed depreciation is recaptured at up to 25%, and gains may owe capital-gains tax (a 1031 exchange can defer both). Figures are a year-1 estimate at your 24.0% rate — not tax advice; consult a CPA.
Condition & rehab AI · 13 photos
This manufactured home presents a moderate rehab opportunity with average condition. It requires some cosmetic updates to kitchen and bathrooms, exterior paint, and landscaping to improve its resale and rental value.
Repairs flagged
- Minor Kitchen cabinets — Worn appearance suggests some touch-up or replacement may be needed
- Minor Bathroom fixtures — Dated appearance suggests cleaning or replacement may be needed
- Minor Exterior paint — Paint appears faded, a fresh coat could improve curb appeal
- Minor Landscaping — Sparse and could benefit from some maintenance and landscaping improvements
Value-add opportunities
- Resale Paint exterior siding — Fresh paint can significantly improve curb appeal and home value
- Resale Replace worn kitchen cabinets — New cabinets can enhance the kitchen's functionality and aesthetic appeal
- Resale Replace dated bathroom fixtures — New fixtures can improve the bathroom's functionality and aesthetic appeal
- Both Landscaping improvements — Improved landscaping can enhance curb appeal and increase property value
Renovation cost estimate screening
| Repair item | Severity | Est. cost |
|---|---|---|
| Kitchen cabinets · Worn appearance suggests some touch-up or replacement may be needed | Minor | $500–3,000 |
| Bathroom fixtures · Dated appearance suggests cleaning or replacement may be needed | Minor | $500–3,000 |
| Exterior paint · Paint appears faded, a fresh coat could improve curb appeal | Minor | $500–3,000 |
| Landscaping · Sparse and could benefit from some maintenance and landscaping improvements | Minor | $500–3,000 |
| Total estimated repair cost · 4 items | $2,000–12,000 |
Value-add ROI direction
- Resale Paint exterior siding — Fresh paint can significantly improve curb appeal and home value ↑
- Resale Replace worn kitchen cabinets — New cabinets can enhance the kitchen's functionality and aesthetic appeal ↑
- Resale Replace dated bathroom fixtures — New fixtures can improve the bathroom's functionality and aesthetic appeal ↑
- Both Landscaping improvements — Improved landscaping can enhance curb appeal and increase property value ↑
ⓘ Cost ranges are severity-bucket heuristics (US national rule-of-thumb). Get contractor quotes + a written scope before underwriting a rehab budget.
Schools (NCES district)
- District
- Pittsford Central School District
- NCES district ID
- 3623160
- Math proficiency
- 80% ▼ -4.00%
- Reading proficiency
- 84% ▲ 7.00%
- Median HH income
- $106,940
- Composite
- 74.75/100
- National rank
- #151
- State rank
- #34 of 590 in NY
Livability — Brighton
- Score
- 81/100
- State rank
- #89
- US rank
- #1379
Category grades
Schools grade is shown separately in the Schools card above.
Census & demographics
- City population
- 38,703
- Population (ZIP)
- 10,667
Population outlook (Monroe County) Hauer SSP2
- Today (2025)
- 759,460 people
- By 2030
- 757,154 · -0.3%
- By 2040
- 740,644 · -2.5%
- By 2050
- 714,443 · -5.9%
- By 2075
- 645,883 · -15.0%
- By 2100
- 547,084 · -28.0%
Race, ethnicity, and origin ACS 2023
- Neighborhood character
- Predominantly White (85%)
- Race & ethnicity
- White 85% Two or more races 10% Hispanic / Latino 6% Black 1% Asian 1%
- Hispanic origin (detail)
- Puerto Rican 1% Dominican 1%
- Common ancestry
- Romanian 7% Subsaharan African 3% Iranian 2%
- Foreign-born
- 7% · Canada, China
- Languages at home
- 92% English-only · Russian/Polish/Slavic 3% Spanish 2% Other Indo-European 2%
Political lean MEDSL · Monroe
- 2024 margin
- D (+19.1) · D 59.5% · R 40.5%
- 2008→2024 swing
- +1.4pp toward D · 2008: 17.7pp · 2024: 19.1pp
- All cycles
- 2024: D+19.1 2020: D+21.0 2016: D+14.1 2012: D+17.4 2008: D+17.7
Not yet ingested
- Civics
- —
Market trends
- HPI YoY
- ▼ -49.69%
- Current HPI
- 275.9721
- Rent YoY
- —
- Metro
- —
- State GDP YoY
- ▲ 2.60%
- F500 in state
- 92
Industry mix (Fortune 500 HQ in NY)
| Industry | F500 HQs | Revenue |
|---|---|---|
| Financial Services | 10 | $950B |
|
||
| Consumer Goods | 9 | $162B |
|
||
| Insurance | 4 | $225B |
|
||
| Telecommunications | 2 | $144B |
|
||
| Pharmaceuticals | 2 | $112B |
|
||
| Media / Entertainment | 2 | $69B |
|
||
Price history
2 events — show timeline
- 2026-03-30 Pending — UNYREIS
- 2026-03-23 Listed $64,900 UNYREIS
Cash-flow waterfall
monthlySold comps — $/sqft
last 12 mo · ≤1 miLoading sold comps…