 Duplex
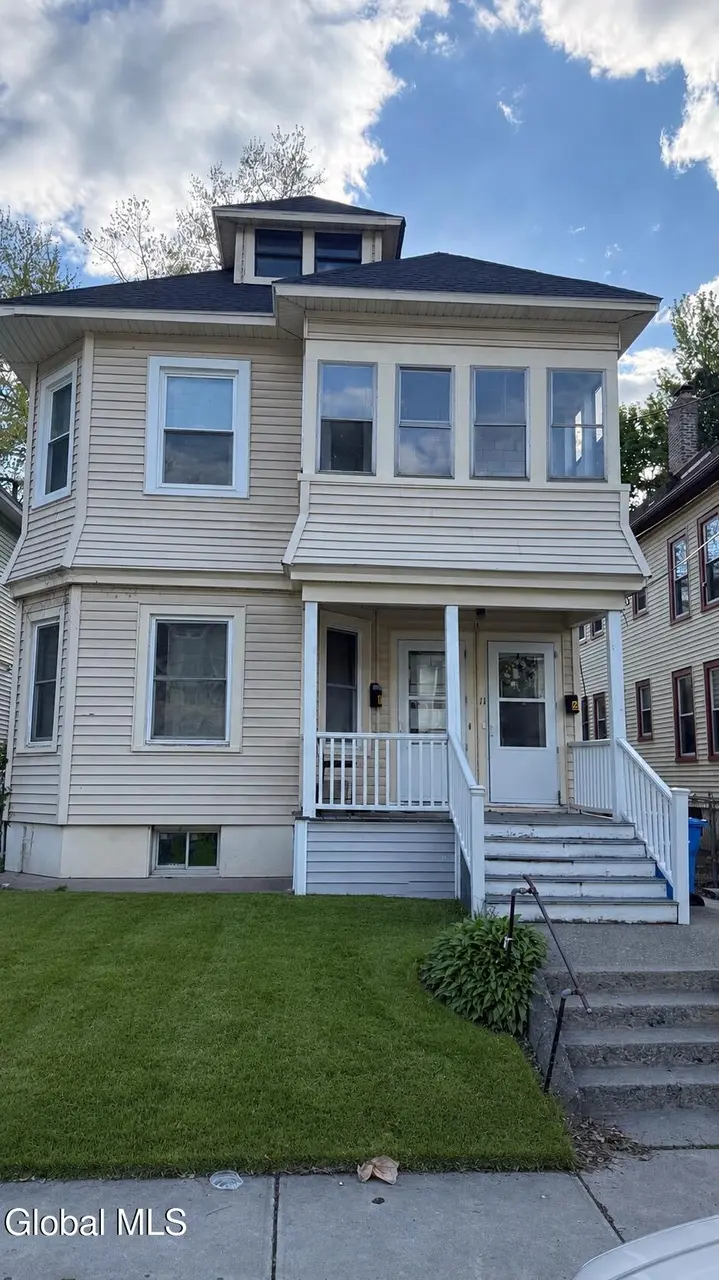
11 S Dove St · Albany, NY
Flood risk 1/10 · Minimal
- FEMA flood zone
- X (unshaded)
- Chance of flooding over 30 yrs
- 0.0%
- Est. flood insurance / yr
- $473 – $860
Fire risk 2/10 · Minimal
- Est. fire insurance / yr
- $691 – $1,283
Heat risk 4/10 · Minor
- Hot days now (above 99°F)
- 7 days/yr
- Hot days in 30 yrs
- 16 days/yr
Wind risk 3/10 · Minor
- Chance of severe wind over 30 yrs
- 6.0%
Air-quality risk 1/10 · Minimal
- Unhealthy air days now
- 0 days/yr
- Unhealthy air days in 30 yrs
- 0 days/yr
Risk factors via First Street. Map © Google.
Why this score? — see what drove the B- grade
The composite is a weighted blend of 9 inputs, each scored 0–100. Each bar is that input's sub-score; the figure is the points it added to the 100-point composite (weight × sub-score).
- Cash flow +22.5/30.0
- Appreciation +10.0/10.0
- ARV discount +9.6/15.0
- DSCR +7.2/10.0
- 1% rule +6.1/10.0
- Rent growth +4.7/5.0
- Livability +4.0/5.0
- Schools +3.2/10.0
- Condition / age +2.5/5.0
$349,900
🖨 Deal sheet (PDF) 📄 Offer letter ✓ Due diligence
Multi-family units
County records classify this as Multi-Family (2-4 Unit). Listing-text estimate: 2 units. confirmed
Listing remarks MLS
Nicely maintained 2 Family located on a quiet side street. The owner has taken good care of this property. Replacement windows. Fenced rear yard. Active ROP'S for both units.
Key facts
- Fenced backyard
- New roof
- Replacement windows
Tags
Property features AI
Finance
- Other: Approximately 0.08 acre lot
- Financial info: Two-unit property (duplex)
Exterior
- Utilities: Public water; Public sewer
- Home design: Duplex; New roof (2023)
- Construction: Vinyl siding
- Exterior features: Fenced backyard
Interior
- Bedrooms: Unit 1: 3 bedrooms; Unit 2: 4 bedrooms
- Bathrooms: 2 full bathrooms total; One full bath on the 1st floor; One full bath on the 2nd floor; Unit 1: 1 full bath; Unit 2: 1 full bath
- Heating & cooling: Hot water heating; Natural gas heating
- Interior features: Full basement
Neighborhood map
What this means for you Summary
Snapshot
- This is a 2 × 4-bed/1.0-bath units multifamily listed at $350k.
Deal economics
- At list price, monthly cash flow is $590 ($7k/yr) — positive. Per door: $295/mo.
- The deal already cash-flows at list — no discount required.
- Meets the 1% rule at list price ($4k rent vs $350k).
- Recommended offer: $339k (3.0% below list) — sets the bar for market timing.
Location & tenants
- Location reads 79/100 on livability (#129 in NY, #2,083 nationally) — a middle-class / working-renter tenant base. Strengths: amenities A+, commute A+, housing A+; Watch: employment C-, crime F.
- Albany City School District (urban): math 37% / reading 40% proficiency, ranked #543 of 590 in NY (top 92%) — families likely to look elsewhere, expect single-tenant / working-renter base with shorter leases; 66% free/reduced lunch — lower-income household profile, screen leases tightly.
- Zoned schools: Albany High School (math 74% / reading 67%, grade B+, #710 of 1,100 statewide, top 65%, 2,676 students, 69% FRL) — zoned schools at 69% FRL track the district average.
- Zoned-school proficiency averages 70% at this address vs 38% district-wide (+32 pts) — the actual schools serving this property are materially stronger than the Albany City School District average implies; a family-tenant draw the district grade alone would hide.
- Market conditions: Rents rising fast (+8.7%/yr); 58 active listings in the ZIP; 675 units permitted in Albany County in 2024 (451 in 5+ unit buildings).
Forward outlook
- In year one you build about $37k of equity ($2k loan paydown + $35k appreciation (10.0% local appreciation)).
- Albany County population projected at +9% by 2050 — modest demand growth; plan on rents tracking national, not racing it.
- At projected returns (10.0% appreciation + 8.0% rent growth), your $98k cash investment doubles in ~3 years — after that, you're playing with house money.
- By year 2, paydown + projected appreciation supports a ~$60k cash-out refi (75% LTV) — recoverable capital for the next deal without selling this one.
Negotiation context
- It's been on market 40 days — a 3% lower offer ($339k) is reasonable based on typical stale-listing flexibility.
- 2 sale attempts since 3y ago; this cycle's ask has dropped $35k (9%) from the opening price — seller is motivated, your offer sets the floor, not the list.
- Current owner paid $223k; list at $350k implies a 57% gain — meaningful room to come down on a strong offer.
Risks & watch-outs
- Watch-outs: built in 1922 — expect roof / HVAC / electrical / plumbing capex.
Questions for the listing agent
- It's been on market 40 days. Have you received any prior offers? Is the seller open to a 3% concession, seller financing, or rate buy-down credit?
- Can we see the unit-by-unit rent roll, current vacancy, and any below-market leases? What's the average tenancy length?
- What capital expenditures (roof, boiler, parking lot, exteriors) have been made in the last 5 years, and what's planned in the next 2?
- Built in 1922 — when were the roof, HVAC, electrical panel, plumbing, and water heater last replaced?
- Is there a deadline driving the sale (1031 exchange, divorce, estate, relocation)? That informs how much negotiation room exists.
- Crime grade is F in this area — have there been break-ins, vandalism, or insurance claims at this property in the last 3 years? What carrier currently insures it and at what premium?
- What's the average days-on-market for RENTAL listings here right now (not sales)? A rising rental-DOM trend means longer vacancies and softer asking-rent achievability than the comps imply.
- What's the recent tenant-quality profile in this submarket — average credit score on applications, eviction rate, late-payment / NSF rate, and stable-employment percentage? A property-management company in the area should have these aggregated.
- How much new apartment / multifamily construction is in the pipeline within 1–3 miles? Heavy new supply (>2% of stock underway) typically softens rents 12–24 months out; light construction supports rent growth.
Investment metrics
- 1% rule
- 1.11% ✓
- Cap rate
- 8.32%
- Cash-on-cash
- 7.23%
- DSCR
- 1.32
- GRM
- 7.5
CMA / ARV
- ARV (median comp)
- $366,906
- List price
- $349,900
- Delta
- -4.64%
- Verdict
- FAIR
- Comps
- 20 within 1.0 mi
Show comp detail 12 sales within ~0.75 mi
| Address | Dist | Beds/Ba | Sqft | Sold | Price | $/sf | Match |
|---|---|---|---|---|---|---|---|
| 14 Bogart Ter | 0.13mi | 6/2.0 | 2,232 (-9%) | 2mo | $250,000 | $112 | 78 |
| 278 Morton Ave | 0.34mi | 6/2.5 | 2,460 (+0%) | 5mo | $195,000 | $79 | 78 |
| 41 Barrows St | 0.60mi | 6/2.0 | 2,472 (+1%) | 2mo | $290,000 | $117 | 69 |
| 23 Sloan St | 0.35mi | 6/3.0 | 2,310 (-6%) | 1mo | $170,000 | $74 | 69 |
| 10 Putnam St | 0.16mi | 6/2.0 | 2,764 (+13%) | 4mo | $375,000 | $136 | 68 |
| 79 Alexander St | 0.46mi | 6/4.0 | 2,600 (+6%) | 0mo | $215,000 | $83 | 60 |
| 50 Southern Blvd | 0.73mi | 6/2.0 | 2,380 (-3%) | 2mo | $347,000 | $146 | 59 |
| 105 Southern Blvd | 0.64mi | 5/4.0 (-1) | 2,446 (-0%) | 1mo | $405,000 | $166 | 56 |
| 252 Morton Ave | 0.33mi | 6/4.0 | 2,152 (-12%) | 3mo | $285,000 | $132 | 54 |
| 58 Southern Blvd | 0.73mi | 6/2.0 | 2,264 (-8%) | 4mo | $350,000 | $155 | 50 |
| 64 Clinton St | 0.61mi | 5/3.0 (-1) | 2,640 (+8%) | 6mo | $140,000 | $53 | 45 |
| 24 Delaware St | 0.54mi | 5/2.5 (-1) | 2,112 (-14%) | 2mo | $240,000 | $114 | 43 |
Match score weights: distance 35% · size 25% · config 20% · recency 20%. Top-matched comps best support the ARV.
Projected returns pro-forma
10.0% appreciation · 8.0% rent growth · sell at horizon
- IRR
- 31.7%
- Equity multiple
- 3.54×
- Total profit
- $248,771
- Equity at exit
- $315,218
- IRR
- 29.1%
- Equity multiple
- 8.70×
- Total profit
- $754,036
- Equity at exit
- $679,779
Cash invested: $97,972 (down + closing). Projections, not guarantees.
Landlord ↔ Tenant lean methodology
- Overall (STATE)
- 15 Strongly Tenant-Friendly
- State New York
- 15 Strongly Tenant-Friendly · D+10
- County
- — inherits STATE
- City
- — inherits STATE
ZIP-level market 12202
- Home prices YoY
- 14.3%
- Rents YoY
- 8.7%
- Active inventory
- 58
- Price-to-rent
- 15.0×
Monthly cashflow live
- Estimated rent
- $3,882 high interval (Pro) →
- Mortgage (P&I)
- −$1,835
- Tax from tax record
- −$496 /mo · $5,949/yr
- Insurance
- −$146
- HOA
- −$0
- Vacancy / Maint / Mgmt
- −$815
- Net cashflow
- $590
Break-even live
Sensitivity live
| Price | -10% $788 | -5% $689 | +0% $590 | +5% $491 | +10% $392 |
|---|---|---|---|---|---|
| Rent | -10% $284 | -5% $437 | +0% $590 | +5% $744 | +10% $897 |
| Rate | -1.0pp $767 | -0.5pp $679 | base $590 | +0.5pp $500 | +1.0pp $407 |
2-unit breakdown (identical units grouped — click to expand)
| Units | Beds | Baths | Est. rent |
|---|---|---|---|
| 2× units | 4 | 1 | $3,882 |
| #1 | 4 | 1 | $1,941 |
| #2 | 4 | 1 | $1,941 |
| Total (2 units) | $3,882 | ||
UW: 25.0% down · 7.5% · 30yr · 1.5% tax · 5.0% vac · 8.0% maint · 8.0% mgmt
Financing live
Cash to close
- Down payment
- $87,475
- Closing costs
- $10,497
- Reserves months
- —
- Total cash needed
- —
Loan-product check · same deal, 3 products live
Conventional
25% down · 7.5% · 30yr
- Down + closing
- —
- Monthly P&I
- —
- Monthly cashflow
- —
- DSCR
- —
- Eligible?
- —
Personal DTI + credit; lowest rate.
DSCR
20% down · 8.5% · 30yr
- Down + closing
- —
- Monthly P&I
- —
- Monthly cashflow
- —
- DSCR
- —
- Eligible?
- —
No personal income docs; deal must DSCR.
Hard money
10% down · 12.0% · 12mo
- Down + closing
- —
- Monthly P&I
- —
- Monthly cashflow
- —
- DSCR
- —
- Eligible?
- —
Short-term bridge; refi at stabilization.
Listing history 21 events
-
2026-06-21days on market $349,900 Active 40 DOM
-
2026-06-18days on market $349,900 Active 37 DOM
-
2026-06-17days on market $349,900 Active 36 DOM
-
2026-06-16days on market $349,900 Active 35 DOM
-
2026-06-15days on market $349,900 Active 34 DOM
-
2026-06-14pricedays on market $349,900 Active 32 DOM
-
2026-06-10days on market $375,000 Active 29 DOM
-
2026-06-08days on market $375,000 Active 27 DOM
-
2026-06-07days on market $375,000 Active 26 DOM
-
2026-06-03days on market $375,000 Active 22 DOM
-
2026-06-02days on market $375,000 Active 21 DOM
-
2026-06-01pricedays on market $375,000 Active 20 DOM
-
2026-05-31remarks 400-char remark
-
2026-05-31days on market $385,000 Active 19 DOM
-
2026-05-31days on market $385,000 Active 18 DOM
-
2026-05-11$385,000 Active 212-char remark
-
2024-01-02soldstatus $223,000
-
2023-12-14soldstatus $223,000 Closed 174-char remark
Show marketing remark (174 chars)
Nicely maintained 2 Family located on a quiet side street. The owner has taken good care of this property. Replacement windows. Fenced rear yard. Active ROP'S for both units.
-
2023-11-02status Pending 174-char remark
Show marketing remark (174 chars)
Nicely maintained 2 Family located on a quiet side street. The owner has taken good care of this property. Replacement windows. Fenced rear yard. Active ROP'S for both units.
-
2023-09-11$239,000 Active 174-char remark
Show marketing remark (174 chars)
Nicely maintained 2 Family located on a quiet side street. The owner has taken good care of this property. Replacement windows. Fenced rear yard. Active ROP'S for both units.
-
1998-08-21soldstatus $57,500
ⓘ Source: listings_history table (triggers on properties + properties_extension) + one-shot
backfill from property_details.listing_events for pre-trigger history.
Tax reassessment forecast NY · Partial reset (capped growth)
- Current annual tax
- $5,949 · $496/mo
- Projected year-2 tax
- $5,949 · $496/mo
- Expected delta
- $0/yr ($0/mo · 0.0%)
ⓘ Screening estimate from a state-policy table — verify with the county assessor before closing.
Climate risk First Street
- Flood 1/10 Low FEMA zone X (unshaded) · 0% chance over 30 yrs
- Wildfire 2/10 Low
- Heat 4/10 Moderate 7 d/yr ≥99°F today · 16 d/yr by 30 yrs out
- Wind 3/10 Moderate 6% chance of damaging wind over 30 yrs
- Air quality 1/10 Low 0 unhealthy d/yr today · 0 by 30 yrs out
Nearby sold comps map
Loading sold comps map…
Walkable amenities ~0.75 mi
Loading nearby amenities…
Taxation est. · year 1
- Rental income
- $46,584
- − Mortgage interest
- −$19,600
- − Property taxes
- −$5,949
- − Insurance
- −$1,750
- − Repairs & maintenance
- −$3,727
- − Management
- −$3,727
- − Depreciation
- −$10,179
- Taxable income
- $1,653
- Est. tax owed @ 24.0%
- −$397
- After-tax cash flow
- $6,687/yr
For passive investors: Depreciation is non-cash, so a rental often shows a tax loss while cash-flowing — sheltering income. Rental losses are passive: they offset passive income freely, and up to $25,000/yr can offset ordinary (W-2) income if you actively participate and your MAGI is under $100k (phasing out to $0 by $150k); unused losses carry forward. On sale, claimed depreciation is recaptured at up to 25%, and gains may owe capital-gains tax (a 1031 exchange can defer both). Figures are a year-1 estimate at your 24.0% rate — not tax advice; consult a CPA.
Schools (NCES district)
- District
- Albany City School District
- NCES district ID
- 3602460
- Math proficiency
- 37% ▲ 6.00%
- Reading proficiency
- 40% ▲ 7.00%
- Median HH income
- $40,568
- Composite
- 32.34/100
- National rank
- #5744
- State rank
- #543 of 590 in NY
Livability — Albany
- Score
- 79/100
- State rank
- #129
- US rank
- #2083
Category grades
Schools grade is shown separately in the Schools card above.
Census & demographics
- Census place
- Albany, NY
- County
- Albany County · 196,626 people
- City population
- 116,921
- Metro
- Albany-Schenectady-Troy, NY
- Population (ZIP)
- 10,166
- Household income
- $52,868
- Rent vs Own
- Severe rent burden
- 935.0
Population outlook (Albany County) Hauer SSP2
- Today (2025)
- 320,794 people
- By 2030
- 327,401 · +2.1%
- By 2040
- 338,218 · +5.4%
- By 2050
- 348,467 · +8.6%
- By 2075
- 381,693 · +19.0%
- By 2100
- 393,809 · +22.8%
Race, ethnicity, and origin ACS 2023
- Neighborhood character
- Highly diverse neighborhood (Simpson 0.73)
- Race & ethnicity
- Black 40% White 28% Hispanic / Latino 15% Two or more races 14% Asian 7%
- Hispanic origin (detail)
- Mexican 3% Puerto Rican 5% Dominican 5%
- Common ancestry
- Iranian 2% Romanian 1% Serbian 1%
- Foreign-born
- 14% · Canada, Philippines, China
- Languages at home
- 80% English-only · Spanish 10% Other Asian/Pacific 4% Arabic 1%
Political lean MEDSL · Albany
- 2024 margin
- Strong D (+25.8) · D 62.9% · R 37.1%
- 2008→2024 swing
- -3.6pp toward R · 2008: 29.4pp · 2024: 25.8pp
- All cycles
- 2024: D+25.8 2020: D+31.4 2016: D+24.3 2012: D+31.0 2008: D+29.4
Not yet ingested
- Civics
- —
Market trends
- HPI YoY
- ▲ 38.05%
- Current HPI
- 303.8939
- Rent YoY
- ▲ 8.70%
- Metro
- Albany-Schenectady-Troy, NY
- State GDP YoY
- ▲ 2.60%
- F500 in state
- 92
Industry mix (Fortune 500 HQ in NY)
| Industry | F500 HQs | Revenue |
|---|---|---|
| Financial Services | 10 | $950B |
|
||
| Consumer Goods | 9 | $162B |
|
||
| Insurance | 4 | $225B |
|
||
| Telecommunications | 2 | $144B |
|
||
| Pharmaceuticals | 2 | $112B |
|
||
| Media / Entertainment | 2 | $69B |
|
||
Price history
+508.5% since first listed8 events — show timeline
- 2026-06-10 Price Changed $349,900 Global MLS
- 2026-06-01 Price Changed $375,000 Global MLS
- 2026-05-11 Listed $385,000 Global MLS
- 2024-01-02 Sold (Public Records) $223,000 Public Records
- 2023-12-14 Sold (MLS) $223,000 Global MLS
- 2023-11-02 Pending — Global MLS
- 2023-09-11 Listed $239,000 Global MLS
- 1998-08-21 Sold (Public Records) $57,500 Public Records
Property tax history
+3.5%/yrLatest (2025): $5,949 · -5.4% YoY. Source: county tax records.
Cash-flow waterfall
monthlySold comps — $/sqft
last 12 mo · ≤1 miLoading sold comps…