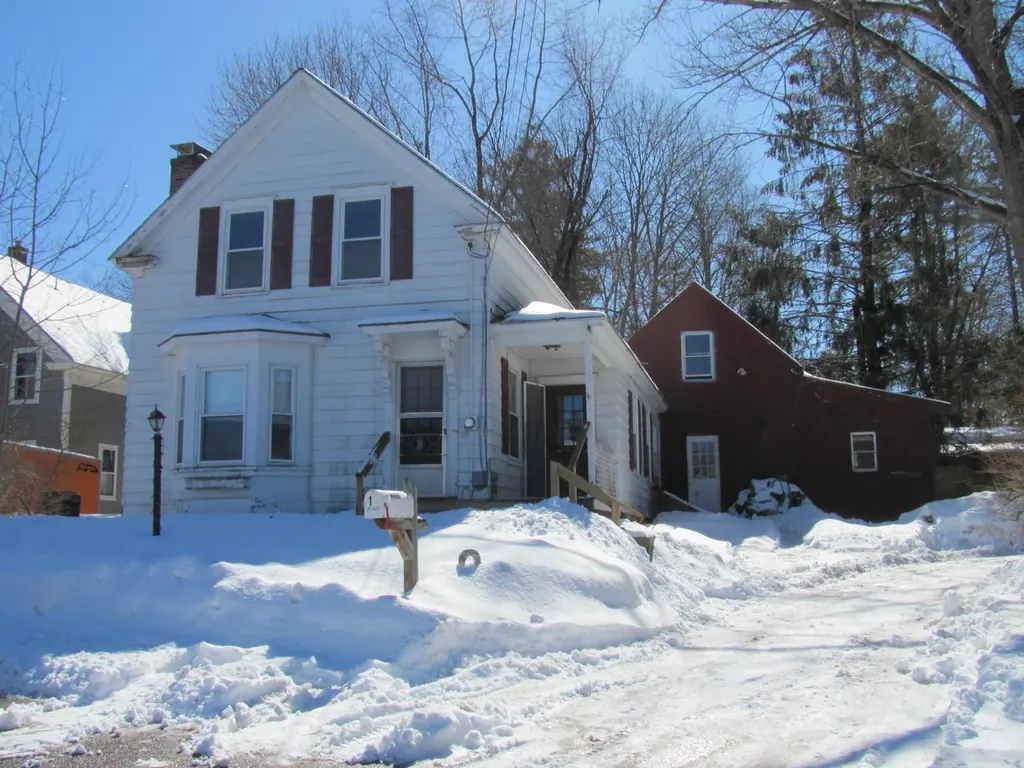
1 Hall St · Kennebunk, ME
Flood risk 1/10 · Minimal
- FEMA flood zone
- X
- Chance of flooding over 30 yrs
- 0.0%
- Est. flood insurance / yr
- $473 – $860
Fire risk 3/10 · Minor
- Est. fire insurance / yr
- $669 – $1,243
Heat risk 4/10 · Minor
- Hot days now (above 88°F)
- 7 days/yr
- Hot days in 30 yrs
- 17 days/yr
Wind risk 6/10 · Moderate
- Chance of severe wind over 30 yrs
- 62.0%
Air-quality risk 2/10 · Minimal
- Unhealthy air days now
- 1 days/yr
- Unhealthy air days in 30 yrs
- 1 days/yr
Risk factors via First Street. Map © Google.
Why this score? — see what drove the D+ grade
The composite is a weighted blend of 9 inputs, each scored 0–100. Each bar is that input's sub-score; the figure is the points it added to the 100-point composite (weight × sub-score).
- ARV discount +15.0/15.0
- Cash flow +8.5/30.0
- Schools +8.0/10.0
- Livability +4.0/5.0
- Rent growth +2.5/5.0
- Condition / age +2.5/5.0
- 1% rule +2.3/10.0
- DSCR +2.3/10.0
- Appreciation +0.0/10.0
$349,000
🖨 Deal sheet (PDF) 📄 Offer letter ✓ Due diligence
Listing remarks MLS
Located in the MRCU zone gives this property multiple options of use. It is a very short distance to downtown Kennebunk, schools and beaches. Both the home and the attached barn are in need of renovations/improvements with the potential of a mixed use.
Key facts
- Attached barn
- 9,583 sq ft lot
- Parking
Tags
Neighborhood map
What this means for you Summary
Snapshot
- This is a 3-bed/1.0-bath single-family listed at $349k.
Deal economics
- At list price, monthly cash flow is $-306 ($-4k/yr) — negative.
- To cash-flow at today's rent, offer at most $295k (15.5% below list).
- To meet the 1% rule (rent ≥ 1% of price), the offer needs to be $255k (26.9% below list).
- Recommended offer: $255k (26.9% below list) — sets the bar for 1% rule.
- Cap rate 5.2% vs local median 3.2% in Kennebunk — top-decile yield for the area; either an underpriced asset or a hidden risk that comps aren't pricing in. Stress-test before assuming the spread holds.
Location & tenants
- Location reads 79/100 on livability (#20 in ME, #2,049 nationally) — a middle-class / working-renter tenant base. Strengths: crime A+, employment A+, housing A+; Watch: cost of living D+, amenities F, commute F.
- RSU 21 (rural): math 91% / reading 94% proficiency, ranked #13 of 112 in ME (top 12%) — strong family-tenant draw, lease renewals of 3-5y typical; only 16% free/reduced lunch — higher-income household profile.
- Zoned schools: Kennebunk Elementary School (358 students, 9% FRL); Middle School of The Kennebunks (math 92% / reading 96%, grade A+, #5 of 85 statewide, top 5%, 479 students, 11% FRL); Kennebunk High School (math 98% / reading 92%, grade A+, #18 of 108 statewide, top 22%, 756 students, 11% FRL).
- Market conditions: 132 active listings in the ZIP; 3 comparable units currently listed for rent nearby; rentals at typical pace (median 16d on market — plan ~3-4 weeks tenant-placement turnaround); 1,386 units permitted in York County in 2024 (338 in 5+ unit buildings).
Forward outlook
- Local home prices are declining (-3.0%/yr); year-one equity from $2k of loan paydown is wiped out by about $10k of value loss. Plan a longer hold.
Negotiation context
- It's been on market 108 days — a 9% lower offer ($318k) is reasonable based on typical stale-listing flexibility.
Risks & watch-outs
- Watch-outs: built in 1890 — expect roof / HVAC / electrical / plumbing capex.
- Climate carrying-cost: major wind risk, 62% chance of damaging wind over 30y — expect insurance premiums to compound above CPI over the hold.
Questions for the listing agent
- What do current leases actually rent for vs. the listed asking? Can we see a recent rent roll and the last 12 months of T-12 income?
- It's been on market 108 days. Have you received any prior offers? Is the seller open to a 27% concession, seller financing, or rate buy-down credit?
- Built in 1890 — when were the roof, HVAC, electrical panel, plumbing, and water heater last replaced?
- Why hasn't it sold? Are there any deal-killer items the seller is aware of (foundation, flood, title, zoning, code violations)?
- Is there a deadline driving the sale (1031 exchange, divorce, estate, relocation)? That informs how much negotiation room exists.
- Schools are A-rated — typically a magnet for longer-tenancy family renters. What's the average tenant stay here, and is there a school-zone premium baked into asking?
- The area grade is low — what's the realistic commute time and amenity access for the typical tenant pool here? Any planned neighborhood developments (good or bad) we should know about?
- What's the average days-on-market for RENTAL listings here right now (not sales)? A rising rental-DOM trend means longer vacancies and softer asking-rent achievability than the comps imply.
- What's the recent tenant-quality profile in this submarket — average credit score on applications, eviction rate, late-payment / NSF rate, and stable-employment percentage? A property-management company in the area should have these aggregated.
- How much new for-sale + rental construction is in the pipeline within 1–3 miles? Heavy new supply typically softens prices + rents 12–24 months out; constrained supply supports both.
Investment metrics
- 1% rule
- 0.73% ✗
- Cap rate
- 5.24%
- Cash-on-cash
- -3.76%
- DSCR
- 0.83
- GRM
- 11.4
CMA / ARV
- ARV (median comp)
- $510,811
- List price
- $349,000
- Delta
- -31.68%
- Verdict
- UNDERPRICED
- Comps
- 20 within 1.0 mi
Show comp detail 10 sales within ~0.75 mi
| Address | Dist | Beds/Ba | Sqft | Sold | Price | $/sf | Match |
|---|---|---|---|---|---|---|---|
| 49 Brown St | 0.17mi | 3/1.5 | 1,422 (-1%) | 10mo | $599,000 | $421 | 80 |
| 40 Hillcrest Dr | 0.18mi | 2/1.5 (-1) | 1,476 (+2%) | 20mo | $460,000 | $312 | 64 |
| 6 Cider Mill Ln | 0.48mi | 3/2.0 | 1,488 (+3%) | 7mo | $725,000 | $487 | 63 |
| 2 Cider Mill Ln | 0.49mi | 3/2.0 | 1,488 (+3%) | 6mo | $649,000 | $436 | 62 |
| 24 York St | 0.25mi | 4/2.0 (+1) | 1,534 (+6%) | 9mo | $499,900 | $326 | 61 |
| 9 Parsons St | 0.61mi | 4/2.0 (+1) | 1,446 (+0%) | 4mo | $510,000 | $353 | 58 |
| 2 Cross St | 0.34mi | 3/2.0 | 1,248 (-14%) | 2mo | $485,000 | $389 | 56 |
| 4 Cider Mill Ln | 0.47mi | 4/2.0 (+1) | 1,648 (+14%) | 3mo | $555,000 | $337 | 43 |
| 3 Clarkdale Rd | 0.69mi | 3/1.0 | 1,229 (-15%) | 2mo | $482,000 | $392 | 42 |
| 122 Brown St | 0.64mi | 3/2.0 | 1,229 (-15%) | 14mo | $500,000 | $407 | 30 |
Match score weights: distance 35% · size 25% · config 20% · recency 20%. Top-matched comps best support the ARV.
Projected returns pro-forma
-3.0% appreciation · 3.0% rent growth · sell at horizon
- IRR
- -22.6%
- Equity multiple
- 0.22×
- Total profit
- $-76,074
- Equity at exit
- $52,037
- IRR
- -16.9%
- Equity multiple
- 0.06×
- Total profit
- $-91,425
- Equity at exit
- $30,175
Cash invested: $97,720 (down + closing). Projections, not guarantees.
Landlord ↔ Tenant lean methodology
- Overall (STATE)
- 41 Moderately Tenant-Leaning
- State Maine
- 41 Moderately Tenant-Leaning · D+2
- County
- — inherits STATE
- City
- — inherits STATE
ZIP-level market 04043
- Home prices YoY
- -21.4%
- Active inventory
- 132
- Price-to-rent
- 11.4×
Monthly cashflow live
- Estimated rent
- $2,552 medium interval (Pro) →
- Mortgage (P&I)
- −$1,830
- Tax from tax record
- −$347 /mo · $4,163/yr
- Insurance
- −$145
- HOA
- −$0
- Vacancy / Maint / Mgmt
- −$536
- Net cashflow
- $-306
Break-even live
Sensitivity live
| Price | -10% $-109 | -5% $-207 | +0% $-306 | +5% $-405 | +10% $-504 |
|---|---|---|---|---|---|
| Rent | -10% $-508 | -5% $-407 | +0% $-306 | +5% $-205 | +10% $-105 |
| Rate | -1.0pp $-130 | -0.5pp $-217 | base $-306 | +0.5pp $-397 | +1.0pp $-489 |
UW: 25.0% down · 7.5% · 30yr · 1.5% tax · 5.0% vac · 8.0% maint · 8.0% mgmt
Financing live
Cash to close
- Down payment
- $87,250
- Closing costs
- $10,470
- Reserves months
- —
- Total cash needed
- —
Loan-product check · same deal, 3 products live
Conventional
25% down · 7.5% · 30yr
- Down + closing
- —
- Monthly P&I
- —
- Monthly cashflow
- —
- DSCR
- —
- Eligible?
- —
Personal DTI + credit; lowest rate.
DSCR
20% down · 8.5% · 30yr
- Down + closing
- —
- Monthly P&I
- —
- Monthly cashflow
- —
- DSCR
- —
- Eligible?
- —
No personal income docs; deal must DSCR.
Hard money
10% down · 12.0% · 12mo
- Down + closing
- —
- Monthly P&I
- —
- Monthly cashflow
- —
- DSCR
- —
- Eligible?
- —
Short-term bridge; refi at stabilization.
Rent comps 3 comps
| Address | Beds | Baths | Sqft | Rent | $/sqft | DOM | Units | Dist |
|---|---|---|---|---|---|---|---|---|
| 13 Legacy Ln Kennebunk, ME | 2.0 | 1.5 | 1008 | $2,800 | $2.78 | 15d | 1 | 0.22mi |
| 3 Thomas Dr Kennebunk, ME | 2.0 | 1.5 | 1000 | $2,150 | $2.15 | 45d | 1 | 0.24mi |
| 11 Cambridge Ct Kennebunk, ME | 2.0 | 2.0 | 1455 | $3,000 | $2.06 | 15d | 1 | 1.13mi |
Listing history 18 events
-
2026-06-22days on market $349,000 Active 108 DOM
-
2026-06-18days on market $349,000 Active 105 DOM
-
2026-06-17days on market $349,000 Active 104 DOM
-
2026-06-16days on market $349,000 Active 103 DOM
-
2026-06-15days on market $349,000 Active 102 DOM
-
2026-06-14days on market $349,000 Active 100 DOM
-
2026-06-10days on market $349,000 Active 97 DOM
-
2026-06-09days on market $349,000 Active 96 DOM
-
2026-06-08days on market $349,000 Active 95 DOM
-
2026-06-07days on market $349,000 Active 94 DOM
-
2026-06-05days on market $349,000 Active 91 DOM
-
2026-06-03days on market $349,000 Active 90 DOM
-
2026-06-02days on market $349,000 Active 89 DOM
-
2026-06-01days on market $349,000 Active 88 DOM
-
2026-05-31days on market $349,000 Active 87 DOM
-
2026-05-30days on market $349,000 Active 86 DOM
-
2026-04-26price $379,500 252-char remark
Show marketing remark (252 chars)
Located in the MRCU zone gives this property multiple options of use. It is a very short distance to downtown Kennebunk, schools and beaches. Both the home and the attached barn are in need of renovations/improvements with the potential of a mixed use.
-
2026-03-05$410,000 Active 252-char remark
Show marketing remark (252 chars)
Located in the MRCU zone gives this property multiple options of use. It is a very short distance to downtown Kennebunk, schools and beaches. Both the home and the attached barn are in need of renovations/improvements with the potential of a mixed use.
ⓘ Source: listings_history table (triggers on properties + properties_extension) + one-shot
backfill from property_details.listing_events for pre-trigger history.
Tax reassessment forecast ME · Partial reset (capped growth)
- Current annual tax
- $4,163 · $347/mo
- Projected year-2 tax
- $4,455 · $371/mo
- Expected delta
- +$292/yr (+$24/mo · 7.0%)
ⓘ Screening estimate from a state-policy table — verify with the county assessor before closing.
Climate risk First Street
- Flood 1/10 Low FEMA zone X · 0% chance over 30 yrs
- Wildfire 3/10 Moderate
- Heat 4/10 Moderate 7 d/yr ≥88°F today · 17 d/yr by 30 yrs out
- Wind 6/10 Major 62% chance of damaging wind over 30 yrs
- Air quality 2/10 Low 1 unhealthy d/yr today · 1 by 30 yrs out
Nearby sold comps map
Loading sold comps map…
Walkable amenities ~0.75 mi
Loading nearby amenities…
Taxation est. · year 1
- Rental income
- $30,627
- − Mortgage interest
- −$19,549
- − Property taxes
- −$4,163
- − Insurance
- −$1,745
- − Repairs & maintenance
- −$2,450
- − Management
- −$2,450
- − Depreciation
- −$10,153
- Taxable loss
- −$9,883
- Est. tax savings @ 24.0%
- +$2,372
- After-tax cash flow
- $-1,303/yr
For passive investors: Depreciation is non-cash, so a rental often shows a tax loss while cash-flowing — sheltering income. Rental losses are passive: they offset passive income freely, and up to $25,000/yr can offset ordinary (W-2) income if you actively participate and your MAGI is under $100k (phasing out to $0 by $150k); unused losses carry forward. On sale, claimed depreciation is recaptured at up to 25%, and gains may owe capital-gains tax (a 1031 exchange can defer both). Figures are a year-1 estimate at your 24.0% rate — not tax advice; consult a CPA.
Schools (NCES district)
- District
- RSU 21
- NCES district ID
- 2314773
- Math proficiency
- 91% ▲ 34.00%
- Reading proficiency
- 94% ▲ 20.00%
- Median HH income
- $68,462
- Composite
- 79.78/100
- National rank
- #55
- State rank
- #13 of 112 in ME
Livability — Kennebunk
- Score
- 79/100
- State rank
- #20
- US rank
- #2049
Category grades
Schools grade is shown separately in the Schools card above.
Census & demographics
- Census place
- Kennebunk, ME
- Population (ZIP)
- 11,692
Population outlook (York County) Hauer SSP2
- Today (2025)
- 209,961 people
- By 2030
- 212,816 · +1.4%
- By 2040
- 214,360 · +2.1%
- By 2050
- 210,350 · +0.2%
- By 2075
- 201,686 · -3.9%
- By 2100
- 183,392 · -12.7%
Race, ethnicity, and origin ACS 2023
- Neighborhood character
- Predominantly White (94%)
- Race & ethnicity
- White 94% Hispanic / Latino 3% Two or more races 2% Asian 2%
- Common ancestry
- Lithuanian 8% Slovak 5% Serbian 3%
- Foreign-born
- 8% · Canada, Vietnam
- Languages at home
- 95% English-only · French/Haitian/Cajun 2% Spanish 2% German/W. Germanic 1%
Political lean MEDSL · York
- 2024 margin
- D (+10.5) · D 54.3% · R 43.8% · Other 1.9%
- 2008→2024 swing
- -10.1pp toward R · 2008: 20.5pp · 2024: 10.5pp
- All cycles
- 2024: D+10.5 2020: D+12.6 2016: D+4.8 2012: D+16.4 2008: D+20.5
Not yet ingested
- Civics
- —
Market trends
- HPI YoY
- ▼ -108.54%
- Current HPI
- 398.495
- Rent YoY
- —
- Metro
- —
- State GDP YoY
- —
- F500 in state
- 0
Price history
-7.4% since first listed2 events — show timeline
- 2026-04-26 Price Changed $379,500 MREIS
- 2026-03-05 Listed $410,000 MREIS
Property tax history
+5.0%/yrLatest (2025): $4,163 · +12.6% YoY. Source: county tax records.
Cash-flow waterfall
monthlySold comps — $/sqft
last 12 mo · ≤1 miLoading sold comps…