6118 433rd St · Primghar, IA
Flood risk 1/10 · Minimal
- FEMA flood zone
- X (unshaded)
- Chance of flooding over 30 yrs
- 0.0%
- Est. flood insurance / yr
- $473 – $860
Fire risk 1/10 · Minimal
- Est. fire insurance / yr
- $902 – $1,676
Heat risk 2/10 · Minimal
- Hot days now (above 100°F)
- 7 days/yr
- Hot days in 30 yrs
- 15 days/yr
Wind risk 2/10 · Minimal
- Chance of severe wind over 30 yrs
- —
Air-quality risk 1/10 · Minimal
- Unhealthy air days now
- 0 days/yr
- Unhealthy air days in 30 yrs
- 0 days/yr
Risk factors via First Street. Map © Google.
Why this score? — see what drove the B grade
The composite is a weighted blend of 9 inputs, each scored 0–100. Each bar is that input's sub-score; the figure is the points it added to the 100-point composite (weight × sub-score).
- Cash flow +27.3/30.0
- DSCR +9.5/10.0
- Appreciation +8.1/10.0
- ARV discount +7.5/15.0
- 1% rule +6.1/10.0
- Schools +5.5/10.0
- Livability +3.8/5.0
- Rent growth +2.5/5.0
- Condition / age +2.5/5.0
$99,000
🖨 Deal sheet (PDF) 📄 Offer letter ✓ Due diligence
Listing remarks MLS
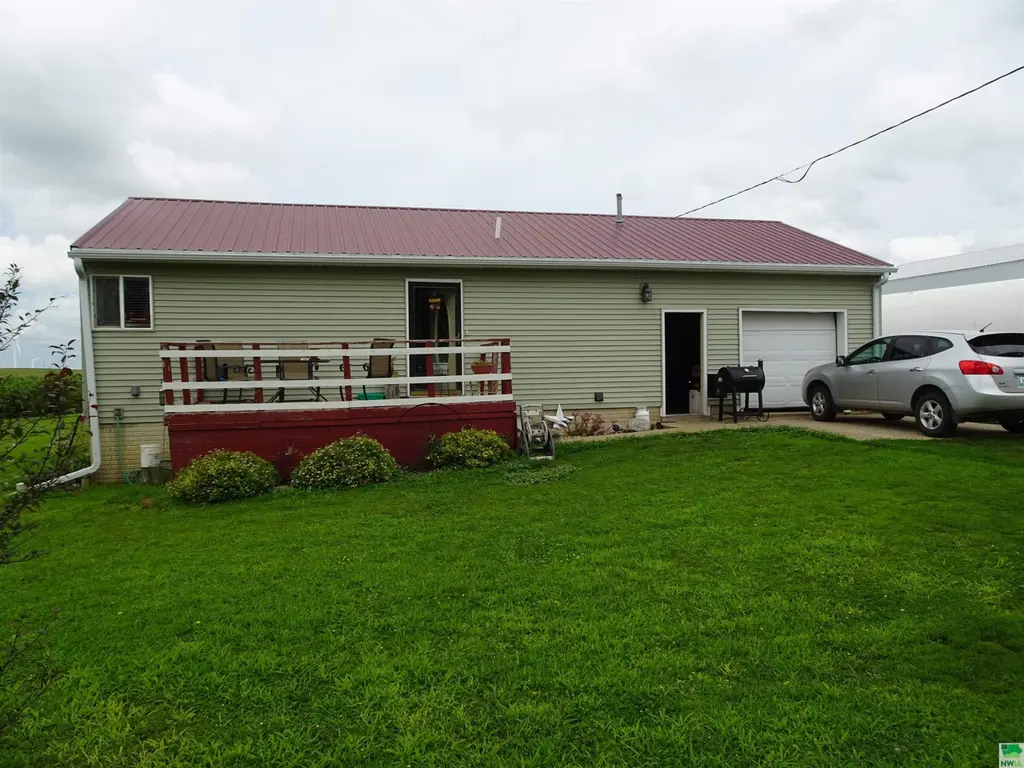
Great home located in Gaza, Iowa, featuring 1 BEDROOM on the main floor PLUS 2 NONCONFORMING BEDROOMS and 2 baths. This residence includes an attached 1-stall garage and large lot. This home is priced to sell and could be a good investment property or a great home for about anyone. Don't miss the opportunity to make this home your own. UTILITIES INFO - AVERAGE MONTHLY TOTAL: $166.00 - Gas/Electric: MidAmerican Energy; Water: Osceola Rural Water
Key facts
- 0.48 acre lot
- Garage
- Built 1950
Neighborhood map
What this means for you Summary
Snapshot
- This is a 3-bed/2.0-bath single-family listed at $99k.
Deal economics
- At list price, monthly cash flow is $288 ($3k/yr) — positive.
- The deal already cash-flows at list — no discount required.
- Meets the 1% rule at list price ($1k rent vs $99k).
- Recommended offer: $87k (12.0% below list) — sets the bar for market timing.
Location & tenants
- Location reads 76/100 on livability (#193 in IA, #3,535 nationally) — a middle-class / working-renter tenant base. Strengths: crime A+, cost of living A+, housing A+; Watch: amenities F, commute F.
- South O'Brien Community School District (rural): math 64% / reading 66% proficiency, ranked #196 of 289 in IA (top 68%) — acceptable for families but not a draw, mixed tenant base, ~2y average lease.
- Zoned schools: South O'Brien Elem Sch Primghar Center (math 67% / reading 67%, grade B+, #273 of 616 statewide, top 51%, 324 students, 38% FRL); South O'Brien Secondary School (math 62% / reading 66%, grade B-, #235 of 336 statewide, top 71%, 252 students, 30% FRL).
- Market conditions: 14 active listings in the ZIP; 13 units permitted in O'Brien County in 2024 (0 in 5+ unit buildings).
Forward outlook
- In year one you build about $7k of equity ($684 loan paydown + $6k appreciation (6.2% local appreciation)).
- O'Brien County population projected at -11% by 2050 — secular population decline; favor cash flow + early exit over multi-decade hold.
- At projected returns (6.2% appreciation + 3.0% rent growth), your $28k cash investment doubles in ~3 years — after that, you're playing with house money.
- By year 6, paydown + projected appreciation supports a ~$37k cash-out refi (75% LTV) — recoverable capital for the next deal without selling this one.
Negotiation context
- It's been on market 309 days — a 12% lower offer ($87k) is reasonable based on typical stale-listing flexibility.
Risks & watch-outs
- Watch-outs: built in 1950 — expect roof / HVAC / electrical / plumbing capex.
Questions for the listing agent
- It's been on market 309 days. Have you received any prior offers? Is the seller open to a 12% concession, seller financing, or rate buy-down credit?
- Built in 1950 — when were the roof, HVAC, electrical panel, plumbing, and water heater last replaced?
- Why hasn't it sold? Are there any deal-killer items the seller is aware of (foundation, flood, title, zoning, code violations)?
- Is there a deadline driving the sale (1031 exchange, divorce, estate, relocation)? That informs how much negotiation room exists.
- Schools are B-rated — typically a magnet for longer-tenancy family renters. What's the average tenant stay here, and is there a school-zone premium baked into asking?
- What's the average days-on-market for RENTAL listings here right now (not sales)? A rising rental-DOM trend means longer vacancies and softer asking-rent achievability than the comps imply.
- What's the recent tenant-quality profile in this submarket — average credit score on applications, eviction rate, late-payment / NSF rate, and stable-employment percentage? A property-management company in the area should have these aggregated.
- How much new for-sale + rental construction is in the pipeline within 1–3 miles? Heavy new supply typically softens prices + rents 12–24 months out; constrained supply supports both.
Investment metrics
- 1% rule
- 1.11% ✓
- Cap rate
- 9.78%
- Cash-on-cash
- 12.45%
- DSCR
- 1.55
- GRM
- 7.5
CMA / ARV
No comps found within radius.
Projected returns pro-forma
6.17% appreciation · 3.0% rent growth · sell at horizon
- IRR
- 26.0%
- Equity multiple
- 2.73×
- Total profit
- $47,837
- Equity at exit
- $63,285
- IRR
- 24.3%
- Equity multiple
- 5.55×
- Total profit
- $126,027
- Equity at exit
- $115,682
Cash invested: $27,720 (down + closing). Projections, not guarantees.
Landlord ↔ Tenant lean methodology
- Overall (STATE)
- 83 Strongly Landlord-Friendly
- State Iowa
- 83 Strongly Landlord-Friendly · R+6
- County
- — inherits STATE
- City
- — inherits STATE
ZIP-level market 51245
- Home prices YoY
- 4.3%
- Active inventory
- 14
- Price-to-rent
- 7.5×
Monthly cashflow live
- Estimated rent
- $1,102 medium interval (Pro) →
- Mortgage (P&I)
- −$519
- Tax from tax record
- −$23 /mo · $274/yr
- Insurance
- −$41
- HOA
- −$0
- Vacancy / Maint / Mgmt
- −$231
- Net cashflow
- $288
Break-even live
Sensitivity live
| Price | -10% $344 | -5% $316 | +0% $288 | +5% $259 | +10% $231 |
|---|---|---|---|---|---|
| Rent | -10% $200 | -5% $244 | +0% $288 | +5% $331 | +10% $375 |
| Rate | -1.0pp $337 | -0.5pp $313 | base $288 | +0.5pp $262 | +1.0pp $236 |
UW: 25.0% down · 7.5% · 30yr · 1.5% tax · 5.0% vac · 8.0% maint · 8.0% mgmt
Financing live
Cash to close
- Down payment
- $24,750
- Closing costs
- $2,970
- Reserves months
- —
- Total cash needed
- —
Loan-product check · same deal, 3 products live
Conventional
25% down · 7.5% · 30yr
- Down + closing
- —
- Monthly P&I
- —
- Monthly cashflow
- —
- DSCR
- —
- Eligible?
- —
Personal DTI + credit; lowest rate.
DSCR
20% down · 8.5% · 30yr
- Down + closing
- —
- Monthly P&I
- —
- Monthly cashflow
- —
- DSCR
- —
- Eligible?
- —
No personal income docs; deal must DSCR.
Hard money
10% down · 12.0% · 12mo
- Down + closing
- —
- Monthly P&I
- —
- Monthly cashflow
- —
- DSCR
- —
- Eligible?
- —
Short-term bridge; refi at stabilization.
Listing history 5 events
-
2026-06-02days on market $99,000 Active 309 DOM
-
2026-06-01days on market $99,000 Active 308 DOM
-
2026-05-31days on market $99,000 Active 307 DOM
-
2026-05-31days on market $99,000 Active 306 DOM
-
2025-07-28$99,000 Active 449-char remark
Show marketing remark (449 chars)
Great home located in Gaza, Iowa, featuring 1 BEDROOM on the main floor PLUS 2 NONCONFORMING BEDROOMS and 2 baths. This residence includes an attached 1-stall garage and large lot. This home is priced to sell and could be a good investment property or a great home for about anyone. Don't miss the opportunity to make this home your own. UTILITIES INFO - AVERAGE MONTHLY TOTAL: $166.00 - Gas/Electric: MidAmerican Energy; Water: Osceola Rural Water
ⓘ Source: listings_history table (triggers on properties + properties_extension) + one-shot
backfill from property_details.listing_events for pre-trigger history.
Tax reassessment forecast IA · Partial reset (capped growth)
- Current annual tax
- $274 · $23/mo
- Projected year-2 tax
- $914 · $76/mo
- Expected delta
- +$640/yr (+$53/mo · 233.6%)
ⓘ Screening estimate from a state-policy table — verify with the county assessor before closing.
Climate risk First Street
- Flood 1/10 Low FEMA zone X (unshaded) · 0% chance over 30 yrs
- Wildfire 1/10 Low
- Heat 2/10 Low 7 d/yr ≥100°F today · 15 d/yr by 30 yrs out
- Wind 2/10 Low
- Air quality 1/10 Low 0 unhealthy d/yr today · 0 by 30 yrs out
Nearby sold comps map
Loading sold comps map…
Walkable amenities ~0.75 mi
Loading nearby amenities…
Taxation est. · year 1
- Rental income
- $13,227
- − Mortgage interest
- −$5,546
- − Property taxes
- −$274
- − Insurance
- −$495
- − Repairs & maintenance
- −$1,058
- − Management
- −$1,058
- − Depreciation
- −$2,880
- Taxable income
- $1,916
- Est. tax owed @ 24.0%
- −$460
- After-tax cash flow
- $2,990/yr
For passive investors: Depreciation is non-cash, so a rental often shows a tax loss while cash-flowing — sheltering income. Rental losses are passive: they offset passive income freely, and up to $25,000/yr can offset ordinary (W-2) income if you actively participate and your MAGI is under $100k (phasing out to $0 by $150k); unused losses carry forward. On sale, claimed depreciation is recaptured at up to 25%, and gains may owe capital-gains tax (a 1031 exchange can defer both). Figures are a year-1 estimate at your 24.0% rate — not tax advice; consult a CPA.
Schools (NCES district)
- District
- South O'Brien Community School District
- NCES district ID
- 1900026
- Math proficiency
- 64% ▼ -6.00%
- Reading proficiency
- 66% ▼ -7.00%
- Median HH income
- $50,412
- Composite
- 55.26/100
- National rank
- #1267
- State rank
- #196 of 289 in IA
Livability — Primghar
- Score
- 76/100
- State rank
- #193
- US rank
- #3535
Category grades
Schools grade is shown separately in the Schools card above.
Census & demographics
- Population (ZIP)
- 1,264
Population outlook (O'Brien County) Hauer SSP2
- Today (2025)
- 13,353 people
- By 2030
- 13,040 · -2.3%
- By 2040
- 12,422 · -7.0%
- By 2050
- 11,887 · -11.0%
- By 2075
- 11,132 · -16.6%
- By 2100
- 10,176 · -23.8%
Race, ethnicity, and origin ACS 2023
- Neighborhood character
- Predominantly White (95%)
- Race & ethnicity
- White 95% Black 3% Two or more races 1%
- Common ancestry
- Iranian 13% Portuguese 4% Slovak 2%
- Foreign-born
- 1% · Canada
Political lean MEDSL · O'Brien
- 2024 margin
- Solid R (+60.9) · D 19.0% · R 80.0% · Other 1.0%
- 2008→2024 swing
- -26.1pp toward R · 2008: -34.9pp · 2024: -60.9pp
- All cycles
- 2024: R+60.9 2020: R+56.8 2016: R+60.2 2012: R+45.2 2008: R+34.9
Not yet ingested
- Civics
- —
Market trends
- HPI YoY
- ▲ 6.17%
- Current HPI
- 148.8467
- Rent YoY
- —
- Metro
- —
- State GDP YoY
- ▲ 2.48%
- F500 in state
- 4
Industry mix (Fortune 500 HQ in IA)
| Industry | F500 HQs | Revenue |
|---|---|---|
| Financial Services | 1 | $16B |
|
||
| Retail / Convenience | 1 | $15B |
|
||
Price history
1 event — show timeline
- 2025-07-28 Listed $99,000 NWIA
Property tax history
-1.2%/yrLatest (2025): $274 · +3.8% YoY. Source: county tax records.
Cash-flow waterfall
monthlySold comps — $/sqft
last 12 mo · ≤1 miLoading sold comps…