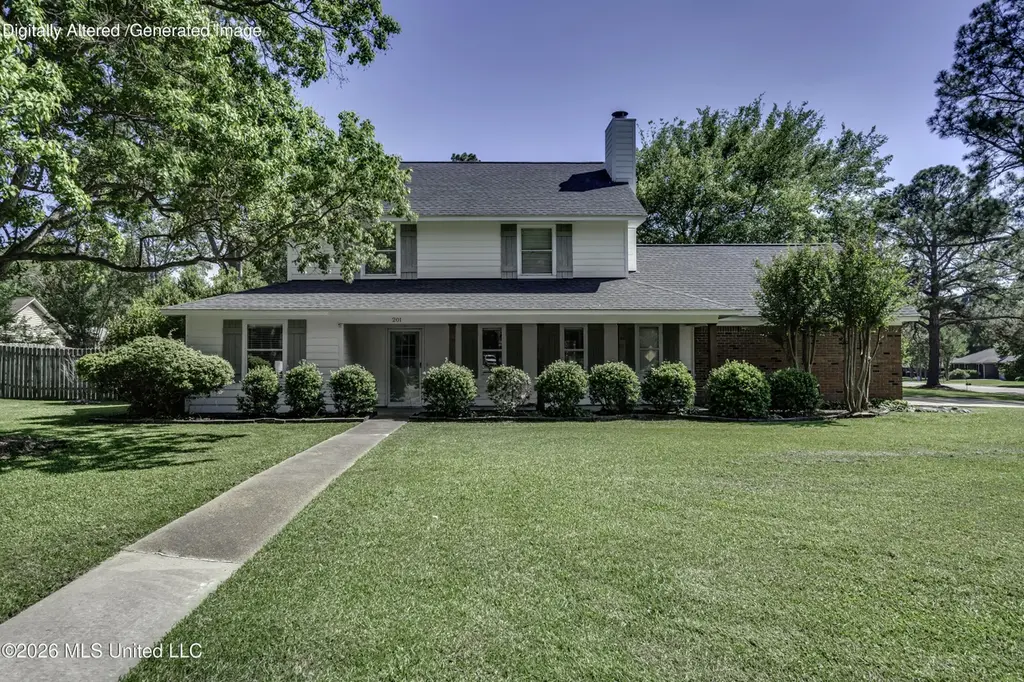
201 Oak Bnd · Madison, MS
Flood risk 1/10 · Minimal
- FEMA flood zone
- X (unshaded)
- Chance of flooding over 30 yrs
- 0.0%
- Est. flood insurance / yr
- $507 – $1,088
Fire risk 1/10 · Minimal
- Est. fire insurance / yr
- $1,241 – $2,305
Heat risk 7/10 · Major
- Hot days now (above 108°F)
- 7 days/yr
- Hot days in 30 yrs
- 20 days/yr
Wind risk 8/10 · Major
- Chance of severe wind over 30 yrs
- 80.0%
Air-quality risk 2/10 · Minimal
- Unhealthy air days now
- 0 days/yr
- Unhealthy air days in 30 yrs
- 1 days/yr
Risk factors via First Street. Map © Google.
Why this score? — see what drove the C- grade
The composite is a weighted blend of 9 inputs, each scored 0–100. Each bar is that input's sub-score; the figure is the points it added to the 100-point composite (weight × sub-score).
- Cash flow +17.4/30.0
- ARV discount +8.2/15.0
- DSCR +5.4/10.0
- Schools +4.8/10.0
- 1% rule +4.7/10.0
- Livability +4.0/5.0
- Condition / age +4.0/5.0
- Rent growth +3.2/5.0
- Appreciation +0.0/10.0
$284,500
🖨 Deal sheet 📄 Offer letter ✓ Due diligence
Listing remarks
Come see this beautiful picture-perfect two-story home nestled on a quiet street in the heart of Madison located in the highly sought after Madison Avenue and Madison Central School District. Situated on a beautiful landscaped corner lot full of charm and curb appeal, this home also features a spacious backyard that is just perfect for entertaining family and friends. Step inside to discover a fully renovated 3-bedroom 2.5 bathroom home that is truly move-in ready. You'll love the new flooring throughout, brand-new appliances, and gorgeous light fixtures that add the perfect touch of style and warmth. The dining room is a true stand out, featuring beautiful wainscoting, designer wallpaper,
Key facts
- Brand new appliances
- Spacious backyard
- Fully renovated home
Tags
Property features AI
Finance
- HOA & community: Homeowners association with an annual fee of $25 covering grounds maintenance; Community features include curbs and street lights
Exterior
- Parking: 2-car garage; Driveway; Garage door opener; Concrete parking surfaces
- Utilities: Public water; Public sewer; Electricity connected; Natural gas available; Cable available; Phone available; Water connected; Underground utilities
- Home design: Single family residence (house); Two levels; Move-in ready
- Construction: Brick and wood siding construction; Architectural shingle roof; Conventional foundation; Year built reported by owner
- Exterior features: Front porch, rear porch and additional porch; Fire pit; Exterior lighting; Private entrance; Private yard; Uncovered courtyard; Fenced backyard with wood privacy fencing; Landscaped front yard; Corner lot
Interior
- Kitchen: Dishwasher; Oven; Refrigerator; Granite counters; Pantry
- Bedrooms: Three upstairs bedrooms; Additional bedroom(s) on main level
- Flooring: Luxury vinyl; Carpet
- Bathrooms: Two full bathrooms; One half bathroom
- Heating & cooling: Central heating; Fireplace heating; Central air; Attic fan; Ceiling fan(s)
- Interior features: Built-in bookcases; Built-in features; Entrance foyer; Granite counters; Pantry; Walk-in closet(s); Has fireplace (living room, bath)
- Laundry & utility: Laundry room with washer and electric dryer hookups; Laundry sink; Laundry areas on main and lower levels
Neighborhood map
What this means for you Summary
Snapshot
- This is a 3-bed/2.5-bath single-family listed at $284k. Condition is rated good.
Deal economics
- At list price, monthly cash flow is $216 ($3k/yr) — positive.
- The deal already cash-flows at list — no discount required.
- To meet the 1% rule (rent ≥ 1% of price), the offer needs to be $276k (2.8% below list).
- Recommended offer: $276k (2.8% below list) — sets the bar for 1% rule.
- Cap rate 7.2% vs local median 3.7% in Madison — top-decile yield for the area; either an underpriced asset or a hidden risk that comps aren't pricing in. Stress-test before assuming the spread holds.
Location & tenants
- Location reads 81/100 on livability (#4 in MS, #1,556 nationally) — a professional / high-income tenant draw. Strengths: crime A+, employment A+, housing A+; Watch: amenities D-, commute F.
- Madison County School District (rural): math 54% / reading 54% proficiency, ranked #3 of 130 in MS (top 2%) — acceptable for families but not a draw, mixed tenant base, ~2y average lease.
- Zoned schools: Madison Station Elementary School (math 76% / reading 75%, grade A, #4 of 375 statewide, top 1%, 1,035 students, 100% FRL); Madison Central High School (math 5% / reading 63%, grade F, #78 of 197 statewide, top 39%, 1,246 students, 100% FRL) — zoned schools average 100% FRL vs 29% district-wide (70 pts higher); higher-poverty schools than district average — tighter screening recommended.
- Market conditions: Rents rising (+2.6%/yr); 628 active listings in the ZIP; 3 comparable units currently listed for rent nearby; rentals lingering (median 44d on market — plan ~5-8 weeks vacancy on turnover, expect pricing pressure); 67% of comp listings sitting > 30 days — soft ceiling on asking rent; high-income renter base; 553 units permitted in Madison County in 2024 (0 in 5+ unit buildings).
Forward outlook
- Local home prices are declining (-3.0%/yr); year-one equity from $2k of loan paydown is wiped out by about $9k of value loss. Plan a longer hold.
- Madison County population projected at +34% by 2050 — long-run rental-demand tailwind backs the buy-and-hold thesis.
Negotiation context
- Only 4 days on market — expect competitive offers; lowballing is unlikely to land.
- 5 sale attempts since 19y ago with the ask held roughly flat each time — persistent listings suggest the price (not the market) is what's stuck; bring a comps-based counter.
Risks & watch-outs
- Climate carrying-cost: severe wind risk, 80% chance of damaging wind over 30y; extreme-heat days projected 7→20/yr by 2055 (HVAC capex compounding) — expect insurance premiums to compound above CPI over the hold.
Questions for the listing agent
- Built in 1979 — when were the roof, HVAC, electrical panel, plumbing, and water heater last replaced?
- What does the HOA fee cover, when was the last increase, and are there any pending special assessments or reserve-fund shortfalls?
- Is there a deadline driving the sale (1031 exchange, divorce, estate, relocation)? That informs how much negotiation room exists.
- Schools are A-rated — typically a magnet for longer-tenancy family renters. What's the average tenant stay here, and is there a school-zone premium baked into asking?
- What's the average days-on-market for RENTAL listings here right now (not sales)? A rising rental-DOM trend means longer vacancies and softer asking-rent achievability than the comps imply.
- What's the recent tenant-quality profile in this submarket — average credit score on applications, eviction rate, late-payment / NSF rate, and stable-employment percentage? A property-management company in the area should have these aggregated.
- How much new for-sale + rental construction is in the pipeline within 1–3 miles? Heavy new supply typically softens prices + rents 12–24 months out; constrained supply supports both.
Investment metrics
- 1% rule
- 0.97% ✗
- Cap rate
- 7.20%
- Cash-on-cash
- 3.25%
- DSCR
- 1.14
- GRM
- 8.6
CMA / ARV
- ARV (on-the-fly)
- $289,062
- Comps found
- 12
Show comp detail 12 sales within ~0.75 mi
| Address | Dist | Beds/Ba | Sqft | Sold | Price | $/sf | Match |
|---|---|---|---|---|---|---|---|
| 201 Oak Bnd | 0.00mi | 3/2.5 | 1,818 (0%) | 1mo | $284,500 | $156 | 99 |
| 172 Stonegate Dr | 0.04mi | 3/2.0 | 1,664 (-8%) | 12mo | $259,900 | $156 | 72 |
| 225 Oak Bnd | 0.10mi | 3/2.0 | 1,718 (-6%) | 17mo | $249,900 | $145 | 70 |
| 149 Stonegate Dr | 0.17mi | 3/2.0 | 2,060 (+13%) | 7mo | $235,000 | $114 | 62 |
| 643 Boxwood Pl | 0.69mi | 3/2.0 | 1,987 (+9%) | 1mo | $389,000 | $196 | 49 |
| 100 Greenfield Way | 0.61mi | 3/2.0 | 1,689 (-7%) | 15mo | $260,000 | $154 | 46 |
| 352 South Pl | 0.44mi | 3/2.0 | 1,570 (-14%) | 11mo | $279,000 | $178 | 45 |
| 113 N Ridge Dr | 0.59mi | 3/2.0 | 1,578 (-13%) | 5mo | $272,000 | $172 | 44 |
| 209 Pine Pl | 0.61mi | 3/2.0 | 1,553 (-15%) | 3mo | $270,000 | $174 | 43 |
| 245 N Ridge Dr | 0.57mi | 3/2.0 | 1,640 (-10%) | 18mo | $249,900 | $152 | 40 |
| 228 Belle Rose Cir | 0.57mi | 3/2.0 | 2,050 (+13%) | 18mo | $337,000 | $164 | 35 |
| 276 Belle Rose Cir | 0.62mi | 4/2.0 (+1) | 2,073 (+14%) | 13mo | $330,600 | $159 | 30 |
Match score weights: distance 35% · size 25% · config 20% · recency 20%. Top-matched comps best support the ARV.
Projected returns pro-forma
-3.0% appreciation · 2.61% rent growth · sell at horizon
- IRR
- -11.6%
- Equity multiple
- 0.58×
- Total profit
- $-33,386
- Equity at exit
- $42,420
- IRR
- -3.0%
- Equity multiple
- 0.80×
- Total profit
- $-15,588
- Equity at exit
- $24,598
Cash invested: $79,660 (down + closing). Projections, not guarantees.
Landlord ↔ Tenant lean methodology
- Overall (STATE)
- 90 Strongly Landlord-Friendly
- State Mississippi
- 90 Strongly Landlord-Friendly · R+11
- County
- — inherits STATE
- City
- — inherits STATE
ZIP-level market 39110
- Home prices YoY
- -28.3%
- Rents YoY
- 2.6%
- Active inventory
- 628
- Price-to-rent
- 8.6×
Monthly cashflow live
- Estimated rent
- $2,765 medium interval (Pro) →
- Mortgage (P&I)
- −$1,492
- Tax est. 1.5%
- −$356 /mo · $4,268/yr
- Insurance
- −$119
- HOA
- −$2
- Vacancy / Maint / Mgmt
- −$581
- Net cashflow
- $216
Break-even live
UW: 25.0% down · 7.5% · 30yr · 1.5% tax · 5.0% vac · 8.0% maint · 8.0% mgmt
Financing live
Cash to close
- Down payment
- $71,125
- Closing costs
- $8,535
- Reserves months
- —
- Total cash needed
- —
Loan-product check · same deal, 3 products live
Conventional
25% down · 7.5% · 30yr
- Down + closing
- —
- Monthly P&I
- —
- Monthly cashflow
- —
- DSCR
- —
- Eligible?
- —
Personal DTI + credit; lowest rate.
DSCR
20% down · 8.5% · 30yr
- Down + closing
- —
- Monthly P&I
- —
- Monthly cashflow
- —
- DSCR
- —
- Eligible?
- —
No personal income docs; deal must DSCR.
Hard money
10% down · 12.0% · 12mo
- Down + closing
- —
- Monthly P&I
- —
- Monthly cashflow
- —
- DSCR
- —
- Eligible?
- —
Short-term bridge; refi at stabilization.
Rent comps 3 comps
| Address | Beds | Baths | Sqft | Rent | $/sqft | DOM | Units | Dist |
|---|---|---|---|---|---|---|---|---|
| 143 Sonnett Cir Madison, MS | 4.0 | 3.0 | 2564 | $3,250 | $1.27 | 23d | 1 | 0.76mi |
| 345 Avonlea Ln Madison, MS | 3.0 | 2.0 | 2185 | $2,500 | $1.14 | 43d | 1 | 0.77mi |
| 1011 Mcdale Ln Madison, MS | 4.0 | 2.0 | 2036 | $2,500 | $1.23 | 43d | 1 | 1.02mi |
HOA detail
- Monthly dues
- $2 · $24/yr
Listing history 10 events
-
2026-04-29status Pending
-
2026-04-25$284,500 Active
-
2021-10-08historical
-
2021-10-08historical
-
2021-10-08historical
-
2010-10-04$151,900
-
2009-09-29historical
-
2009-09-29$151,900
-
2008-09-24$151,900
-
2007-10-03$164,900
ⓘ Source: listings_history table (triggers on properties + properties_extension) + one-shot
backfill from property_details.listing_events for pre-trigger history.
Climate risk First Street
- Flood 1/10 Low FEMA zone X (unshaded) · 0% chance over 30 yrs
- Wildfire 1/10 Low
- Heat 7/10 Severe 7 d/yr ≥108°F today · 20 d/yr by 30 yrs out
- Wind 8/10 Severe 80% chance of damaging wind over 30 yrs
- Air quality 2/10 Low 0 unhealthy d/yr today · 1 by 30 yrs out
Nearby sold comps map
Loading sold comps map…
Walkable amenities ~0.75 mi
Loading nearby amenities…
Taxation est. · year 1
- Rental income
- $33,175
- − Mortgage interest
- −$15,936
- − Property taxes
- −$4,268
- − Insurance
- −$1,422
- − Repairs & maintenance
- −$2,654
- − Management
- −$2,654
- − HOA
- −$24
- − Depreciation
- −$8,276
- Taxable loss
- −$2,059
- Est. tax savings @ 24.0%
- +$494
- After-tax cash flow
- $3,085/yr
For passive investors: Depreciation is non-cash, so a rental often shows a tax loss while cash-flowing — sheltering income. Rental losses are passive: they offset passive income freely, and up to $25,000/yr can offset ordinary (W-2) income if you actively participate and your MAGI is under $100k (phasing out to $0 by $150k); unused losses carry forward. On sale, claimed depreciation is recaptured at up to 25%, and gains may owe capital-gains tax (a 1031 exchange can defer both). Figures are a year-1 estimate at your 24.0% rate — not tax advice; consult a CPA.
Condition & rehab AI · 12 photos
This move-in ready, fully renovated two-story home in Madison features new flooring, appliances, and fixtures, making it a great investment opportunity.
Value-add opportunities
- Both landscaping — enhances curb appeal and value
- Both paint exterior — improves curb appeal and value
- Both paint interior — enhances interior and value
Renovation cost estimate screening
Value-add ROI direction
- Both landscaping — enhances curb appeal and value ↑
- Both paint exterior — improves curb appeal and value ↑
- Both paint interior — enhances interior and value ↑
ⓘ Cost ranges are severity-bucket heuristics (US national rule-of-thumb). Get contractor quotes + a written scope before underwriting a rehab budget.
Schools (NCES district)
- District
- Madison County School District
- NCES district ID
- 2802790
- Math proficiency
- 54% ▼ -7.00%
- Reading proficiency
- 54% ▼ -7.00%
- Median HH income
- $70,579
- Composite
- 48.08/100
- National rank
- #2188
- State rank
- #3 of 130 in MS
Livability — Madison
- Score
- 81/100
- State rank
- #4
- US rank
- #1556
Category grades
Schools grade is shown separately in the Schools card above.
Census & demographics
- Census place
- Madison, MS
- County
- Madison County · 75,005 people
- City population
- 50,443
- Metro
- Jackson, MS
- Population (ZIP)
- 50,443
- Household income
- $125,506
- Rent vs Own
- Severe rent burden
- 227.0
Population outlook (Madison County) Hauer SSP2
- Today (2025)
- 122,509 people
- By 2030
- 131,737 · +7.5%
- By 2040
- 148,930 · +21.6%
- By 2050
- 164,300 · +34.1%
- By 2075
- 197,495 · +61.2%
- By 2100
- 211,429 · +72.6%
Race, ethnicity, and origin ACS 2023
- Neighborhood character
- Predominantly White (76%)
- Race & ethnicity
- White 76% Black 15% Asian 4% Two or more races 3% Hispanic / Latino 2%
- Common ancestry
- Italian 6% Slovak 3% Lithuanian 3%
- Foreign-born
- 5% · China, Canada
- Languages at home
- 92% English-only · Spanish 2% Other Indo-European 2% Chinese 1%
Political lean MEDSL · Madison
- 2024 margin
- R (+17.3) · D 40.8% · R 58.0% · Other 1.2%
- 2008→2024 swing
- -1.7pp toward R · 2008: -15.6pp · 2024: -17.3pp
- All cycles
- 2024: R+17.3 2020: R+11.8 2016: R+16.1 2012: R+15.7 2008: R+15.6
Not yet ingested
- Civics
- —
Market trends
- HPI YoY
- ▼ -60.99%
- Current HPI
- 154.6909
- Rent YoY
- ▲ 2.61%
- Metro
- Jackson, MS
- State GDP YoY
- —
- F500 in state
- 0
Price history
+72.5% since first listed10 events — show timeline
- 2026-04-29 Pending — MLSU
- 2026-04-25 Listed $284,500 MLSU
- 2021-10-08 Listing Removed — MLSU
- 2021-10-08 Listing Removed — MLSU
- 2021-10-08 Listing Removed — MLSU
- 2010-10-04 Listed $151,900 MLSU
- 2009-09-29 Listed $151,900 MLSU
- 2009-09-29 Listing Removed — MLSU
- 2008-09-24 Listed $151,900 MLSU
- 2007-10-03 Listed $164,900 MLSU
Cash-flow waterfall
monthlySold comps — $/sqft
last 12 mo · ≤1 miLoading sold comps…