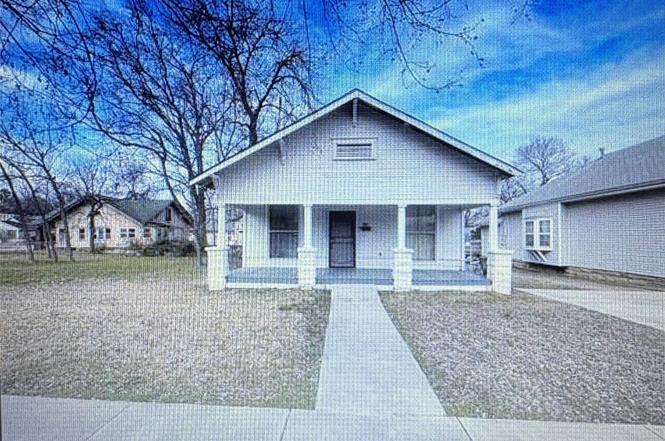
105 E 3rd St · Okmulgee, OK
Flood risk 1/10 · Minimal
- FEMA flood zone
- X (unshaded)
- Chance of flooding over 30 yrs
- 0.0%
- Est. flood insurance / yr
- $507 – $1,088
Fire risk 7/10 · Major
- Est. fire insurance / yr
- $2,463 – $4,575
Heat risk 6/10 · Moderate
- Hot days now (above 111°F)
- 7 days/yr
- Hot days in 30 yrs
- 20 days/yr
Wind risk 3/10 · Minor
- Chance of severe wind over 30 yrs
- 4.0%
Air-quality risk 2/10 · Minimal
- Unhealthy air days now
- 1 days/yr
- Unhealthy air days in 30 yrs
- 2 days/yr
Risk factors via First Street. Map © Google.
Why this score? — see what drove the B grade
The composite is a weighted blend of 9 inputs, each scored 0–100. Each bar is that input's sub-score; the figure is the points it added to the 100-point composite (weight × sub-score).
- Cash flow +30.0/30.0
- ARV discount +15.0/15.0
- 1% rule +10.0/10.0
- DSCR +10.0/10.0
- Livability +3.1/5.0
- Rent growth +2.5/5.0
- Condition / age +2.5/5.0
- Schools +0.4/10.0
- Appreciation +0.2/10.0
$60,000
🖨 Deal sheet 📄 Offer letter ✓ Due diligence
Listing remarks
Located on a quiet street and close to the downtown, and within walking distance. Updates to the floor, faucets, and ceiling fans. Newer hot water tank. The master bedroom has a large walk in closet add-on. Covered front porch with nice sized yard. Good starter home. Sold AS-IS.
Key facts
- Updates to faucets
- Walking distance
- Newer hot water tank
Tags
Property features AI
Finance
- HOA & community: Sidewalks in the community
Exterior
- Parking: Concrete driveway
- Security: Smoke detector(s); No safety shelter
- Utilities: Public water; Public sewer; Phone service available
- Home design: Single-story home; Faces north; Crawlspace foundation
- Construction: Wood siding with wood frame construction; Asphalt/fiberglass roof; Built per public records
- Exterior features: Covered porch; Concrete driveway; Satellite dish; Mature trees on lot
Interior
- Kitchen: Kitchen with breakfast nook; Gas range/oven connection; Stove, Oven, Range, Refrigerator
- Bedrooms: Master bedroom with separate closets and walk-in closet (First floor); Additional bedroom with walk-in closet (First floor)
- Flooring: Laminate flooring
- Bathrooms: One full bathroom with bathtub (Hall bath) (First floor)
- Heating & cooling: Heating: Electric, Gas, and space heater options; Cooling: Window unit(s)
- Interior features: High-speed internet available; Cable TV and wired for data; Laminate counters; Aluminum-framed windows; Internal expansion space; Smoke detector(s)
- Laundry & utility: Washer and dryer included; Electric and gas dryer hookups; Gas water heater
Neighborhood map
What this means for you Summary
Snapshot
- This is a 2-bed/1.0-bath single-family listed at $60k.
Deal economics
- At list price, monthly cash flow is $469 ($6k/yr) — positive.
- The deal already cash-flows at list — no discount required.
- Meets the 1% rule at list price ($1k rent vs $60k).
- Recommended offer: $55k (9.0% below list) — sets the bar for market timing.
- Cap rate 15.7% vs local median 7.6% in Okmulgee — top-decile yield for the area; either an underpriced asset or a hidden risk that comps aren't pricing in. Stress-test before assuming the spread holds.
Location & tenants
- Location reads 61/100 on livability (#300 in OK) — a middle-class / working-renter tenant base. Strengths: cost of living A+, housing A+, health & safety A+; Watch: schools F, crime F, amenities F.
- Okmulgee (town): math 3% / reading 7% proficiency, ranked #264 of 270 in OK (top 98%) — low school quality limits family demand, transient renter base, plan for 1-2y turnover; 73% free/reduced lunch — lower-income household profile, screen leases tightly.
- Market conditions: 146 active listings in the ZIP; 5 comparable units currently listed for rent nearby; rentals at typical pace (median 24d on market — plan ~3-4 weeks tenant-placement turnaround); 12 units permitted in Okmulgee County in 2024 (0 in 5+ unit buildings).
Forward outlook
- Local home prices are declining (-3.0%/yr); year-one equity from $415 of loan paydown is wiped out by about $2k of value loss. Plan a longer hold.
- Okmulgee County population projected at -13% by 2050 — secular population decline; favor cash flow + early exit over multi-decade hold.
- At projected returns (-3.0% appreciation + 3.0% rent growth), your $17k cash investment doubles in ~4 years — after that, you're playing with house money.
Negotiation context
- It's been on market 104 days — a 9% lower offer ($55k) is reasonable based on typical stale-listing flexibility.
- 5 sale attempts with the ask held roughly flat each time — persistent listings suggest the price (not the market) is what's stuck; bring a comps-based counter.
- Current owner paid $8k; list at $60k implies a 650% gain — meaningful room to come down on a strong offer.
Risks & watch-outs
- Watch-outs: built in 1920 — expect roof / HVAC / electrical / plumbing capex.
- Climate carrying-cost: major wildfire risk; extreme-heat days projected 7→20/yr by 2055 (HVAC capex compounding) — expect insurance premiums to compound above CPI over the hold.
Questions for the listing agent
- It's been on market 104 days. Have you received any prior offers? Is the seller open to a 9% concession, seller financing, or rate buy-down credit?
- Built in 1920 — when were the roof, HVAC, electrical panel, plumbing, and water heater last replaced?
- Why hasn't it sold? Are there any deal-killer items the seller is aware of (foundation, flood, title, zoning, code violations)?
- Is there a deadline driving the sale (1031 exchange, divorce, estate, relocation)? That informs how much negotiation room exists.
- Schools are F-rated, which usually means shorter tenancies and higher turnover. Who's the typical renter profile here, and what's been the actual vacancy rate?
- Crime grade is F in this area — have there been break-ins, vandalism, or insurance claims at this property in the last 3 years? What carrier currently insures it and at what premium?
- What's the average days-on-market for RENTAL listings here right now (not sales)? A rising rental-DOM trend means longer vacancies and softer asking-rent achievability than the comps imply.
- What's the recent tenant-quality profile in this submarket — average credit score on applications, eviction rate, late-payment / NSF rate, and stable-employment percentage? A property-management company in the area should have these aggregated.
- How much new for-sale + rental construction is in the pipeline within 1–3 miles? Heavy new supply typically softens prices + rents 12–24 months out; constrained supply supports both.
Investment metrics
- 1% rule
- 1.81% ✓
- Cap rate
- 15.67%
- Cash-on-cash
- 33.48%
- DSCR
- 2.49
- GRM
- 4.6
CMA / ARV
- ARV (on-the-fly)
- $100,800
- Comps found
- 12
Show comp detail 12 sales within ~0.75 mi
| Address | Dist | Beds/Ba | Sqft | Sold | Price | $/sf | Match |
|---|---|---|---|---|---|---|---|
| 910 N Okmulgee Ave | 0.46mi | 3/1.0 (+1) | 1,218 (+2%) | 7mo | $50,000 | $41 | 65 |
| 901 E 9th St | 0.66mi | 2/1.0 | 1,200 (0%) | 11mo | $123,000 | $103 | 60 |
| 1118 N Alabama Ave | 0.70mi | 3/1.0 (+1) | 1,182 (-2%) | 1mo | $15,000 | $13 | 59 |
| 602 N Collins Ave | 0.42mi | 2/2.0 | 1,333 (+11%) | 5mo | $75,000 | $56 | 54 |
| 701 S Muskogee Ave | 0.64mi | 2/1.0 | 1,133 (-6%) | 14mo | $148,000 | $131 | 49 |
| 1106 N Alabama Ave | 0.65mi | 3/1.0 (+1) | 1,304 (+9%) | 3mo | $109,900 | $84 | 48 |
| 812 W 6th St | 0.56mi | 2/1.0 | 1,326 (+10%) | 16mo | $8,000 | $6 | 43 |
| 705 S Muskogee Ave | 0.66mi | 2/1.0 | 1,080 (-10%) | 12mo | $155,000 | $144 | 43 |
| 414 E 12th St | 0.66mi | 2/1.0 | 1,106 (-8%) | 17mo | $35,000 | $32 | 42 |
| 1103 N Alabama Ave | 0.64mi | 3/2.0 (+1) | 1,260 (+5%) | 15mo | $141,000 | $112 | 40 |
| 518 S Morton Ave | 0.52mi | 2/1.0 | 1,064 (-11%) | 20mo | $15,000 | $14 | 40 |
| 805 N Sherman Ave | 0.73mi | 3/1.0 (+1) | 1,064 (-11%) | 11mo | $123,000 | $116 | 33 |
Match score weights: distance 35% · size 25% · config 20% · recency 20%. Top-matched comps best support the ARV.
Projected returns pro-forma
-3.0% appreciation · 3.0% rent growth · sell at horizon
- IRR
- 28.7%
- Equity multiple
- 2.20×
- Total profit
- $20,133
- Equity at exit
- $8,946
- IRR
- 36.1%
- Equity multiple
- 4.33×
- Total profit
- $55,979
- Equity at exit
- $5,188
Cash invested: $16,800 (down + closing). Projections, not guarantees.
Landlord ↔ Tenant lean methodology
- Overall (STATE)
- 83 Strongly Landlord-Friendly
- State Oklahoma
- 83 Strongly Landlord-Friendly · R+20
- County
- — inherits STATE
- City
- — inherits STATE
ZIP-level market 74447
- Home prices YoY
- -3.6%
- Active inventory
- 146
- Price-to-rent
- 4.6×
Monthly cashflow live
- Estimated rent
- $1,087 high interval (Pro) →
- Mortgage (P&I)
- −$315
- Tax from tax record
- −$50 /mo · $606/yr
- Insurance
- −$25
- HOA
- −$0
- Vacancy / Maint / Mgmt
- −$228
- Net cashflow
- $469
Break-even live
UW: 25.0% down · 7.5% · 30yr · 1.5% tax · 5.0% vac · 8.0% maint · 8.0% mgmt
Financing live
Cash to close
- Down payment
- $15,000
- Closing costs
- $1,800
- Reserves months
- —
- Total cash needed
- —
Loan-product check · same deal, 3 products live
Conventional
25% down · 7.5% · 30yr
- Down + closing
- —
- Monthly P&I
- —
- Monthly cashflow
- —
- DSCR
- —
- Eligible?
- —
Personal DTI + credit; lowest rate.
DSCR
20% down · 8.5% · 30yr
- Down + closing
- —
- Monthly P&I
- —
- Monthly cashflow
- —
- DSCR
- —
- Eligible?
- —
No personal income docs; deal must DSCR.
Hard money
10% down · 12.0% · 12mo
- Down + closing
- —
- Monthly P&I
- —
- Monthly cashflow
- —
- DSCR
- —
- Eligible?
- —
Short-term bridge; refi at stabilization.
Rent comps 5 comps
| Address | Beds | Baths | Sqft | Rent | $/sqft | DOM | Units | Dist |
|---|---|---|---|---|---|---|---|---|
| 324 E 6th St Unit 214 Okmulgee, OK | 2.0 | 1.0 | 891 | $1,200 | $1.35 | 23d | 1 | 0.26mi |
| 324 E 6th St Unit 204 Okmulgee, OK | 2.0 | 1.0 | 770 | $1,150 | $1.49 | 23d | 1 | 0.26mi |
| 324 E 6th St Unit 116 Okmulgee, OK | 2.0 | 1.0 | 776 | $1,060 | $1.37 | 23d | 1 | 0.26mi |
| 118 N Taft Ave Okmulgee, OK | 3.0 | 2.0 | 1212 | $1,000 | $0.83 | 14d | 1 | 0.65mi |
| 1104 W 8th St Okmulgee, OK | 2.0 | 1.0 | 1084 | $850 | $0.78 | 3d | 1 | 0.77mi |
Listing history 27 events
-
2026-06-18days on market $60,000 Active 104 DOM
-
2026-06-17days on market $60,000 Active 103 DOM
-
2026-06-16days on market $60,000 Active 102 DOM
-
2026-06-15days on market $60,000 Active 101 DOM
-
2026-06-13days on market $60,000 Active 99 DOM
-
2026-06-12days on market $60,000 Active 98 DOM
-
2026-06-09days on market $60,000 Active 95 DOM
-
2026-06-08days on market $60,000 Active 94 DOM
-
2026-06-08days on market $60,000 Active 93 DOM
-
2026-06-07days on market $60,000 Active 92 DOM
-
2026-06-04days on market $60,000 Active 89 DOM
-
2026-06-02days on market $60,000 Active 88 DOM
-
2026-06-01days on market $60,000 Active 87 DOM
-
2026-05-31days on market $60,000 Active 86 DOM
-
2026-04-19status Active
-
2026-03-04status Pending
-
2026-01-19$60,000 Active
-
2026-01-15historical
-
2026-01-12price $60,000
-
2025-11-28price $62,000
-
2025-07-15$65,000 Active
-
2025-07-14historical
-
2025-06-15price $68,000
-
2025-05-01status Active
-
2025-04-24status Pending
-
2025-02-14$72,000 Active
-
2006-05-26soldstatus $8,000
ⓘ Source: listings_history table (triggers on properties + properties_extension) + one-shot
backfill from property_details.listing_events for pre-trigger history.
Tax reassessment forecast OK · Resets to sale price
- Current annual tax
- $606 · $50/mo
- Projected year-2 tax
- $606 · $50/mo
- Expected delta
- $0/yr ($0/mo · 0.0%)
ⓘ Screening estimate from a state-policy table — verify with the county assessor before closing.
Climate risk First Street
- Flood 1/10 Low FEMA zone X (unshaded) · 0% chance over 30 yrs
- Wildfire 7/10 Severe
- Heat 6/10 Major 7 d/yr ≥111°F today · 20 d/yr by 30 yrs out
- Wind 3/10 Moderate 4% chance of damaging wind over 30 yrs
- Air quality 2/10 Low 1 unhealthy d/yr today · 2 by 30 yrs out
Nearby sold comps map
Loading sold comps map…
Walkable amenities ~0.75 mi
Loading nearby amenities…
Taxation est. · year 1
- Rental income
- $13,046
- − Mortgage interest
- −$3,361
- − Property taxes
- −$606
- − Insurance
- −$300
- − Repairs & maintenance
- −$1,044
- − Management
- −$1,044
- − Depreciation
- −$1,745
- Taxable income
- $4,947
- Est. tax owed @ 24.0%
- −$1,187
- After-tax cash flow
- $4,438/yr
For passive investors: Depreciation is non-cash, so a rental often shows a tax loss while cash-flowing — sheltering income. Rental losses are passive: they offset passive income freely, and up to $25,000/yr can offset ordinary (W-2) income if you actively participate and your MAGI is under $100k (phasing out to $0 by $150k); unused losses carry forward. On sale, claimed depreciation is recaptured at up to 25%, and gains may owe capital-gains tax (a 1031 exchange can defer both). Figures are a year-1 estimate at your 24.0% rate — not tax advice; consult a CPA.
Schools (NCES district)
- District
- Okmulgee
- NCES district ID
- 4022800
- Math proficiency
- 3% ▼ -5.00%
- Reading proficiency
- 7% ▼ -8.00%
- Median HH income
- $31,078
- Composite
- 3.66/100
- National rank
- #10069
- State rank
- #264 of 270 in OK
Livability — Okmulgee
- Score
- 61/100
- State rank
- #300
- US rank
- #17773
Category grades
Schools grade is shown separately in the Schools card above.
Census & demographics
- Census place
- Okmulgee, OK
- Population (ZIP)
- 15,500
Population outlook (Okmulgee County) Hauer SSP2
- Today (2025)
- 37,543 people
- By 2030
- 36,528 · -2.7%
- By 2040
- 34,430 · -8.3%
- By 2050
- 32,498 · -13.4%
- By 2075
- 28,814 · -23.3%
- By 2100
- 25,193 · -32.9%
Race, ethnicity, and origin ACS 2023
- Neighborhood character
- Diverse neighborhood (Simpson 0.69)
- Race & ethnicity
- White 54% Native American 15% Two or more races 15% Black 13% Hispanic / Latino 4%
- Common ancestry
- Slovak 2% Italian 1% Romanian 1%
- Foreign-born
- 1%
- Languages at home
- 97% English-only · Spanish 1%
Political lean MEDSL · Okmulgee
- 2024 margin
- Solid R (+42.7) · D 27.7% · R 70.4% · Other 1.9%
- 2008→2024 swing
- -25.7pp toward R · 2008: -17.0pp · 2024: -42.7pp
- All cycles
- 2024: R+42.7 2020: R+37.1 2016: R+32.7 2012: R+17.5 2008: R+17.0
Not yet ingested
- Civics
- —
Market trends
- HPI YoY
- ▼ -9.69%
- Current HPI
- 257.2856
- Rent YoY
- —
- Metro
- —
- State GDP YoY
- ▲ 1.55%
- F500 in state
- 6
Industry mix (Fortune 500 HQ in OK)
| Industry | F500 HQs | Revenue |
|---|---|---|
| Energy | 3 | $48B |
|
||
Price history
+650.0% since first listed13 events — show timeline
- 2026-04-19 Relisted — MLS Technology, Inc.
- 2026-03-04 Pending — MLS Technology, Inc.
- 2026-01-19 Listed $60,000 MLS Technology, Inc.
- 2026-01-15 Listing Removed — MLS Technology, Inc.
- 2026-01-12 Price Changed $60,000 MLS Technology, Inc.
- 2025-11-28 Price Changed $62,000 MLS Technology, Inc.
- 2025-07-15 Listed $65,000 MLS Technology, Inc.
- 2025-07-14 Listing Removed — MLS Technology, Inc.
- 2025-06-15 Price Changed $68,000 MLS Technology, Inc.
- 2025-05-01 Relisted — MLS Technology, Inc.
- 2025-04-24 Pending — MLS Technology, Inc.
- 2025-02-14 Listed $72,000 MLS Technology, Inc.
- 2006-05-26 Sold (Public Records) $8,000 Public Records
Property tax history
+12.4%/yrLatest (2025): $606 · +6.3% YoY. Source: county tax records.
Cash-flow waterfall
monthlySold comps — $/sqft
last 12 mo · ≤1 miLoading sold comps…