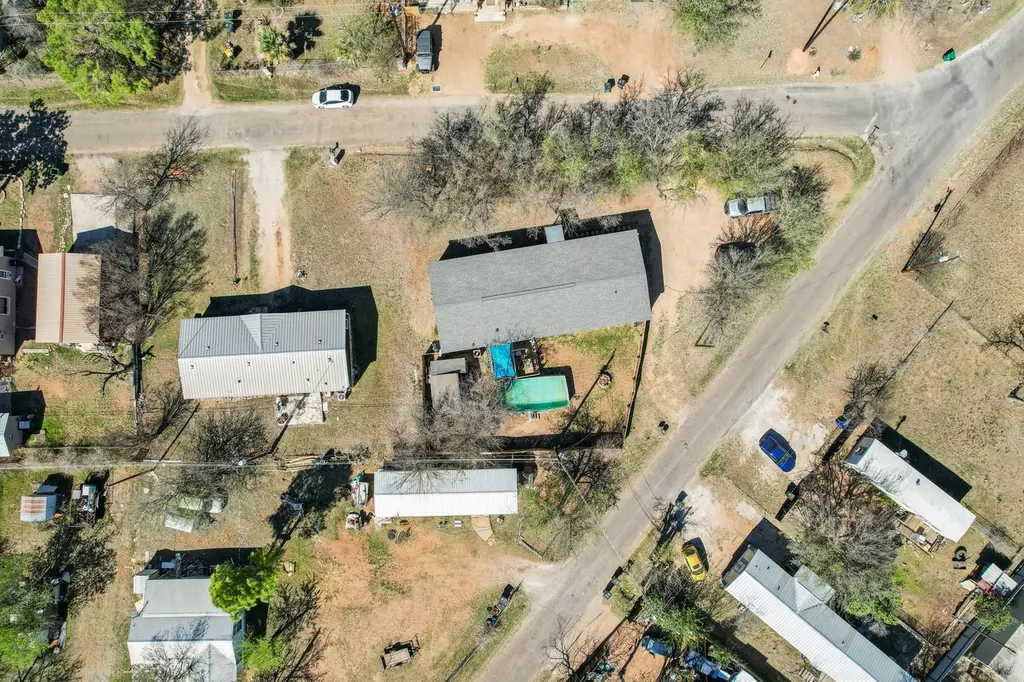
837 Southwood Dr · Cottonwood Shores, TX
Flood risk 1/10 · Minimal
- FEMA flood zone
- X (unshaded)
- Chance of flooding over 30 yrs
- 0.0%
- Est. flood insurance / yr
- $507 – $1,088
Fire risk 5/10 · Moderate
- Est. fire insurance / yr
- $1,222 – $2,270
Heat risk 8/10 · Major
- Hot days now (above 107°F)
- 7 days/yr
- Hot days in 30 yrs
- 23 days/yr
Wind risk 6/10 · Moderate
- Chance of severe wind over 30 yrs
- 65.0%
Air-quality risk 1/10 · Minimal
- Unhealthy air days now
- 0 days/yr
- Unhealthy air days in 30 yrs
- 0 days/yr
Risk factors via First Street. Map © Google.
Why this score? — see what drove the C+ grade
The composite is a weighted blend of 9 inputs, each scored 0–100. Each bar is that input's sub-score; the figure is the points it added to the 100-point composite (weight × sub-score).
- Cash flow +23.7/30.0
- DSCR +7.6/10.0
- ARV discount +7.5/15.0
- 1% rule +6.8/10.0
- Appreciation +5.5/10.0
- Livability +3.5/5.0
- Schools +3.0/10.0
- Rent growth +2.5/5.0
- Condition / age +2.5/5.0
$225,000
🖨 Deal sheet 📄 Offer letter ✓ Due diligence
Listing remarks
Welcome to Cottonwood Shores—where lake living meets exceptional value. This beautifully maintained 2019 Redman/Champion home offers over 2,300 square feet of living space with 4 oversized bedrooms, 2 full baths, two spacious living areas, a dedicated dining room, and an open-concept kitchen designed for everyday living and entertaining. Situated on an oversized corner lot, this move-in ready home features luxury vinyl flooring, abundant cabinetry and countertop space, large walk-in closets, and a private owner's retreat with garden tub. Step outside and enjoy your own backyard oasis complete with a covered patio, above-ground swimming pool, mature shade trees, fenced yard, and worksh
Key facts
- Oversized corner lot
- Backyard oasis
- Covered patio
Tags
Property features AI
Finance
- HOA & community: Community features: dog park, fishing, pet amenities, playground, park
Exterior
- Parking: Off-street outside parking; Parking for 6 vehicles; See remarks regarding parking
- Security: Security system; Closed-circuit cameras
- Utilities: Public water; Public sewer; Electricity connected; High-speed internet available; Cable available and connected
- Home design: Single-story home; Faces west; Permanent pillar/post/pier foundation; Resale property
- Construction: Built by Redman/Champion Homes; Cement and vinyl siding; Asbestos shingle roof
- Exterior features: Private yard with fire pit; Rear covered porch and deck; Porch; Exterior steps; Outbuilding(s) including shed(s) and workshop; Privacy wood fencing; Corner lot with many large trees; Level backyard
Interior
- Kitchen: Dishwasher; Electric range (free-standing); Range hood; Microwave; Disposal; Free-standing refrigerator; Kitchen island; Eat-in kitchen; Breakfast bar; Pantry
- Bedrooms: 4 main-level bedrooms
- Flooring: Wood flooring; Laminate flooring; Vinyl flooring
- Bathrooms: 2 full bathrooms; Double vanity in bath; Soaking tub
- Heating & cooling: Central heating (electric); Central air conditioning; Ceiling fans
- Interior features: Open floorplan with multiple living areas; Main level primary suite; Kitchen island and breakfast bar; Eat-in kitchen with pantry; Built-in features; Recessed lighting; Ceiling fan(s); Double vanity; Soaking tub; Walk-in closet(s); Laminate counters; Smart home; Window coverings; Double pane vinyl windows
- Laundry & utility: Inside laundry room; Washer hookup; Electric dryer hookup; Washer and dryer included; Dryer included
Neighborhood map
What this means for you Summary
Snapshot
- This is a 4-bed/2.0-bath manufactured listed at $225k.
Deal economics
- At list price, monthly cash flow is $430 ($5k/yr) — positive.
- The deal already cash-flows at list — no discount required.
- Meets the 1% rule at list price ($3k rent vs $225k).
- Cap rate 8.6% vs local median 4.2% in Cottonwood Shores — top-decile yield for the area; either an underpriced asset or a hidden risk that comps aren't pricing in. Stress-test before assuming the spread holds.
Location & tenants
- Location reads 70/100 on livability (#385 in TX) — a middle-class / working-renter tenant base. Strengths: crime A+, cost of living A+, housing A+; Watch: schools F, amenities F, commute F.
- Marble Falls ISD (town): math 32% / reading 38% proficiency, ranked #511 of 826 in TX (top 62%) — families likely to look elsewhere, expect single-tenant / working-renter base with shorter leases.
- Market conditions: 1223 active listings in the ZIP; 4 comparable units currently listed for rent nearby; rentals at typical pace (median 15d on market — plan ~3-4 weeks tenant-placement turnaround); solid renter incomes; 891 units permitted in Burnet County in 2024 (76 in 5+ unit buildings).
- This rent runs 35% of the median local income ($91k/yr) — at the standard rent-burdened threshold; future hikes will face affordability resistance.
Forward outlook
- In year one you build about $4k of equity ($2k loan paydown + $2k appreciation (0.9% local appreciation)).
- Burnet County population projected at +22% by 2050 — long-run rental-demand tailwind backs the buy-and-hold thesis.
- At projected returns (0.9% appreciation + 3.0% rent growth), your $63k cash investment doubles in ~6 years — after that, you're playing with house money.
- By year 9, paydown + projected appreciation supports a ~$34k cash-out refi (75% LTV) — recoverable capital for the next deal without selling this one.
Negotiation context
- Only 6 days on market — expect competitive offers; lowballing is unlikely to land.
- 3 sale attempts with the ask held roughly flat each time — persistent listings suggest the price (not the market) is what's stuck; bring a comps-based counter.
Risks & watch-outs
- Climate carrying-cost: major wind risk, 65% chance of damaging wind over 30y; moderate wildfire risk; extreme-heat days projected 7→23/yr by 2055 (HVAC capex compounding) — expect insurance premiums to compound above CPI over the hold.
Questions for the listing agent
- Is there a deadline driving the sale (1031 exchange, divorce, estate, relocation)? That informs how much negotiation room exists.
- Schools are F-rated, which usually means shorter tenancies and higher turnover. Who's the typical renter profile here, and what's been the actual vacancy rate?
- What's the average days-on-market for RENTAL listings here right now (not sales)? A rising rental-DOM trend means longer vacancies and softer asking-rent achievability than the comps imply.
- What's the recent tenant-quality profile in this submarket — average credit score on applications, eviction rate, late-payment / NSF rate, and stable-employment percentage? A property-management company in the area should have these aggregated.
- How much new for-sale + rental construction is in the pipeline within 1–3 miles? Heavy new supply typically softens prices + rents 12–24 months out; constrained supply supports both.
Investment metrics
- 1% rule
- 1.18% ✓
- Cap rate
- 8.58%
- Cash-on-cash
- 8.18%
- DSCR
- 1.36
- GRM
- 7.1
CMA / ARV
No comps found within radius.
Projected returns pro-forma
0.95% appreciation · 3.0% rent growth · sell at horizon
- IRR
- 9.7%
- Equity multiple
- 1.49×
- Total profit
- $31,083
- Equity at exit
- $76,172
- IRR
- 13.7%
- Equity multiple
- 2.65×
- Total profit
- $104,264
- Equity at exit
- $100,733
Cash invested: $63,000 (down + closing). Projections, not guarantees.
Landlord ↔ Tenant lean methodology
- Overall (STATE)
- 87 Strongly Landlord-Friendly
- State Texas
- 87 Strongly Landlord-Friendly · R+5
- County
- — inherits STATE
- City
- — inherits STATE
ZIP-level market 78657
- Home prices YoY
- 0.4%
- Active inventory
- 1223
- Price-to-rent
- 7.1×
Monthly cashflow live
- Estimated rent
- $2,654 medium interval (Pro) →
- Mortgage (P&I)
- −$1,180
- Tax from tax record
- −$394 /mo · $4,723/yr
- Insurance
- −$94
- HOA
- −$0
- Vacancy / Maint / Mgmt
- −$557
- Net cashflow
- $430
Break-even live
UW: 25.0% down · 7.5% · 30yr · 1.5% tax · 5.0% vac · 8.0% maint · 8.0% mgmt
Financing live
Cash to close
- Down payment
- $56,250
- Closing costs
- $6,750
- Reserves months
- —
- Total cash needed
- —
Loan-product check · same deal, 3 products live
Conventional
25% down · 7.5% · 30yr
- Down + closing
- —
- Monthly P&I
- —
- Monthly cashflow
- —
- DSCR
- —
- Eligible?
- —
Personal DTI + credit; lowest rate.
DSCR
20% down · 8.5% · 30yr
- Down + closing
- —
- Monthly P&I
- —
- Monthly cashflow
- —
- DSCR
- —
- Eligible?
- —
No personal income docs; deal must DSCR.
Hard money
10% down · 12.0% · 12mo
- Down + closing
- —
- Monthly P&I
- —
- Monthly cashflow
- —
- DSCR
- —
- Eligible?
- —
Short-term bridge; refi at stabilization.
Rent comps 4 comps
| Address | Beds | Baths | Sqft | Rent | $/sqft | DOM | Units | Dist |
|---|---|---|---|---|---|---|---|---|
| 342 Columbine St Meadowlakes, TX | 3.0 | 2.0 | 1786 | $2,195 | $1.23 | 4d | 1 | 1.05mi |
| 435 Saint Andrews St Meadowlakes, TX | 3.0 | 2.0 | 2066 | $2,500 | $1.21 | 44d | 1 | 1.35mi |
| 148 Nelson Pl Meadowlakes, TX | 4.0 | 3.0 | 2215 | $3,100 | $1.40 | 15d | 1 | 1.40mi |
| 125 Dove Ln Meadowlakes, TX | 3.0 | 2.0 | 1740 | $2,300 | $1.32 | 4d | 1 | 1.48mi |
Listing history 6 events
-
2026-06-18days on market $225,000 Active 6 DOM
-
2026-06-17days on market $225,000 Active 5 DOM
-
2026-06-16days on market $225,000 Active 4 DOM
-
2026-06-15days on market $225,000 Active 3 DOM
-
2026-06-13remarks 693-char remark
-
2026-06-13$225,000 Active 1 DOM
ⓘ Source: listings_history table (triggers on properties + properties_extension) + one-shot
backfill from property_details.listing_events for pre-trigger history.
Tax reassessment forecast TX · Resets to sale price
- Current annual tax
- $4,723 · $394/mo
- Projected year-2 tax
- $4,723 · $394/mo
- Expected delta
- $0/yr ($0/mo · 0.0%)
ⓘ Screening estimate from a state-policy table — verify with the county assessor before closing.
Climate risk First Street
- Flood 1/10 Low FEMA zone X (unshaded) · 0% chance over 30 yrs
- Wildfire 5/10 Major
- Heat 8/10 Severe 7 d/yr ≥107°F today · 23 d/yr by 30 yrs out
- Wind 6/10 Major 65% chance of damaging wind over 30 yrs
- Air quality 1/10 Low 0 unhealthy d/yr today · 0 by 30 yrs out
Nearby sold comps map
Loading sold comps map…
Walkable amenities ~0.75 mi
Loading nearby amenities…
Taxation est. · year 1
- Rental income
- $31,852
- − Mortgage interest
- −$12,603
- − Property taxes
- −$4,723
- − Insurance
- −$1,125
- − Repairs & maintenance
- −$2,548
- − Management
- −$2,548
- − Depreciation
- −$6,545
- Taxable income
- $1,759
- Est. tax owed @ 24.0%
- −$422
- After-tax cash flow
- $4,734/yr
For passive investors: Depreciation is non-cash, so a rental often shows a tax loss while cash-flowing — sheltering income. Rental losses are passive: they offset passive income freely, and up to $25,000/yr can offset ordinary (W-2) income if you actively participate and your MAGI is under $100k (phasing out to $0 by $150k); unused losses carry forward. On sale, claimed depreciation is recaptured at up to 25%, and gains may owe capital-gains tax (a 1031 exchange can defer both). Figures are a year-1 estimate at your 24.0% rate — not tax advice; consult a CPA.
Schools (NCES district)
- District
- Marble Falls ISD
- NCES district ID
- 4829010
- Math proficiency
- 32% ▼ -8.00%
- Reading proficiency
- 38% ▼ -4.00%
- Median HH income
- $49,663
- Composite
- 30.3/100
- National rank
- #6278
- State rank
- #511 of 826 in TX
Livability — Cottonwood Shores
- Score
- 70/100
- State rank
- #385
- US rank
- #8036
Category grades
Schools grade is shown separately in the Schools card above.
Census & demographics
- Census place
- Cottonwood Shores, TX
- County
- Llano County · 16,310 people
- Metro
- nan
- Population (ZIP)
- 7,591
- Household income
- $91,452
- Rent vs Own
- Severe rent burden
- 45.0
Population outlook (Burnet County) Hauer SSP2
- Today (2025)
- 50,492 people
- By 2030
- 52,995 · +5.0%
- By 2040
- 57,528 · +13.9%
- By 2050
- 61,444 · +21.7%
- By 2075
- 71,098 · +40.8%
- By 2100
- 74,634 · +47.8%
Race, ethnicity, and origin ACS 2023
- Neighborhood character
- Predominantly White (80%)
- Race & ethnicity
- White 80% Hispanic / Latino 16% Two or more races 8% Asian 1%
- Hispanic origin (detail)
- Mexican 14%
- Common ancestry
- Slovak 3% Portuguese 3% Italian 2%
- Foreign-born
- 8% · Canada
- Languages at home
- 87% English-only · Spanish 12% Other Indo-European 1%
Political lean MEDSL · Burnet
- 2024 margin
- Solid R (+55.7) · D 21.7% · R 77.4%
- 2008→2024 swing
- -11.6pp toward R · 2008: -44.1pp · 2024: -55.7pp
- All cycles
- 2024: R+55.7 2020: R+53.1 2016: R+56.8 2012: R+54.6 2008: R+44.1
Not yet ingested
- Civics
- —
Market trends
- HPI YoY
- ▲ 0.95%
- Current HPI
- 229.9918
- Rent YoY
- —
- Metro
- nan
- State GDP YoY
- ▲ 3.95%
- F500 in state
- 110
Industry mix (Fortune 500 HQ in TX)
| Industry | F500 HQs | Revenue |
|---|---|---|
| Energy | 16 | $1,198B |
|
||
| Technology | 5 | $198B |
|
||
| Engineering / Construction | 4 | $72B |
|
||
| Energy Services | 3 | $60B |
|
||
| Utilities | 3 | $41B |
|
||
| Healthcare | 2 | $330B |
|
||
Price history
5 events — show timeline
- 2026-06-12 Listed $225,000 Unlock MLS
- 2025-07-09 Price Changed — Unlock MLS
- 2025-07-09 Relisted — Unlock MLS
- 2025-04-24 Price Changed — Unlock MLS
- 2025-03-24 Listed — Unlock MLS
Property tax history
+44.7%/yrLatest (2026): $4,723 · +10.0% YoY. Source: county tax records.
Cash-flow waterfall
monthlySold comps — $/sqft
last 12 mo · ≤1 miLoading sold comps…