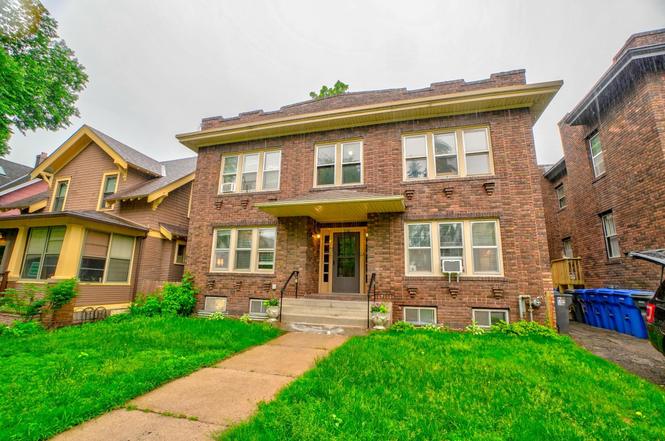
 Fourplex
1088 Dayton Ave · St. Paul, MN
Flood risk 3/10 · Minor
- FEMA flood zone
- X (unshaded)
- Chance of flooding over 30 yrs
- 0.2%
- Est. flood insurance / yr
- $473 – $860
Fire risk 1/10 · Minimal
- Est. fire insurance / yr
- $888 – $1,650
Heat risk 2/10 · Minimal
- Hot days now (above 99°F)
- 7 days/yr
- Hot days in 30 yrs
- 14 days/yr
Wind risk 2/10 · Minimal
- Chance of severe wind over 30 yrs
- —
Air-quality risk 2/10 · Minimal
- Unhealthy air days now
- 1 days/yr
- Unhealthy air days in 30 yrs
- 1 days/yr
Risk factors via First Street. Map © Google.
Why this score? — see what drove the B- grade
The composite is a weighted blend of 9 inputs, each scored 0–100. Each bar is that input's sub-score; the figure is the points it added to the 100-point composite (weight × sub-score).
- Cash flow +30.0/30.0
- 1% rule +10.0/10.0
- DSCR +10.0/10.0
- ARV discount +7.5/15.0
- Rent growth +3.1/5.0
- Livability +2.5/5.0
- Condition / age +2.5/5.0
- Schools +2.4/10.0
- Appreciation +0.0/10.0
$499,900
🖨 Deal sheet 📄 Offer letter ✓ Due diligence
Multi-family units
County records classify this as Multi-Family (5+ Unit). Listing-text estimate: 4 units. estimate disagrees with records
5+ unit building — per-unit beds/baths from public records are typically unavailable; the breakdown below (if shown) is an estimate from the listing text.
Listing remarks MLS
Charming 1920s brick fourplex full of character, warmth, and timeless architectural detail. This classic investment property features four 1-bedroom, 1-bathroom units, each offering functional layouts with vintage charm throughout. From the moment you arrive, the beautiful brick exterior, covered entry, and original details set the tone for a property with lasting appeal. Inside, you?ll find natural woodwork, original trim, beautiful built-ins, hardwood floors in the upper-level units, classic radiators, and large windows that bring in great natural light. The living and dining spaces showcase the character buyers and tenants love in historic properties, while the kitchens and bathrooms offer practical everyday functionality. Ideally located near schools, parks, restaurants, shopping, and everyday conveniences, this fourplex is a great opportunity for an investor, owner-occupant, or anyone looking to add a solid multi-family property to their portfolio. With its charming 1920s craftsmanship, desirable location, and four separate one-bedroom units, this property offers both character and income potential.
Key facts
- Natural woodwork
- Brick fourplex
- Original trim
Tags
Property features AI
Finance
- Financial info: Property generates gross income of $17,247.50; Net operating income of $7,721.60; Owner pays gas, grounds care, repairs, sewer, snow removal, and water; Tenant pays electricity; Reported expenses: Electric $3,576.15; Maintenance $1,047.25; Manager $275; Trash $339.56
- HOA & community: Coin-op laundry owned
Exterior
- Parking: On-street parking only
- Utilities: City water connected; City sewer connected; Electric with circuit breakers; Natural gas
- Home design: Residential income property; Two levels; Not owner-occupied
- Construction: Brick and stone construction; Shingle roof (over 8 years old); Other foundation
- Exterior features: Stone exterior accents; Light tree coverage on lot; City street frontage, public maintained road
Interior
- Kitchen: Units include range and refrigerator
- Bedrooms: Four total bedrooms; Each unit is a 1-bedroom unit (4 units total)
- Bathrooms: Each unit has one full bathroom
- Heating & cooling: Boiler heating; No central cooling
- Interior features: Full, unfinished basement; Coin-op laundry owned (association amenity)
- Laundry & utility: Laundry located in basement; Coin-operated laundry on site
Neighborhood map
What this means for you Summary
Snapshot
- This is a 4 × 4-bed/4.0-bath units multifamily listed at $500k.
Deal economics
- At list price, monthly cash flow is $6k ($78k/yr) — positive. Per door: $2k/mo.
- The deal already cash-flows at list — no discount required.
- Meets the 1% rule at list price ($13k rent vs $500k).
Location & tenants
- Location reads: area grade B — affects rentability + tenant quality, not the cash-flow math above.
- St. Paul Public School District (urban): math 21% / reading 33% proficiency, ranked #270 of 301 in MN (top 90%) — low school quality limits family demand, transient renter base, plan for 1-2y turnover; 64% free/reduced lunch — lower-income household profile, screen leases tightly.
- Market conditions: Rents rising (+2.5%/yr); 191 active listings in the ZIP; solid renter incomes; 1,202 units permitted in Ramsey County in 2024 (880 in 5+ unit buildings).
- At $12,746/mo this rent would consume 202% of the median local household income ($76k/yr) (locally 2116% of renters already pay >50% of income on rent) — very limited rent-growth headroom before tenants either downsize or default.
Forward outlook
- Local home prices are declining (-3.0%/yr); year-one equity from $3k of loan paydown is wiped out by about $15k of value loss. Plan a longer hold.
- Ramsey County population projected at +27% by 2050 — long-run rental-demand tailwind backs the buy-and-hold thesis.
- At projected returns (-3.0% appreciation + 2.5% rent growth), your $140k cash investment doubles in ~3 years — after that, you're playing with house money.
Negotiation context
- Only 3 days on market — expect competitive offers; lowballing is unlikely to land.
- 9 sale attempts since 22y ago with the ask held roughly flat each time — persistent listings suggest the price (not the market) is what's stuck; bring a comps-based counter.
- Current owner paid $325k; list at $500k implies a 54% gain — meaningful room to come down on a strong offer.
Risks & watch-outs
- Watch-outs: built in 1922 — expect roof / HVAC / electrical / plumbing capex.
Questions for the listing agent
- Can we see the unit-by-unit rent roll, current vacancy, and any below-market leases? What's the average tenancy length?
- What capital expenditures (roof, boiler, parking lot, exteriors) have been made in the last 5 years, and what's planned in the next 2?
- Built in 1922 — when were the roof, HVAC, electrical panel, plumbing, and water heater last replaced?
- Is there a deadline driving the sale (1031 exchange, divorce, estate, relocation)? That informs how much negotiation room exists.
- What's the average days-on-market for RENTAL listings here right now (not sales)? A rising rental-DOM trend means longer vacancies and softer asking-rent achievability than the comps imply.
- What's the recent tenant-quality profile in this submarket — average credit score on applications, eviction rate, late-payment / NSF rate, and stable-employment percentage? A property-management company in the area should have these aggregated.
- How much new apartment / multifamily construction is in the pipeline within 1–3 miles? Heavy new supply (>2% of stock underway) typically softens rents 12–24 months out; light construction supports rent growth.
Investment metrics
- 1% rule
- 2.55% ✓
- Cap rate
- 21.83%
- Cash-on-cash
- 55.50%
- DSCR
- 3.47
- GRM
- 3.3
CMA / ARV
No comps found within radius.
Projected returns pro-forma
-3.0% appreciation · 2.5% rent growth · sell at horizon
- IRR
- 53.2%
- Equity multiple
- 3.32×
- Total profit
- $325,195
- Equity at exit
- $74,537
- IRR
- 58.3%
- Equity multiple
- 6.64×
- Total profit
- $789,292
- Equity at exit
- $43,222
Cash invested: $139,972 (down + closing). Projections, not guarantees.
Landlord ↔ Tenant lean methodology
- Overall (STATE)
- 46 Balanced
- State Minnesota
- 46 Balanced · D+2
- County
- — inherits STATE
- City
- — inherits STATE
ZIP-level market 55104
- Rents YoY
- 2.5%
- Active inventory
- 191
- Price-to-rent
- 13.1×
Monthly cashflow live
- Estimated rent
- $12,746 medium interval (Pro) →
- Mortgage (P&I)
- −$2,622
- Tax from tax record
- −$766 /mo · $9,192/yr
- Insurance
- −$208
- HOA
- −$0
- Vacancy / Maint / Mgmt
- −$2,677
- Net cashflow
- $6,474
Break-even live
4-unit breakdown (identical units grouped — click to expand)
| Units | Beds | Baths | Est. rent |
|---|---|---|---|
| 4× units | 4 | 4 | $12,748 |
| #1 | 4 | 4 | $3,187 |
| #2 | 4 | 4 | $3,187 |
| #3 | 4 | 4 | $3,187 |
| #4 | 4 | 4 | $3,187 |
| Total (4 units) | $12,746 | ||
UW: 25.0% down · 7.5% · 30yr · 1.5% tax · 5.0% vac · 8.0% maint · 8.0% mgmt
Financing live
Cash to close
- Down payment
- $124,975
- Closing costs
- $14,997
- Reserves months
- —
- Total cash needed
- —
Loan-product check · same deal, 3 products live
Conventional
25% down · 7.5% · 30yr
- Down + closing
- —
- Monthly P&I
- —
- Monthly cashflow
- —
- DSCR
- —
- Eligible?
- —
Personal DTI + credit; lowest rate.
DSCR
20% down · 8.5% · 30yr
- Down + closing
- —
- Monthly P&I
- —
- Monthly cashflow
- —
- DSCR
- —
- Eligible?
- —
No personal income docs; deal must DSCR.
Hard money
10% down · 12.0% · 12mo
- Down + closing
- —
- Monthly P&I
- —
- Monthly cashflow
- —
- DSCR
- —
- Eligible?
- —
Short-term bridge; refi at stabilization.
Listing history 4 events
-
2026-06-18days on market $499,900 Active 3 DOM
-
2026-06-17days on market $499,900 Active 2 DOM
-
2026-06-15remarks 693-char remark
-
2026-06-15$499,900 Active 1 DOM
ⓘ Source: listings_history table (triggers on properties + properties_extension) + one-shot
backfill from property_details.listing_events for pre-trigger history.
Tax reassessment forecast MN · Partial reset (capped growth)
- Current annual tax
- $9,192 · $766/mo
- Projected year-2 tax
- $9,192 · $766/mo
- Expected delta
- $0/yr ($0/mo · 0.0%)
ⓘ Screening estimate from a state-policy table — verify with the county assessor before closing.
Climate risk First Street
- Flood 3/10 Moderate FEMA zone X (unshaded) · 20% chance over 30 yrs
- Wildfire 1/10 Low
- Heat 2/10 Low 7 d/yr ≥99°F today · 14 d/yr by 30 yrs out
- Wind 2/10 Low
- Air quality 2/10 Low 1 unhealthy d/yr today · 1 by 30 yrs out
Nearby sold comps map
Loading sold comps map…
Walkable amenities ~0.75 mi
Loading nearby amenities…
Taxation est. · year 1
- Rental income
- $152,952
- − Mortgage interest
- −$28,002
- − Property taxes
- −$9,192
- − Insurance
- −$2,500
- − Repairs & maintenance
- −$12,236
- − Management
- −$12,236
- − Depreciation
- −$14,543
- Taxable income
- $74,243
- Est. tax owed @ 24.0%
- −$17,818
- After-tax cash flow
- $59,864/yr
For passive investors: Depreciation is non-cash, so a rental often shows a tax loss while cash-flowing — sheltering income. Rental losses are passive: they offset passive income freely, and up to $25,000/yr can offset ordinary (W-2) income if you actively participate and your MAGI is under $100k (phasing out to $0 by $150k); unused losses carry forward. On sale, claimed depreciation is recaptured at up to 25%, and gains may owe capital-gains tax (a 1031 exchange can defer both). Figures are a year-1 estimate at your 24.0% rate — not tax advice; consult a CPA.
Schools (NCES district)
- District
- St. Paul Public School District
- NCES district ID
- 2733840
- Math proficiency
- 21% ▼ -11.00%
- Reading proficiency
- 33% ▼ -7.00%
- Median HH income
- $48,316
- Composite
- 23.51/100
- National rank
- #7868
- State rank
- #270 of 301 in MN
Livability — St. Paul
No livability data for this city. (Only ~50 U.S. cities are tracked.)
Census & demographics
- Census place
- St. Paul, MN
- County
- Ramsey County · 542,837 people
- City population
- 280,599
- Metro
- Minneapolis-St. Paul-Bloomington, MN-WI
- Population (ZIP)
- 45,762
- Household income
- $75,712
- Rent vs Own
- Severe rent burden
- 2116.0
Population outlook (Ramsey County) Hauer SSP2
- Today (2025)
- 603,431 people
- By 2030
- 636,459 · +5.5%
- By 2040
- 700,596 · +16.1%
- By 2050
- 765,819 · +26.9%
- By 2075
- 929,297 · +54.0%
- By 2100
- 1,053,924 · +74.7%
Race, ethnicity, and origin ACS 2023
- Neighborhood character
- Diverse neighborhood (Simpson 0.60)
- Race & ethnicity
- White 60% Black 19% Two or more races 10% Asian 7% Hispanic / Latino 7%
- Hispanic origin (detail)
- Mexican 4%
- Common ancestry
- Portuguese 8% Romanian 3% Lithuanian 3%
- Foreign-born
- 12% · Canada, Vietnam, China
- Languages at home
- 83% English-only · Spanish 4% Other Asian/Pacific 4% French/Haitian/Cajun 1%
Political lean MEDSL · Ramsey
- 2024 margin
- Solid D (+43.3) · D 70.5% · R 27.2% · Other 2.3%
- 2008→2024 swing
- +9.4pp toward D · 2008: 33.9pp · 2024: 43.3pp
- All cycles
- 2024: D+43.3 2020: D+45.4 2016: D+39.4 2012: D+35.3 2008: D+33.9
Not yet ingested
- Civics
- —
Market trends
- HPI YoY
- ▼ -532.26%
- Current HPI
- 245.6146
- Rent YoY
- ▲ 2.50%
- Metro
- Minneapolis-St. Paul-Bloomington, MN-WI
- State GDP YoY
- ▲ 2.41%
- F500 in state
- 34
Industry mix (Fortune 500 HQ in MN)
| Industry | F500 HQs | Revenue |
|---|---|---|
| Healthcare | 2 | $407B |
|
||
| Retail | 2 | $150B |
|
||
| Consumer Goods | 2 | $32B |
|
||
| Industrial Machinery | 2 | $6B |
|
||
| Agriculture | 1 | $40B |
|
||
| Healthcare / Medical Devices | 1 | $32B |
|
||
Price history
+46.8% since first listed18 events — show timeline
- 2026-06-13 Listed $499,900 NORTHSTARMLS as Distributed by MLS Grid
- 2026-06-13 Listed $499,900 WWRA
- 2023-01-05 Listing Removed — NORTHSTARMLS as Distributed by MLS Grid
- 2022-10-21 Listed $648,500 NORTHSTARMLS as Distributed by MLS Grid
- 2009-09-30 Sold (MLS) $325,000 NORTHSTARMLS as Distributed by MLS Grid
- 2009-09-10 Listing Removed — NORTHSTARMLS as Distributed by MLS Grid
- 2009-01-29 Listed $345,000 NORTHSTARMLS as Distributed by MLS Grid
- 2009-01-28 Listing Removed — NORTHSTARMLS as Distributed by MLS Grid
- 2008-08-07 Listed $350,000 NORTHSTARMLS as Distributed by MLS Grid
- 2008-04-30 Listing Removed — NORTHSTARMLS as Distributed by MLS Grid
- 2008-01-09 Listing Removed — NORTHSTARMLS as Distributed by MLS Grid
- 2008-01-09 Listed $366,900 NORTHSTARMLS as Distributed by MLS Grid
- 2007-04-20 Listed $369,900 NORTHSTARMLS as Distributed by MLS Grid
- 2007-04-11 Listing Removed — NORTHSTARMLS as Distributed by MLS Grid
- 2007-01-03 Listed $409,900 NORTHSTARMLS as Distributed by MLS Grid
- 2004-09-24 Sold (MLS) $340,500 NORTHSTARMLS as Distributed by MLS Grid
- 2004-08-27 Listing Removed — NORTHSTARMLS as Distributed by MLS Grid
- 2004-06-25 Listed $340,500 NORTHSTARMLS as Distributed by MLS Grid
Property tax history
+2.9%/yrLatest (2025): $9,192 · +0.8% YoY. Source: county tax records.
Cash-flow waterfall
monthlySold comps — $/sqft
last 12 mo · ≤1 miLoading sold comps…