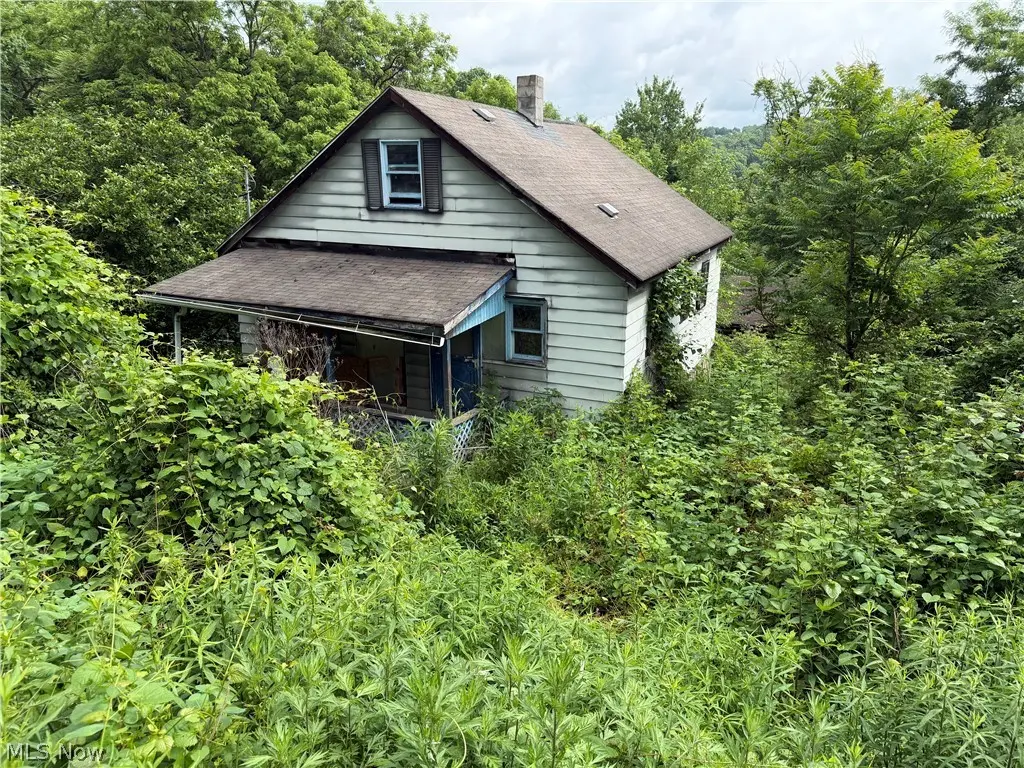
1332 Sunnyside St · East Liverpool, OH
Flood risk 1/10 · Minimal
- FEMA flood zone
- X (unshaded)
- Chance of flooding over 30 yrs
- 0.0%
- Est. flood insurance / yr
- $473 – $860
Fire risk 2/10 · Minimal
- Est. fire insurance / yr
- $713 – $1,323
Heat risk 3/10 · Minor
- Hot days now (above 97°F)
- 7 days/yr
- Hot days in 30 yrs
- 17 days/yr
Wind risk 1/10 · Minimal
- Chance of severe wind over 30 yrs
- —
Air-quality risk 2/10 · Minimal
- Unhealthy air days now
- 1 days/yr
- Unhealthy air days in 30 yrs
- 2 days/yr
Risk factors via First Street. Map © Google.
Why this score? — see what drove the B- grade
The composite is a weighted blend of 9 inputs, each scored 0–100. Each bar is that input's sub-score; the figure is the points it added to the 100-point composite (weight × sub-score).
- Cash flow +30.0/30.0
- 1% rule +10.0/10.0
- DSCR +10.0/10.0
- ARV discount +7.5/15.0
- Livability +3.4/5.0
- Schools +2.7/10.0
- Rent growth +2.5/5.0
- Condition / age +2.5/5.0
- Appreciation +0.0/10.0
$24,500
🖨 Deal sheet 📄 Offer letter ✓ Due diligence
Listing remarks
Bank-owned ranch home in Pleasant Heights offering approximately 700 square feet of living space with 2 bedrooms, 1 bathroom, and a covered front porch. This property is ready for its next owner to bring their vision and improvements. Ideal for investors, flippers, or buyers looking for a renovation project. Convenient location with strong potential for value-add opportunities. Property is being sold as-is.
Key facts
- Covered front porch
- Convenient location
- 3,201 sq ft lot
Tags
Property features AI
Finance
- Other:
- Financial info:
- HOA & community:
Exterior
- Parking: Attached or detached 1-car garage; On-street parking available
- Security:
- Utilities: Public water
- Home design: Single-story home; Frame construction with wood siding; Shingle roof; Above-grade finished area approximately 700
- Construction: Built according to public records; Frame construction; Wood siding; Shingle roof
- Exterior features: Small lot (approximately 0.0735 acres)
Interior
- Kitchen:
- Bedrooms: 2 main-level bedrooms
- Flooring:
- Bathrooms: 1 full bathroom (main level)
- Heating & cooling:
- Interior features: Full basement; Property listed as fixer condition
- Laundry & utility:
Neighborhood map
What this means for you Summary
Snapshot
- This is a 2-bed/1.0-bath single-family listed at $24k.
Deal economics
- At list price, monthly cash flow is $396 ($5k/yr) — positive.
- The deal already cash-flows at list — no discount required.
- Meets the 1% rule at list price ($797 rent vs $24k).
- Cap rate 25.7% vs local median 9.8% in East Liverpool — top-decile yield for the area; either an underpriced asset or a hidden risk that comps aren't pricing in. Stress-test before assuming the spread holds.
Location & tenants
- Location reads 67/100 on livability (#613 in OH) — a middle-class / working-renter tenant base. Strengths: cost of living A+, housing A+, health & safety A+; Watch: amenities F, commute F, employment F.
- East Liverpool City (town): math 28% / reading 37% proficiency, ranked #571 of 656 in OH (top 87%) — families likely to look elsewhere, expect single-tenant / working-renter base with shorter leases; 78% free/reduced lunch — lower-income household profile, screen leases tightly.
- Market conditions: 114 active listings in the ZIP; 49 units permitted in Columbiana County in 2024 (0 in 5+ unit buildings).
Forward outlook
- Local home prices are declining (-3.0%/yr); year-one equity from $169 of loan paydown is wiped out by about $735 of value loss. Plan a longer hold.
- Columbiana County population projected at -23% by 2050 — secular population decline; favor cash flow + early exit over multi-decade hold.
- At projected returns (-3.0% appreciation + 3.0% rent growth), your $7k cash investment doubles in ~2 years — after that, you're playing with house money.
Negotiation context
- Only 6 days on market — expect competitive offers; lowballing is unlikely to land.
- 3 sale attempts with the ask held roughly flat each time — persistent listings suggest the price (not the market) is what's stuck; bring a comps-based counter.
Risks & watch-outs
- Watch-outs: property tax is 4.7% of price; built in 1950 — expect roof / HVAC / electrical / plumbing capex.
Questions for the listing agent
- Built in 1950 — when were the roof, HVAC, electrical panel, plumbing, and water heater last replaced?
- Property tax is high relative to price — has the assessment been appealed recently, and will the sale trigger a re-assessment?
- Is there a deadline driving the sale (1031 exchange, divorce, estate, relocation)? That informs how much negotiation room exists.
- What's the average days-on-market for RENTAL listings here right now (not sales)? A rising rental-DOM trend means longer vacancies and softer asking-rent achievability than the comps imply.
- What's the recent tenant-quality profile in this submarket — average credit score on applications, eviction rate, late-payment / NSF rate, and stable-employment percentage? A property-management company in the area should have these aggregated.
- How much new for-sale + rental construction is in the pipeline within 1–3 miles? Heavy new supply typically softens prices + rents 12–24 months out; constrained supply supports both.
Investment metrics
- 1% rule
- 3.25% ✓
- Cap rate
- 25.66%
- Cash-on-cash
- 69.19%
- DSCR
- 4.08
- GRM
- 2.6
CMA / ARV
- ARV (on-the-fly)
- $81,200
- Comps found
- 6
Show comp detail 6 sales within ~0.75 mi
| Address | Dist | Beds/Ba | Sqft | Sold | Price | $/sf | Match |
|---|---|---|---|---|---|---|---|
| 1365 Sunnyside St | 0.10mi | 2/1.0 | 672 (-4%) | 7mo | $65,000 | $97 | 82 |
| 1250 Northside St | 0.30mi | 2/1.0 | 742 (+6%) | 7mo | $108,000 | $146 | 70 |
| 300 Henry | 0.59mi | 2/1.0 | 709 (+1%) | 2mo | $66,500 | $94 | 69 |
| 1527 Wyoming Ave | 0.28mi | 2/1.0 | 648 (-7%) | 14mo | $75,000 | $116 | 63 |
| 813 Northside Ave | 0.20mi | 1/1.0 (-1) | 616 (-12%) | 17mo | $60,000 | $97 | 51 |
| 124 S Shadylane Dr | 0.63mi | 1/1.0 (-1) | 624 (-11%) | 21mo | $75,000 | $120 | 30 |
Match score weights: distance 35% · size 25% · config 20% · recency 20%. Top-matched comps best support the ARV.
Projected returns pro-forma
-3.0% appreciation · 3.0% rent growth · sell at horizon
- IRR
- 68.7%
- Equity multiple
- 4.10×
- Total profit
- $21,272
- Equity at exit
- $3,653
- IRR
- 72.9%
- Equity multiple
- 8.46×
- Total profit
- $51,170
- Equity at exit
- $2,118
Cash invested: $6,860 (down + closing). Projections, not guarantees.
Landlord ↔ Tenant lean methodology
- Overall (STATE)
- 73 Landlord-Friendly
- State Ohio
- 73 Landlord-Friendly · R+6
- County
- — inherits STATE
- City
- — inherits STATE
ZIP-level market 43920
- Home prices YoY
- -29.3%
- Active inventory
- 114
- Price-to-rent
- 2.6×
Monthly cashflow live
- Estimated rent
- $797 medium interval (Pro) →
- Mortgage (P&I)
- −$128
- Tax from tax record
- −$95 /mo · $1,142/yr
- Insurance
- −$10
- HOA
- −$0
- Vacancy / Maint / Mgmt
- −$167
- Net cashflow
- $396
Break-even live
UW: 25.0% down · 7.5% · 30yr · 1.5% tax · 5.0% vac · 8.0% maint · 8.0% mgmt
Financing live
Cash to close
- Down payment
- $6,125
- Closing costs
- $735
- Reserves months
- —
- Total cash needed
- —
Loan-product check · same deal, 3 products live
Conventional
25% down · 7.5% · 30yr
- Down + closing
- —
- Monthly P&I
- —
- Monthly cashflow
- —
- DSCR
- —
- Eligible?
- —
Personal DTI + credit; lowest rate.
DSCR
20% down · 8.5% · 30yr
- Down + closing
- —
- Monthly P&I
- —
- Monthly cashflow
- —
- DSCR
- —
- Eligible?
- —
No personal income docs; deal must DSCR.
Hard money
10% down · 12.0% · 12mo
- Down + closing
- —
- Monthly P&I
- —
- Monthly cashflow
- —
- DSCR
- —
- Eligible?
- —
Short-term bridge; refi at stabilization.
Listing history 6 events
-
2026-06-18days on market $24,500 Active 6 DOM
-
2026-06-17days on market $24,500 Active 5 DOM
-
2026-06-16days on market $24,500 Active 4 DOM
-
2026-06-15days on market $24,500 Active 3 DOM
-
2026-06-13remarks 410-char remark
-
2026-06-13$24,500 Active 1 DOM
ⓘ Source: listings_history table (triggers on properties + properties_extension) + one-shot
backfill from property_details.listing_events for pre-trigger history.
Tax reassessment forecast OH · Partial reset (capped growth)
- Current annual tax
- $1,142 · $95/mo
- Projected year-2 tax
- $1,142 · $95/mo
- Expected delta
- $0/yr ($0/mo · 0.0%)
ⓘ Screening estimate from a state-policy table — verify with the county assessor before closing.
Climate risk First Street
- Flood 1/10 Low FEMA zone X (unshaded) · 0% chance over 30 yrs
- Wildfire 2/10 Low
- Heat 3/10 Moderate 7 d/yr ≥97°F today · 17 d/yr by 30 yrs out
- Wind 1/10 Low
- Air quality 2/10 Low 1 unhealthy d/yr today · 2 by 30 yrs out
Nearby sold comps map
Loading sold comps map…
Walkable amenities ~0.75 mi
Loading nearby amenities…
Taxation est. · year 1
- Rental income
- $9,560
- − Mortgage interest
- −$1,372
- − Property taxes
- −$1,142
- − Insurance
- −$122
- − Repairs & maintenance
- −$765
- − Management
- −$765
- − Depreciation
- −$713
- Taxable income
- $4,681
- Est. tax owed @ 24.0%
- −$1,123
- After-tax cash flow
- $3,623/yr
For passive investors: Depreciation is non-cash, so a rental often shows a tax loss while cash-flowing — sheltering income. Rental losses are passive: they offset passive income freely, and up to $25,000/yr can offset ordinary (W-2) income if you actively participate and your MAGI is under $100k (phasing out to $0 by $150k); unused losses carry forward. On sale, claimed depreciation is recaptured at up to 25%, and gains may owe capital-gains tax (a 1031 exchange can defer both). Figures are a year-1 estimate at your 24.0% rate — not tax advice; consult a CPA.
Schools (NCES district)
- District
- East Liverpool City
- NCES district ID
- 3904391
- Math proficiency
- 28% ▼ -16.00%
- Reading proficiency
- 37% ▼ -10.00%
- Median HH income
- $34,021
- Composite
- 26.72/100
- National rank
- #7148
- State rank
- #571 of 656 in OH
Livability — East Liverpool
- Score
- 67/100
- State rank
- #613
- US rank
- #10580
Category grades
Schools grade is shown separately in the Schools card above.
Census & demographics
- Census place
- East Liverpool, OH
- County
- Columbiana · 99,532 people
- Population (ZIP)
- 21,124
- Household income
- $50,820
- Rent vs Own
- Severe rent burden
- 12.6
Population outlook (Columbiana County) Hauer SSP2
- Today (2025)
- 98,353 people
- By 2030
- 94,225 · -4.2%
- By 2040
- 85,169 · -13.4%
- By 2050
- 76,157 · -22.6%
- By 2075
- 58,451 · -40.6%
- By 2100
- 42,805 · -56.5%
Race, ethnicity, and origin ACS 2023
- Neighborhood character
- Predominantly White (90%)
- Race & ethnicity
- White 90% Two or more races 6% Black 3% Hispanic / Latino 1%
- Common ancestry
- Romanian 2% Slovak 2% Serbian 2%
- Foreign-born
- 0%
Political lean MEDSL · Columbiana
- 2024 margin
- Solid R (+49.0) · D 25.1% · R 74.1%
- 2008→2024 swing
- -41.4pp toward R · 2008: -7.6pp · 2024: -49.0pp
- All cycles
- 2024: R+49.0 2020: R+44.9 2016: R+41.6 2012: R+12.0 2008: R+7.6
Not yet ingested
- Civics
- —
Market trends
- HPI YoY
- ▼ -81.53%
- Current HPI
- 196.3908
- Rent YoY
- —
- Metro
- —
- State GDP YoY
- ▲ 1.98%
- F500 in state
- 48
Industry mix (Fortune 500 HQ in OH)
| Industry | F500 HQs | Revenue |
|---|---|---|
| Insurance | 3 | $145B |
|
||
| Industrial Machinery | 3 | $49B |
|
||
| Financial Services | 3 | $24B |
|
||
| Consumer Goods | 2 | $93B |
|
||
| Aerospace / Defense | 2 | $47B |
|
||
| Utilities | 2 | $33B |
|
||
Price history
-56.0% since first listed9 events — show timeline
- 2026-06-12 Listed $24,500 MLSNOW
- 2026-04-28 Listing Removed — MLSNOW
- 2026-03-20 Price Changed $29,900 MLSNOW
- 2025-12-28 Listed $40,000 MLSNOW
- 2025-12-27 Listing Removed — MLSNOW
- 2025-11-21 Price Changed $32,200 MLSNOW
- 2025-08-07 Price Changed $36,700 MLSNOW
- 2025-07-25 Price Changed $41,700 MLSNOW
- 2025-06-27 Listed $55,700 MLSNOW
Property tax history
+1.1%/yrLatest (2025): $1,142 · +8.7% YoY. Source: county tax records.
Cash-flow waterfall
monthlySold comps — $/sqft
last 12 mo · ≤1 miLoading sold comps…