 Duplex
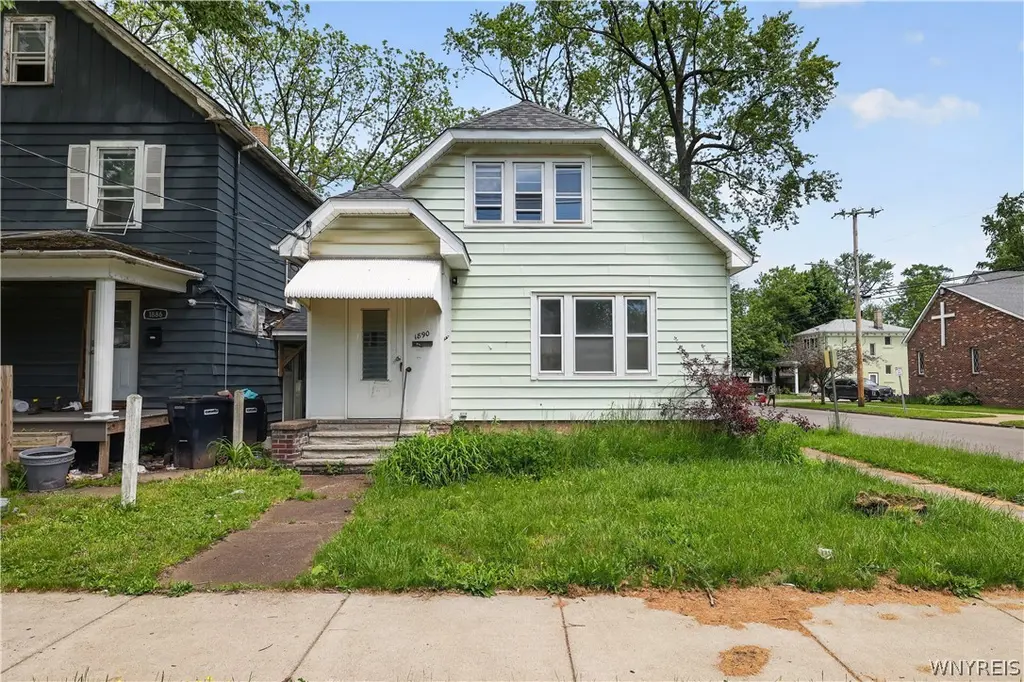
1890 Linwood Ave · Niagara Falls, NY
Flood risk 1/10 · Minimal
- FEMA flood zone
- X (unshaded)
- Chance of flooding over 30 yrs
- 0.0%
- Est. flood insurance / yr
- $473 – $860
Fire risk 3/10 · Minor
- Est. fire insurance / yr
- $691 – $1,283
Heat risk 2/10 · Minimal
- Hot days now (above 94°F)
- 7 days/yr
- Hot days in 30 yrs
- 15 days/yr
Wind risk 1/10 · Minimal
- Chance of severe wind over 30 yrs
- —
Air-quality risk 3/10 · Minor
- Unhealthy air days now
- 2 days/yr
- Unhealthy air days in 30 yrs
- 3 days/yr
Risk factors via First Street. Map © Google.
Why this score? — see what drove the B- grade
The composite is a weighted blend of 9 inputs, each scored 0–100. Each bar is that input's sub-score; the figure is the points it added to the 100-point composite (weight × sub-score).
- Cash flow +30.0/30.0
- 1% rule +10.0/10.0
- DSCR +10.0/10.0
- ARV discount +5.0/15.0
- Livability +3.0/5.0
- Rent growth +2.5/5.0
- Schools +2.5/10.0
- Condition / age +2.5/5.0
- Appreciation +0.0/10.0
$114,000
🖨 Deal sheet (PDF) 📄 Offer letter ✓ Due diligence
Multi-family units
County records classify this as Multi-Family (2-4 Unit). Listing-text estimate: 2 units. confirmed
Listing remarks
Flexible duplex property in the City of Niagara Falls offering two separate units and practical systems already in place – with income potential and opportunity built in. The lower unit provides a spacious 3-bedroom, 2-bath layout with hardwood floors, defined living and dining areas, and original character details. The upper unit adds a bright 2-bedroom, 1-bath setup, giving the property built-in flexibility for rental income, shared ownership, or portfolio growth. At 1890 Linwood Ave, the full basement supports easier property management with two furnaces, two hot water tanks, two electric panels, two gas meters, one water meter, and separate laundry hookups. The 2,160 sq ft layout
Key facts
- Income potential
- Two separate units
- Duplex property
Tags
Property features AI
Finance
- Other: Two total residential units; Separate gas and electric meters for each unit
- Financial info: Owner pays water; water included in rent; Operating expenses: see remarks
Exterior
- Parking: Concrete, gravel and paved surfaces; Two or more parking spaces
- Utilities: Public water connected; Sewer connected
- Home design: Two-story building; Existing construction; Vinyl siding
- Construction: Poured foundation
- Exterior features: Corner lot; Rectangular residential lot; City street frontage; Lot dimensions approximately 30 x 120
Interior
- Kitchen: Eat-in kitchen (in one unit); Refrigerator included (in one unit)
- Bedrooms: Two-bedroom unit (one unit); Three-bedroom unit (one unit)
- Flooring: Carpet; Hardwood; Ceramic tile; Laminate; Tile; Varies
- Bathrooms: Three full bathrooms total across units; One full bathroom in the 2-bed unit; Two full bathrooms in the 3-bed unit
- Heating & cooling: Gas forced-air heating
- Interior features: Thermal windows; Crawl space and full basement
- Laundry & utility: Gas water heater
Neighborhood map
What this means for you Summary
Snapshot
- This is a 2 × 2-bed/1.5-bath units multifamily listed at $114k.
Deal economics
- At list price, monthly cash flow is $1k ($15k/yr) — positive. Per door: $605/mo.
- The deal already cash-flows at list — no discount required.
- Meets the 1% rule at list price ($3k rent vs $114k).
- Recommended offer: $112k (1.5% below list) — sets the bar for market timing.
- Cap rate 19.0% vs local median 7.7% in Niagara Falls — top-decile yield for the area; either an underpriced asset or a hidden risk that comps aren't pricing in. Stress-test before assuming the spread holds.
Location & tenants
- Location reads 60/100 on livability (#956 in NY) — a middle-class / working-renter tenant base. Strengths: cost of living A+, housing A+; Watch: schools F, crime F, amenities F.
- Niagara Falls City School District (urban): math 26% / reading 34% proficiency, ranked #578 of 590 in NY (top 98%) — families likely to look elsewhere, expect single-tenant / working-renter base with shorter leases; 66% free/reduced lunch — lower-income household profile, screen leases tightly.
- Market conditions: 142 active listings in the ZIP; 2 comparable units currently listed for rent nearby; 167 units permitted in Niagara County in 2024 (0 in 5+ unit buildings).
- At $2,590/mo this rent would consume 61% of the median local household income ($51k/yr) (locally 1095% of renters already pay >50% of income on rent) — very limited rent-growth headroom before tenants either downsize or default.
Forward outlook
- Local home prices are declining (-3.0%/yr); year-one equity from $788 of loan paydown is wiped out by about $3k of value loss. Plan a longer hold.
- Niagara County population projected at -19% by 2050 — secular population decline; favor cash flow + early exit over multi-decade hold.
- At projected returns (-3.0% appreciation + 3.0% rent growth), your $32k cash investment doubles in ~3 years — after that, you're playing with house money.
Negotiation context
- It's been on market 17 days — a 2% lower offer ($112k) is reasonable based on typical stale-listing flexibility.
- 2 sale attempts with the ask held roughly flat each time — persistent listings suggest the price (not the market) is what's stuck; bring a comps-based counter.
- Current owner paid $87k; 31% above their basis — modest negotiation headroom, anchor on the comps not their cost.
Risks & watch-outs
- Watch-outs: built in 1925 — expect roof / HVAC / electrical / plumbing capex.
Questions for the listing agent
- Can we see the unit-by-unit rent roll, current vacancy, and any below-market leases? What's the average tenancy length?
- What capital expenditures (roof, boiler, parking lot, exteriors) have been made in the last 5 years, and what's planned in the next 2?
- Built in 1925 — when were the roof, HVAC, electrical panel, plumbing, and water heater last replaced?
- Is there a deadline driving the sale (1031 exchange, divorce, estate, relocation)? That informs how much negotiation room exists.
- Schools are F-rated, which usually means shorter tenancies and higher turnover. Who's the typical renter profile here, and what's been the actual vacancy rate?
- Crime grade is F in this area — have there been break-ins, vandalism, or insurance claims at this property in the last 3 years? What carrier currently insures it and at what premium?
- What's the average days-on-market for RENTAL listings here right now (not sales)? A rising rental-DOM trend means longer vacancies and softer asking-rent achievability than the comps imply.
- What's the recent tenant-quality profile in this submarket — average credit score on applications, eviction rate, late-payment / NSF rate, and stable-employment percentage? A property-management company in the area should have these aggregated.
- How much new apartment / multifamily construction is in the pipeline within 1–3 miles? Heavy new supply (>2% of stock underway) typically softens rents 12–24 months out; light construction supports rent growth.
Investment metrics
- 1% rule
- 2.27% ✓
- Cap rate
- 19.03%
- Cash-on-cash
- 45.50%
- DSCR
- 3.02
- GRM
- 3.7
CMA / ARV
- ARV (on-the-fly)
- $108,000
- Comps found
- 12
Show comp detail 12 sales within ~0.75 mi
| Address | Dist | Beds/Ba | Sqft | Sold | Price | $/sf | Match |
|---|---|---|---|---|---|---|---|
| 1867 Michigan Ave | 0.05mi | 4/2.0 (-1) | 2,100 (-3%) | 2mo | $87,000 | $41 | 87 |
| 1635 South Ave | 0.28mi | 5/2.0 | 2,208 (+2%) | 2mo | $85,000 | $38 | 81 |
| 2401 Whitney Ave | 0.27mi | 6/2.0 (+1) | 2,168 (+0%) | 2mo | $40,000 | $18 | 80 |
| 2225 Whitney Ave | 0.23mi | 6/2.0 (+1) | 2,200 (+2%) | 3mo | $125,000 | $57 | 79 |
| 2208 Weston Ave | 0.13mi | 4/2.0 (-1) | 2,016 (-7%) | 1mo | $55,000 | $27 | 77 |
| 2455 La Salle Ave | 0.38mi | 4/2.0 (-1) | 2,152 (-0%) | 3mo | $112,000 | $52 | 75 |
| 2460 Grand Ave | 0.57mi | 6/2.0 (+1) | 2,162 (+0%) | 0mo | $175,000 | $81 | 68 |
| 1623 Linwood Ave | 0.27mi | 4/2.0 (-1) | 1,994 (-8%) | 3mo | $100,000 | $50 | 67 |
| 2463 South Ave | 0.31mi | 4/2.0 (-1) | 2,016 (-7%) | 3mo | $137,500 | $68 | 67 |
| 2459 La Salle Ave | 0.38mi | 4/2.0 (-1) | 1,920 (-11%) | 2mo | $160,000 | $83 | 57 |
| 1145 Willow Ave | 0.57mi | 6/2.0 (+1) | 2,304 (+7%) | 3mo | $53,300 | $23 | 55 |
| 2488 Whitney Ave | 0.36mi | 4/3.0 (-1) | 2,384 (+10%) | 4mo | $85,000 | $36 | 54 |
Match score weights: distance 35% · size 25% · config 20% · recency 20%. Top-matched comps best support the ARV.
Projected returns pro-forma
-3.0% appreciation · 3.0% rent growth · sell at horizon
- IRR
- 42.7%
- Equity multiple
- 2.84×
- Total profit
- $58,681
- Equity at exit
- $16,998
- IRR
- 48.8%
- Equity multiple
- 5.72×
- Total profit
- $150,636
- Equity at exit
- $9,857
Cash invested: $31,920 (down + closing). Projections, not guarantees.
Landlord ↔ Tenant lean methodology
- Overall (STATE)
- 15 Strongly Tenant-Friendly
- State New York
- 15 Strongly Tenant-Friendly · D+10
- County
- — inherits STATE
- City
- — inherits STATE
ZIP-level market 14305
- Home prices YoY
- -10.9%
- Active inventory
- 142
- Price-to-rent
- 7.3×
Monthly cashflow live
- Estimated rent
- $2,590 high interval (Pro) →
- Mortgage (P&I)
- −$598
- Tax from tax record
- −$190 /mo · $2,286/yr
- Insurance
- −$48
- HOA
- −$0
- Vacancy / Maint / Mgmt
- −$544
- Net cashflow
- $1,210
Break-even live
Sensitivity live
| Price | -10% $1,275 | -5% $1,243 | +0% $1,210 | +5% $1,178 | +10% $1,146 |
|---|---|---|---|---|---|
| Rent | -10% $1,006 | -5% $1,108 | +0% $1,210 | +5% $1,313 | +10% $1,415 |
| Rate | -1.0pp $1,268 | -0.5pp $1,239 | base $1,210 | +0.5pp $1,181 | +1.0pp $1,151 |
2-unit breakdown (identical units grouped — click to expand)
| Units | Beds | Baths | Est. rent |
|---|---|---|---|
| 2× units | 2 | 1.5 | $2,590 |
| #1 | 2 | 1.5 | $1,295 |
| #2 | 2 | 1.5 | $1,295 |
| Total (2 units) | $2,590 | ||
UW: 25.0% down · 7.5% · 30yr · 1.5% tax · 5.0% vac · 8.0% maint · 8.0% mgmt
Financing live
Cash to close
- Down payment
- $28,500
- Closing costs
- $3,420
- Reserves months
- —
- Total cash needed
- —
Loan-product check · same deal, 3 products live
Conventional
25% down · 7.5% · 30yr
- Down + closing
- —
- Monthly P&I
- —
- Monthly cashflow
- —
- DSCR
- —
- Eligible?
- —
Personal DTI + credit; lowest rate.
DSCR
20% down · 8.5% · 30yr
- Down + closing
- —
- Monthly P&I
- —
- Monthly cashflow
- —
- DSCR
- —
- Eligible?
- —
No personal income docs; deal must DSCR.
Hard money
10% down · 12.0% · 12mo
- Down + closing
- —
- Monthly P&I
- —
- Monthly cashflow
- —
- DSCR
- —
- Eligible?
- —
Short-term bridge; refi at stabilization.
Rent comps 2 comps
| Address | Beds | Baths | Sqft | Rent | $/sqft | DOM | Units | Dist |
|---|---|---|---|---|---|---|---|---|
| 2020 Forest Ave Niagara Falls, NY | 4.0 | 2.0 | 1600 | $1,500 | $0.94 | 17d | 1 | 0.40mi |
| 3025 Macklem Ave Niagara Falls, NY | 4.0 | 1.5 | 1750 | $2,200 | $1.26 | 44d | 1 | 1.32mi |
Listing history 13 events
-
2026-06-18days on market $114,000 Active 17 DOM
-
2026-06-17days on market $114,000 Active 16 DOM
-
2026-06-16days on market $114,000 Active 15 DOM
-
2026-06-15days on market $114,000 Active 14 DOM
-
2026-06-13days on market $114,000 Active 12 DOM
-
2026-06-13days on market $114,000 Active 11 DOM
-
2026-06-10days on market $114,000 Active 9 DOM
-
2026-06-09days on market $114,000 Active 8 DOM
-
2026-06-08days on market $114,000 Active 7 DOM
-
2026-06-07days on market $114,000 Active 6 DOM
-
2026-06-03days on market $114,000 Active 2 DOM
-
2026-06-02remarks 693-char remark
-
2026-06-02$114,000 Active 1 DOM
ⓘ Source: listings_history table (triggers on properties + properties_extension) + one-shot
backfill from property_details.listing_events for pre-trigger history.
Tax reassessment forecast NY · Partial reset (capped growth)
- Current annual tax
- $2,286 · $190/mo
- Projected year-2 tax
- $2,286 · $190/mo
- Expected delta
- $0/yr ($0/mo · 0.0%)
ⓘ Screening estimate from a state-policy table — verify with the county assessor before closing.
Climate risk First Street
- Flood 1/10 Low FEMA zone X (unshaded) · 0% chance over 30 yrs
- Wildfire 3/10 Moderate
- Heat 2/10 Low 7 d/yr ≥94°F today · 15 d/yr by 30 yrs out
- Wind 1/10 Low
- Air quality 3/10 Moderate 2 unhealthy d/yr today · 3 by 30 yrs out
Nearby sold comps map
Loading sold comps map…
Walkable amenities ~0.75 mi
Loading nearby amenities…
Taxation est. · year 1
- Rental income
- $31,080
- − Mortgage interest
- −$6,386
- − Property taxes
- −$2,286
- − Insurance
- −$570
- − Repairs & maintenance
- −$2,486
- − Management
- −$2,486
- − Depreciation
- −$3,316
- Taxable income
- $13,549
- Est. tax owed @ 24.0%
- −$3,252
- After-tax cash flow
- $11,272/yr
For passive investors: Depreciation is non-cash, so a rental often shows a tax loss while cash-flowing — sheltering income. Rental losses are passive: they offset passive income freely, and up to $25,000/yr can offset ordinary (W-2) income if you actively participate and your MAGI is under $100k (phasing out to $0 by $150k); unused losses carry forward. On sale, claimed depreciation is recaptured at up to 25%, and gains may owe capital-gains tax (a 1031 exchange can defer both). Figures are a year-1 estimate at your 24.0% rate — not tax advice; consult a CPA.
Schools (NCES district)
- District
- Niagara Falls City School District
- NCES district ID
- 3620820
- Math proficiency
- 26% ▼ -10.00%
- Reading proficiency
- 34% ▲ 3.00%
- Median HH income
- $32,488
- Composite
- 24.5/100
- National rank
- #7655
- State rank
- #578 of 590 in NY
Livability — Niagara Falls
- Score
- 60/100
- State rank
- #956
- US rank
- #18749
Category grades
Schools grade is shown separately in the Schools card above.
Census & demographics
- Census place
- Niagara Falls, NY
- County
- Niagara County · 157,377 people
- City population
- 62,983
- Metro
- Buffalo-Cheektowaga, NY
- Population (ZIP)
- 16,696
- Household income
- $51,004
- Rent vs Own
- Severe rent burden
- 1095.0
Population outlook (Niagara County) Hauer SSP2
- Today (2025)
- 204,149 people
- By 2030
- 197,900 · -3.1%
- By 2040
- 182,239 · -10.7%
- By 2050
- 165,198 · -19.1%
- By 2075
- 129,416 · -36.6%
- By 2100
- 96,222 · -52.9%
Race, ethnicity, and origin ACS 2023
- Neighborhood character
- Diverse neighborhood (Simpson 0.63)
- Race & ethnicity
- White 55% Black 24% Two or more races 13% Hispanic / Latino 8% Asian 1% Native American 1%
- Hispanic origin (detail)
- Puerto Rican 4%
- Common ancestry
- Romanian 6% Slovak 2% Lithuanian 2%
- Foreign-born
- 6% · Canada, Jamaica
- Languages at home
- 93% English-only · Spanish 4% Other Indo-European 1%
Political lean MEDSL · Niagara
- 2024 margin
- R (+14.9) · D 42.5% · R 57.5%
- 2008→2024 swing
- -15.9pp toward R · 2008: 1.0pp · 2024: -14.9pp
- All cycles
- 2024: R+14.9 2020: R+9.7 2016: R+19.0 2012: D+0.6 2008: D+1.0
Not yet ingested
- Civics
- —
Market trends
- HPI YoY
- ▼ -43.08%
- Current HPI
- 350.8741
- Rent YoY
- —
- Metro
- Buffalo-Cheektowaga, NY
- State GDP YoY
- ▲ 2.60%
- F500 in state
- 92
Industry mix (Fortune 500 HQ in NY)
| Industry | F500 HQs | Revenue |
|---|---|---|
| Financial Services | 10 | $950B |
|
||
| Consumer Goods | 9 | $162B |
|
||
| Insurance | 4 | $225B |
|
||
| Telecommunications | 2 | $144B |
|
||
| Pharmaceuticals | 2 | $112B |
|
||
| Media / Entertainment | 2 | $69B |
|
||
Price history
+31.0% since first listed3 events — show timeline
- 2026-06-01 Listed $114,000 WNYREIS
- 2025-07-08 Listed $130,000 WNYREIS
- 2022-10-27 Sold (Public Records) $87,000 Public Records
Property tax history
+5.8%/yrLatest (2025): $2,286 · -0.1% YoY. Source: county tax records.
Cash-flow waterfall
monthlySold comps — $/sqft
last 12 mo · ≤1 miLoading sold comps…