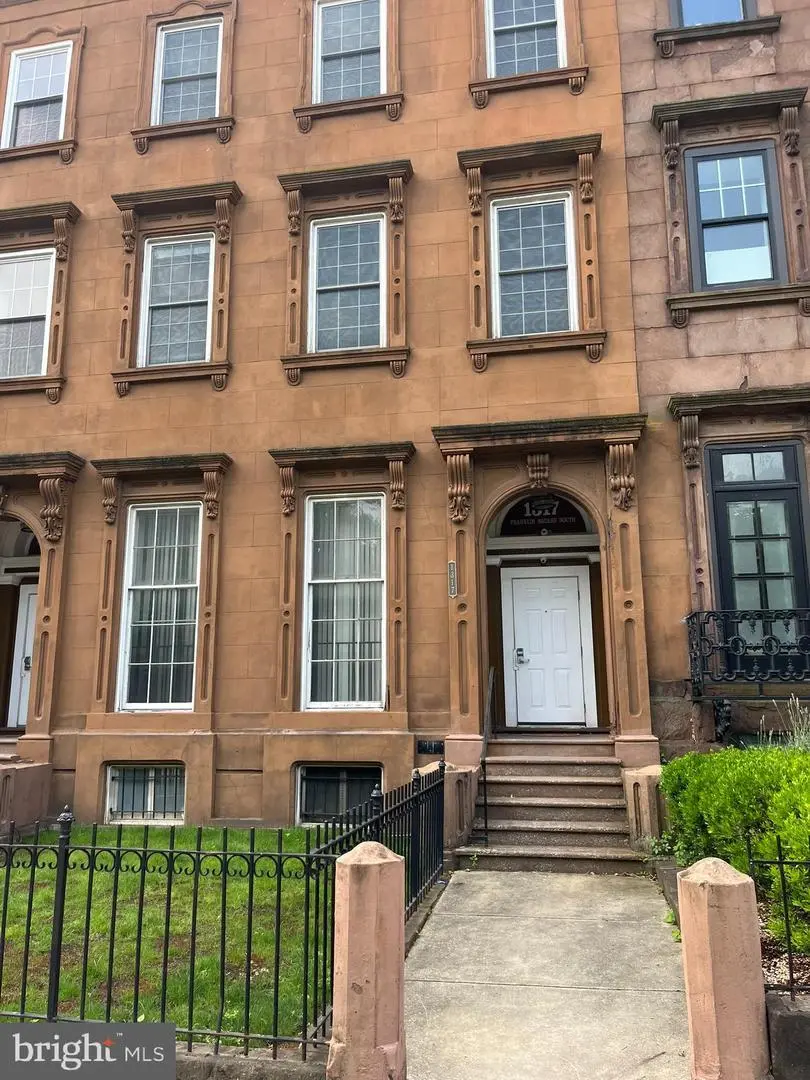
1317 W Fayette St Unit 3B · Baltimore, MD
Flood risk 1/10 · Minimal
- FEMA flood zone
- X (unshaded)
- Chance of flooding over 30 yrs
- 0.0%
- Est. flood insurance / yr
- $507 – $1,088
Fire risk 1/10 · Minimal
- Est. fire insurance / yr
- $755 – $1,403
Heat risk 7/10 · Major
- Hot days now (above 103°F)
- 7 days/yr
- Hot days in 30 yrs
- 15 days/yr
Wind risk 6/10 · Moderate
- Chance of severe wind over 30 yrs
- 27.0%
Air-quality risk 4/10 · Minor
- Unhealthy air days now
- 6 days/yr
- Unhealthy air days in 30 yrs
- 7 days/yr
Risk factors via First Street. Map © Google.
Why this score? — see what drove the B grade
The composite is a weighted blend of 9 inputs, each scored 0–100. Each bar is that input's sub-score; the figure is the points it added to the 100-point composite (weight × sub-score).
- Cash flow +30.0/30.0
- ARV discount +13.2/15.0
- 1% rule +10.0/10.0
- DSCR +10.0/10.0
- Rent growth +4.4/5.0
- Livability +3.8/5.0
- Condition / age +2.5/5.0
- Schools +1.0/10.0
- Appreciation +0.0/10.0
$80,000
🖨 Deal sheet (PDF) 📄 Offer letter ✓ Due diligence
Listing remarks MLS
Lovely condo directly across the street from Franklin Square Park. Front door to building is accessed by key. The unit is on the 3rd floor featuring new kitchen cabinets and counter top and new carpet throughout the unit. Optional parking in the rear with a rear outdoor courtyard. "Sold AS IS". The year built is unknown. This is definitely "A Must See"!
Key facts
- Franklin square park
- New carpet
- New kitchen cabinets
Tags
Neighborhood map
What this means for you Summary
Snapshot
- This is a 2-bed/1.0-bath condo listed at $80k.
Deal economics
- At list price, monthly cash flow is $355 ($4k/yr) — positive.
- The deal already cash-flows at list — no discount required.
- Meets the 1% rule at list price ($2k rent vs $80k).
- Recommended offer: $70k (12.0% below list) — sets the bar for market timing.
- Cap rate 11.6% vs local median 6.0% in Baltimore — top-decile yield for the area; either an underpriced asset or a hidden risk that comps aren't pricing in. Stress-test before assuming the spread holds.
Location & tenants
- Location reads 76/100 on livability (#90 in MD, #3,396 nationally) — a middle-class / working-renter tenant base. Strengths: amenities A+, commute A+, housing A+; Watch: crime F.
- Baltimore City Public Schools (urban): math 7% / reading 16% proficiency, ranked #24 of 24 in MD (top 100%) — low school quality limits family demand, transient renter base, plan for 1-2y turnover; 79% free/reduced lunch — lower-income household profile, screen leases tightly.
- Zoned schools: Elmer A. Henderson: A Johns Hopkins Partnership (math 2% / reading 16%, grade F, #650 of 860 statewide, top 77%, 642 students, 80% FRL); Baltimore Polytechnic Institute (math 71% / reading 84%, grade A-, #22 of 222 statewide, top 10%, 1,555 students, 43% FRL) — zoned schools average 62% FRL vs 79% district-wide (17 pts lower); this property's tenant base skews higher-income than the district average.
- Zoned-school proficiency averages 43% at this address vs 12% district-wide (+32 pts) — the actual schools serving this property are materially stronger than the Baltimore City Public Schools average implies; a family-tenant draw the district grade alone would hide.
- Market conditions: Rents rising fast (+7.5%/yr); 425 active listings in the ZIP; 40 comparable units currently listed for rent nearby; rentals at typical pace (median 23d on market — plan ~3-4 weeks tenant-placement turnaround); 1,273 units permitted in Baltimore city in 2024 (1,104 in 5+ unit buildings).
- This rent runs 41% of the median local income ($46k/yr) — at the standard rent-burdened threshold; future hikes will face affordability resistance.
Forward outlook
- Local home prices are declining (-3.0%/yr); year-one equity from $553 of loan paydown is wiped out by about $2k of value loss. Plan a longer hold.
- Baltimore County population projected to shrink 4% by 2050 — rents likely to lag national; underwrite the cash flow, not the appreciation.
- At projected returns (-3.0% appreciation + 7.5% rent growth), your $22k cash investment doubles in ~5 years — after that, you're playing with house money.
Negotiation context
- It's been on market 318 days — a 12% lower offer ($70k) is reasonable based on typical stale-listing flexibility.
Risks & watch-outs
- Watch-outs: built in 1915 — expect roof / HVAC / electrical / plumbing capex.
- Climate carrying-cost: major wind risk, 27% chance of damaging wind over 30y; extreme-heat days projected 7→15/yr by 2055 (HVAC capex compounding) — expect insurance premiums to compound above CPI over the hold.
Questions for the listing agent
- It's been on market 318 days. Have you received any prior offers? Is the seller open to a 12% concession, seller financing, or rate buy-down credit?
- Built in 1915 — when were the roof, HVAC, electrical panel, plumbing, and water heater last replaced?
- What does the HOA fee cover, when was the last increase, and are there any pending special assessments or reserve-fund shortfalls?
- Any open or pending special assessments — roof, HVAC, plumbing, elevator, façade? What's the per-unit balance and payoff schedule, and is the seller paying it off at close or rolling it to the buyer?
- Why hasn't it sold? Are there any deal-killer items the seller is aware of (foundation, flood, title, zoning, code violations)?
- Is there a deadline driving the sale (1031 exchange, divorce, estate, relocation)? That informs how much negotiation room exists.
- Schools are D-rated, which usually means shorter tenancies and higher turnover. Who's the typical renter profile here, and what's been the actual vacancy rate?
- Crime grade is F in this area — have there been break-ins, vandalism, or insurance claims at this property in the last 3 years? What carrier currently insures it and at what premium?
- What's the average days-on-market for RENTAL listings here right now (not sales)? A rising rental-DOM trend means longer vacancies and softer asking-rent achievability than the comps imply.
- What's the recent tenant-quality profile in this submarket — average credit score on applications, eviction rate, late-payment / NSF rate, and stable-employment percentage? A property-management company in the area should have these aggregated.
- How much new apartment / multifamily construction is in the pipeline within 1–3 miles? Heavy new supply (>2% of stock underway) typically softens rents 12–24 months out; light construction supports rent growth.
Investment metrics
- 1% rule
- 1.94% ✓
- Cap rate
- 11.61%
- Cash-on-cash
- 18.99%
- DSCR
- 1.85
- GRM
- 4.3
CMA / ARV
- ARV (median comp)
- $91,536
- List price
- $80,000
- Delta
- -12.60%
- Verdict
- UNDERPRICED
- Comps
- 20 within 1.0 mi
Projected returns pro-forma
-3.0% appreciation · 7.51% rent growth · sell at horizon
- IRR
- 17.7%
- Equity multiple
- 1.77×
- Total profit
- $17,197
- Equity at exit
- $11,928
- IRR
- 30.0%
- Equity multiple
- 4.49×
- Total profit
- $78,102
- Equity at exit
- $6,917
Cash invested: $22,400 (down + closing). Projections, not guarantees.
Landlord ↔ Tenant lean methodology
- Overall (CITY)
- 12 Strongly Tenant-Friendly
- State Maryland
- 27 Tenant-Leaning · D+14
- County
- — inherits STATE
- City Baltimore
- 12 Strongly Tenant-Friendly · D+58
ZIP-level market 21223
- Rents YoY
- 7.5%
- Active inventory
- 425
- Price-to-rent
- 4.3×
Monthly cashflow live
- Estimated rent
- $1,552 high interval (Pro) →
- Mortgage (P&I)
- −$420
- Tax from tax record
- −$124 /mo · $1,483/yr
- Insurance
- −$33
- HOA
- −$295
- Vacancy / Maint / Mgmt
- −$326
- Net cashflow
- $355
Break-even live
Sensitivity live
| Price | -10% $400 | -5% $377 | +0% $355 | +5% $332 | +10% $309 |
|---|---|---|---|---|---|
| Rent | -10% $232 | -5% $293 | +0% $355 | +5% $416 | +10% $477 |
| Rate | -1.0pp $395 | -0.5pp $375 | base $355 | +0.5pp $334 | +1.0pp $313 |
UW: 25.0% down · 7.5% · 30yr · 1.5% tax · 5.0% vac · 8.0% maint · 8.0% mgmt
Financing live
Cash to close
- Down payment
- $20,000
- Closing costs
- $2,400
- Reserves months
- —
- Total cash needed
- —
Loan-product check · same deal, 3 products live
Conventional
25% down · 7.5% · 30yr
- Down + closing
- —
- Monthly P&I
- —
- Monthly cashflow
- —
- DSCR
- —
- Eligible?
- —
Personal DTI + credit; lowest rate.
DSCR
20% down · 8.5% · 30yr
- Down + closing
- —
- Monthly P&I
- —
- Monthly cashflow
- —
- DSCR
- —
- Eligible?
- —
No personal income docs; deal must DSCR.
Hard money
10% down · 12.0% · 12mo
- Down + closing
- —
- Monthly P&I
- —
- Monthly cashflow
- —
- DSCR
- —
- Eligible?
- —
Short-term bridge; refi at stabilization.
Rent comps 40 comps
| Address | Beds | Baths | Sqft | Rent | $/sqft | DOM | Units | Dist |
|---|---|---|---|---|---|---|---|---|
| 1323 W Fayette St Baltimore, MD | 2.0 | 1.0 | 1000 | $1,350 | $1.35 | 0d | 1 | 0.04mi |
| 28 N Norris St Baltimore, MD | 1.0 | 2.0 | 700 | $1,450 | $2.07 | 45d | 1 | 0.08mi |
| 1315 Hollins St Unit 2 Baltimore, MD | 3.0 | 2.0 | 1096 | $1,950 | $1.78 | 14d | 1 | 0.12mi |
| 1315 Hollins St Unit 2 Baltimore, MD | 3.0 | 2.0 | 1096 | $1,860 | $1.70 | 6d | 1 | 0.12mi |
| 1324 W Lombard St Unit 2 Baltimore, MD | 2.0 | 1.5 | 1100 | $1,450 | $1.32 | 45d | 1 | 0.16mi |
| 1324 W Lombard St Unit 1 Baltimore, MD | 2.0 | 2.0 | 1100 | $1,500 | $1.36 | 26d | 1 | 0.16mi |
| 48 S Carrollton Ave Unit 4 Baltimore, MD | 2.0 | 1.0 | 670 | $1,600 | $2.39 | 45d | 1 | 0.16mi |
| 1601 Frederick Ave Unit 3 Baltimore, MD | 2.0 | 1.0 | 1050 | $1,050 | $1.00 | 6d | 1 | 0.20mi |
| 101 N Schroeder St Baltimore, MD | 3.0 | 1.0–2.0 | 1037 | $2,588 | $2.50 | 0d | 11 | 0.31mi |
| 305 S Calhoun St Baltimore, MD | 2.0 | 1.0 | 1000 | $1,300 | $1.30 | 24d | 1 | 0.32mi |
| 1712 W Lombard St #4 Baltimore, MD | 1.0 | 1.0 | 550 | $900 | $1.64 | 45d | 1 | 0.33mi |
| 923 McHenry St Baltimore, MD | 3.0 | 1.0 | 1008 | $1,625 | $1.61 | 45d | 1 | 0.46mi |
| 1918 W Baltimore St Baltimore, MD | 2.0–3.0 | 1.0–2.0 | 857 | $1,375 | $1.60 | 45d | 1 | 0.46mi |
| 847 McHenry St Baltimore, MD | 2.0 | 2.0 | 952 | $1,795 | $1.89 | 6d | 1 | 0.50mi |
| 1142 Sargeant St Baltimore, MD | 3.0 | 2.0 | 1080 | $1,601 | $1.48 | 0d | 1 | 0.51mi |
| 1142 Sargeant St Baltimore, MD | 3.0 | 2.0 | 1080 | $1,601 | $1.48 | 4d | 1 | 0.51mi |
| 1215 James St Baltimore, MD | 2.0 | 1.0 | 960 | $1,500 | $1.56 | 45d | 1 | 0.52mi |
| 1127 Sargeant St Baltimore, MD | 2.0 | 1.5 | 1080 | $1,275 | $1.18 | 26d | 1 | 0.53mi |
| 1315 Harlem Ave Unit C Baltimore, MD | 2.0 | 1.0 | 900 | $1,425 | $1.58 | 45d | 1 | 0.53mi |
| 1315 Harlem Ave Unit B Baltimore, MD | 2.0 | 1.0 | 900 | $1,425 | $1.58 | 26d | 1 | 0.53mi |
| 1160 Washington Blvd Baltimore, MD | 2.0 | 1.0 | 960 | $1,575 | $1.64 | 26d | 1 | 0.55mi |
| 1163 Washington Blvd Baltimore, MD | 2.0 | 2.5 | 1012 | $1,700 | $1.68 | 14d | 1 | 0.58mi |
| 853 Reinhart St Baltimore, MD | 2.0 | 2.5 | 780 | $1,800 | $2.31 | 45d | 1 | 0.64mi |
| 121 S Fremont Ave Baltimore, MD | 1.0 | 1.0 | 582 | $2,100 | $3.61 | 22d | 5 | 0.66mi |
| 805 Washington Blvd Unit B Baltimore, MD | 2.0 | 2.0 | 1106 | $1,650 | $1.49 | 22d | 1 | 0.68mi |
| 805 Washington Blvd Unit A Baltimore, MD | 2.0 | 2.0 | 1050 | $1,650 | $1.57 | 45d | 1 | 0.68mi |
| 1339 W Lafayette Ave #1 Baltimore, MD | 2.0 | 2.0 | 700 | $1,600 | $2.29 | 14d | 1 | 0.68mi |
| 725 W Pratt St Baltimore, MD | 1.0 | 1.0 | 584 | $1,925 | $3.29 | 0d | 8 | 0.69mi |
| 776 Washington Blvd Unit 3F Baltimore, MD | 1.0 | 1.0 | 800 | $1,000 | $1.25 | 45d | 1 | 0.70mi |
| 519 Scott St Unit 1 Baltimore, MD | 2.0 | 2.0 | 800 | $2,000 | $2.50 | 45d | 1 | 0.72mi |
| 1432 Carroll St Baltimore, MD | 2.0 | 1.5 | 912 | $1,900 | $2.08 | 45d | 1 | 0.75mi |
| 657 Dover St Baltimore, MD | 1.0 | 2.0 | 1080 | $1,400 | $1.30 | 14d | 1 | 0.76mi |
| 653 Dover St Baltimore, MD | 1.0 | 1.5 | 936 | $1,500 | $1.60 | 22d | 1 | 0.76mi |
| 1110 Shields Pl Unit 1129 Baltimore, MD | 2.0 | 1.0 | 770 | $1,100 | $1.43 | 45d | 1 | 0.76mi |
| 910 N Arlington Ave Unit 1 Baltimore, MD | 1.0 | 1.0 | 551 | $999 | $1.81 | 20d | 1 | 0.76mi |
| 617 W Lexington St Baltimore, MD | 1.0–2.0 | 1.0 | 975 | $2,200 | $2.26 | 12d | 4 | 0.77mi |
| 666 Melvin Dr Baltimore, MD | 1.0 | 1.5 | 852 | $1,450 | $1.70 | 0d | 1 | 0.78mi |
| 62 N Gorman Ave Baltimore, MD | 3.0 | 2.0 | 1100 | $2,500 | $2.27 | 20d | 1 | 0.80mi |
| 802 Mangold St Baltimore, MD | 2.0 | 2.5 | 960 | $2,300 | $2.40 | 0d | 1 | 0.82mi |
| 812 S Paca St Baltimore, MD | 3.0 | 2.0 | 990 | $1,500 | $1.52 | 14d | 1 | 0.84mi |
HOA detail condo
- Monthly dues
- $295 · $3,540/yr
- Assessments
- None detected in remarks — confirm with the listing agent.
Listing history 19 events
-
2026-06-21days on market $80,000 Active 318 DOM
-
2026-06-18days on market $80,000 Active 315 DOM
-
2026-06-17days on market $80,000 Active 314 DOM
-
2026-06-16days on market $80,000 Active 313 DOM
-
2026-06-15days on market $80,000 Active 312 DOM
-
2026-06-13days on market $80,000 Active 310 DOM
-
2026-06-09days on market $80,000 Active 306 DOM
-
2026-06-08days on market $80,000 Active 305 DOM
-
2026-06-07days on market $80,000 Active 304 DOM
-
2026-06-04days on market $80,000 Active 301 DOM
-
2026-06-03days on market $80,000 Active 300 DOM
-
2026-06-02days on market $80,000 Active 299 DOM
-
2026-06-01days on market $80,000 Active 298 DOM
-
2026-05-31days on market $80,000 Active 297 DOM
-
2025-10-06price $80,000 375-char remark
Show marketing remark (375 chars)
Lovely condo directly across the street from Franklin Square Park. Front door to building is accessed by key. The unit is on the 3rd floor featuring new kitchen cabinets and counter top and new carpet throughout the unit. Optional parking in the rear with a rear outdoor courtyard. "Sold AS IS". The year built is unknown. This is definitely "A Must See"!
-
2025-08-07$99,900 Active 375-char remark
Show marketing remark (375 chars)
Lovely condo directly across the street from Franklin Square Park. Front door to building is accessed by key. The unit is on the 3rd floor featuring new kitchen cabinets and counter top and new carpet throughout the unit. Optional parking in the rear with a rear outdoor courtyard. "Sold AS IS". The year built is unknown. This is definitely "A Must See"!
-
1994-06-28soldstatus $94,087
-
1993-11-29soldstatus $40,000
-
1993-11-29soldstatus $40,000
ⓘ Source: listings_history table (triggers on properties + properties_extension) + one-shot
backfill from property_details.listing_events for pre-trigger history.
Tax reassessment forecast MD · Partial reset (capped growth)
- Current annual tax
- $1,483 · $124/mo
- Projected year-2 tax
- $1,483 · $124/mo
- Expected delta
- $0/yr ($0/mo · 0.0%)
ⓘ Screening estimate from a state-policy table — verify with the county assessor before closing.
Climate risk First Street
- Flood 1/10 Low FEMA zone X (unshaded) · 0% chance over 30 yrs
- Wildfire 1/10 Low
- Heat 7/10 Severe 7 d/yr ≥103°F today · 15 d/yr by 30 yrs out
- Wind 6/10 Major 27% chance of damaging wind over 30 yrs
- Air quality 4/10 Moderate 6 unhealthy d/yr today · 7 by 30 yrs out
Nearby sold comps map
Loading sold comps map…
Walkable amenities ~0.75 mi
Loading nearby amenities…
Taxation est. · year 1
- Rental income
- $18,622
- − Mortgage interest
- −$4,481
- − Property taxes
- −$1,483
- − Insurance
- −$400
- − Repairs & maintenance
- −$1,490
- − Management
- −$1,490
- − HOA
- −$3,540
- − Depreciation
- −$2,327
- Taxable income
- $3,411
- Est. tax owed @ 24.0%
- −$819
- After-tax cash flow
- $3,436/yr
For passive investors: Depreciation is non-cash, so a rental often shows a tax loss while cash-flowing — sheltering income. Rental losses are passive: they offset passive income freely, and up to $25,000/yr can offset ordinary (W-2) income if you actively participate and your MAGI is under $100k (phasing out to $0 by $150k); unused losses carry forward. On sale, claimed depreciation is recaptured at up to 25%, and gains may owe capital-gains tax (a 1031 exchange can defer both). Figures are a year-1 estimate at your 24.0% rate — not tax advice; consult a CPA.
Schools (NCES district)
- District
- Baltimore City Public Schools
- NCES district ID
- 2400090
- Math proficiency
- 7% ▼ -9.00%
- Reading proficiency
- 16% ▼ -5.00%
- Median HH income
- $42,108
- Composite
- 10.08/100
- National rank
- #9805
- State rank
- #24 of 24 in MD
Livability — Baltimore
- Score
- 76/100
- State rank
- #90
- US rank
- #3396
Category grades
Schools grade is shown separately in the Schools card above.
Census & demographics
- Census place
- Baltimore, MD
- County
- Baltimore City · 558,601 people
- City population
- 588,727
- Metro
- Baltimore-Columbia-Towson, MD
- Population (ZIP)
- 19,572
- Household income
- $45,840
- Rent vs Own
- Severe rent burden
- 1755.0
Population outlook (Baltimore County) Hauer SSP2
- Today (2025)
- 624,249 people
- By 2030
- 621,541 · -0.4%
- By 2040
- 609,756 · -2.3%
- By 2050
- 597,249 · -4.3%
- By 2075
- 552,236 · -11.5%
- By 2100
- 513,934 · -17.7%
Race, ethnicity, and origin ACS 2023
- Neighborhood character
- Predominantly Black (72%)
- Race & ethnicity
- Black 72% White 16% Hispanic / Latino 7% Two or more races 6% Asian 1%
- Hispanic origin (detail)
- Mexican 3% Puerto Rican 1%
- Common ancestry
- Romanian 1%
- Foreign-born
- 8% · Canada
- Languages at home
- 90% English-only · Spanish 6% French/Haitian/Cajun 2% Other Indo-European 1%
Political lean MEDSL · Baltimore
- 2024 margin
- Solid D (+73.0) · D 85.2% · R 12.2% · Other 2.6%
- 2008→2024 swing
- -2.5pp toward R · 2008: 75.5pp · 2024: 73.0pp
- All cycles
- 2024: D+73.0 2020: D+76.6 2016: D+74.6 2012: D+76.4 2008: D+75.5
Not yet ingested
- Civics
- —
Market trends
- HPI YoY
- ▼ -97.99%
- Current HPI
- 140.5836
- Rent YoY
- ▲ 7.51%
- Metro
- Baltimore-Columbia-Towson, MD
- State GDP YoY
- ▲ 2.97%
- F500 in state
- 12
Industry mix (Fortune 500 HQ in MD)
| Industry | F500 HQs | Revenue |
|---|---|---|
| Aerospace / Defense | 1 | $71B |
|
||
| Utilities | 1 | $25B |
|
||
| Hotels | 1 | $24B |
|
||
| Consumer Goods | 1 | $7B |
|
||
| Real Estate | 1 | $6B |
|
||
| Chemicals | 1 | $2B |
|
||
Price history
+100.0% since first listed5 events — show timeline
- 2025-10-06 Price Changed $80,000 BRIGHT MLS
- 2025-08-07 Listed $99,900 BRIGHT MLS
- 1994-06-28 Sold (Public Records) $94,087 Public Records
- 1993-11-29 Sold (Public Records) $40,000 Public Records
- 1993-11-29 Sold (Public Records) $40,000 Public Records
Property tax history
-3.0%/yrLatest (2025): $1,483 · +9.3% YoY. Source: county tax records.
Cash-flow waterfall
monthlySold comps — $/sqft
last 12 mo · ≤1 miLoading sold comps…