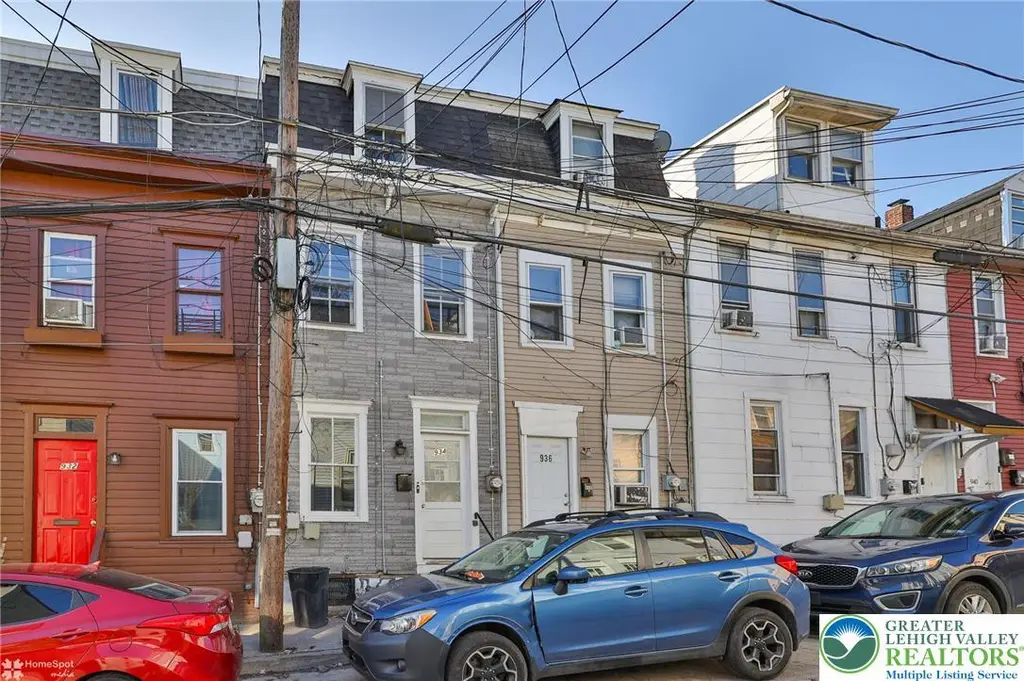
934 W Pine St · Allentown, PA
Flood risk 5/10 · Moderate
- FEMA flood zone
- X (unshaded)
- Chance of flooding over 30 yrs
- 0.66%
- Est. flood insurance / yr
- $473 – $860
Fire risk 1/10 · Minimal
- Est. fire insurance / yr
- $511 – $949
Heat risk 5/10 · Moderate
- Hot days now (above 99°F)
- 7 days/yr
- Hot days in 30 yrs
- 15 days/yr
Wind risk 4/10 · Minor
- Chance of severe wind over 30 yrs
- 15.0%
Air-quality risk 3/10 · Minor
- Unhealthy air days now
- 3 days/yr
- Unhealthy air days in 30 yrs
- 4 days/yr
Risk factors via First Street. Map © Google.
Why this score? — see what drove the D grade
The composite is a weighted blend of 9 inputs, each scored 0–100. Each bar is that input's sub-score; the figure is the points it added to the 100-point composite (weight × sub-score).
- Cash flow +20.0/30.0
- DSCR +6.3/10.0
- 1% rule +4.4/10.0
- Livability +4.0/5.0
- Rent growth +3.9/5.0
- Condition / age +2.5/5.0
- Schools +1.2/10.0
- ARV discount +0.0/15.0
- Appreciation +0.0/10.0
$195,000
🖨 Deal sheet 📄 Offer letter ✓ Due diligence
Listing remarks MLS
This 3-bedroom, 1-bath row home in Allentown is perfect for an owner-occupant or investor looking to place a tenant quickly. A great opportunity to customize or generate rental income right away. This property is also part of a portfolio of 9 single-family homes available for sale, offering added investment potential. Tenant is leased through 4/2027.
Key facts
- Built 1888
- Listed 93 days
Neighborhood map
What this means for you Summary
Snapshot
- This is a 3-bed/1.0-bath single-family listed at $195k.
Deal economics
- At list price, monthly cash flow is $239 ($3k/yr) — positive.
- The deal already cash-flows at list — no discount required.
- To meet the 1% rule (rent ≥ 1% of price), the offer needs to be $184k (5.7% below list).
- Recommended offer: $177k (9.0% below list) — sets the bar for market timing.
- Cap rate 7.8% vs local median 5.3% in Allentown — top-decile yield for the area; either an underpriced asset or a hidden risk that comps aren't pricing in. Stress-test before assuming the spread holds.
Location & tenants
- Location reads 81/100 on livability (#171 in PA, #1,440 nationally) — a professional / high-income tenant draw. Strengths: commute A+, cost of living A+, housing A+; Watch: schools D+, employment D.
- Allentown City SD (urban): math 10% / reading 20% proficiency, ranked #513 of 539 in PA (top 95%) — low school quality limits family demand, transient renter base, plan for 1-2y turnover; 73% free/reduced lunch — lower-income household profile, screen leases tightly.
- Market conditions: Rents rising fast (+5.5%/yr); 167 active listings in the ZIP; 40 comparable units currently listed for rent nearby; rentals at typical pace (median 21d on market — plan ~3-4 weeks tenant-placement turnaround); lower-income renter base — watch delinquency; 765 units permitted in Lehigh County in 2024 (286 in 5+ unit buildings).
- At $1,839/mo this rent would consume 51% of the median local household income ($43k/yr) (locally 4313% of renters already pay >50% of income on rent) — very limited rent-growth headroom before tenants either downsize or default.
Forward outlook
- Local home prices are declining (-3.0%/yr); year-one equity from $1k of loan paydown is wiped out by about $6k of value loss. Plan a longer hold.
- Lehigh County population projected at +21% by 2050 — long-run rental-demand tailwind backs the buy-and-hold thesis.
Negotiation context
- It's been on market 93 days — a 9% lower offer ($177k) is reasonable based on typical stale-listing flexibility.
- 8 sale attempts since 21y ago with the ask held roughly flat each time — persistent listings suggest the price (not the market) is what's stuck; bring a comps-based counter.
- Current owner paid $121k; list at $195k implies a 61% gain — meaningful room to come down on a strong offer.
Risks & watch-outs
- Watch-outs: built in 1888 — expect roof / HVAC / electrical / plumbing capex.
- Climate carrying-cost: moderate flood risk; extreme-heat days projected 7→15/yr by 2055 (HVAC capex compounding) — expect insurance premiums to compound above CPI over the hold.
Questions for the listing agent
- It's been on market 93 days. Have you received any prior offers? Is the seller open to a 9% concession, seller financing, or rate buy-down credit?
- Built in 1888 — when were the roof, HVAC, electrical panel, plumbing, and water heater last replaced?
- Why hasn't it sold? Are there any deal-killer items the seller is aware of (foundation, flood, title, zoning, code violations)?
- Is there a deadline driving the sale (1031 exchange, divorce, estate, relocation)? That informs how much negotiation room exists.
- Schools are D-rated, which usually means shorter tenancies and higher turnover. Who's the typical renter profile here, and what's been the actual vacancy rate?
- The area grade is low — what's the realistic commute time and amenity access for the typical tenant pool here? Any planned neighborhood developments (good or bad) we should know about?
- What's the average days-on-market for RENTAL listings here right now (not sales)? A rising rental-DOM trend means longer vacancies and softer asking-rent achievability than the comps imply.
- What's the recent tenant-quality profile in this submarket — average credit score on applications, eviction rate, late-payment / NSF rate, and stable-employment percentage? A property-management company in the area should have these aggregated.
- How much new for-sale + rental construction is in the pipeline within 1–3 miles? Heavy new supply typically softens prices + rents 12–24 months out; constrained supply supports both.
Investment metrics
- 1% rule
- 0.94% ✗
- Cap rate
- 7.76%
- Cash-on-cash
- 5.25%
- DSCR
- 1.23
- GRM
- 8.8
CMA / ARV
- ARV (median comp)
- $143,118
- List price
- $195,000
- Delta
- 36.25%
- Verdict
- OVERPRICED
- Comps
- 20 within 1.0 mi
Projected returns pro-forma
-3.0% appreciation · 5.48% rent growth · sell at horizon
- IRR
- -5.7%
- Equity multiple
- 0.78×
- Total profit
- $-11,749
- Equity at exit
- $29,075
- IRR
- 6.5%
- Equity multiple
- 1.54×
- Total profit
- $29,426
- Equity at exit
- $16,860
Cash invested: $54,600 (down + closing). Projections, not guarantees.
Landlord ↔ Tenant lean methodology
- Overall (STATE)
- 62 Landlord-Friendly
- State Pennsylvania
- 62 Landlord-Friendly · EVEN
- County
- — inherits STATE
- City
- — inherits STATE
ZIP-level market 18102
- Rents YoY
- 5.5%
- Active inventory
- 167
- Price-to-rent
- 8.8×
Monthly cashflow live
- Estimated rent
- $1,839 high interval (Pro) →
- Mortgage (P&I)
- −$1,023
- Tax from tax record
- −$110 /mo · $1,323/yr
- Insurance
- −$81
- HOA
- −$0
- Vacancy / Maint / Mgmt
- −$386
- Net cashflow
- $239
Break-even live
UW: 25.0% down · 7.5% · 30yr · 1.5% tax · 5.0% vac · 8.0% maint · 8.0% mgmt
Financing live
Cash to close
- Down payment
- $48,750
- Closing costs
- $5,850
- Reserves months
- —
- Total cash needed
- —
Loan-product check · same deal, 3 products live
Conventional
25% down · 7.5% · 30yr
- Down + closing
- —
- Monthly P&I
- —
- Monthly cashflow
- —
- DSCR
- —
- Eligible?
- —
Personal DTI + credit; lowest rate.
DSCR
20% down · 8.5% · 30yr
- Down + closing
- —
- Monthly P&I
- —
- Monthly cashflow
- —
- DSCR
- —
- Eligible?
- —
No personal income docs; deal must DSCR.
Hard money
10% down · 12.0% · 12mo
- Down + closing
- —
- Monthly P&I
- —
- Monthly cashflow
- —
- DSCR
- —
- Eligible?
- —
Short-term bridge; refi at stabilization.
Rent comps 40 comps
| Address | Beds | Baths | Sqft | Rent | $/sqft | DOM | Units | Dist |
|---|---|---|---|---|---|---|---|---|
| 944 W Gordon St Allentown, PA | 3.0 | 1.5 | 1146 | $1,750 | $1.53 | 23d | 1 | 0.04mi |
| 229 Peach St Allentown, PA | 3.0 | 2.0 | 882 | $1,800 | $2.04 | 14d | 1 | 0.18mi |
| 511 N Lumber St Allentown, PA | 4.0 | 1.0 | 756 | $2,200 | $2.91 | 14d | 1 | 0.20mi |
| 209 N Eighth St Apt 2 Allentown, PA | 3.0 | 1.0 | 1430 | $1,550 | $1.08 | 43d | 1 | 0.23mi |
| 440 N Hall St Unit 2 Allentown, PA | 2.0 | 1.0 | 989 | $1,400 | $1.42 | 43d | 1 | 0.24mi |
| 832 Chestnut St Allentown, PA | 3.0 | 1.0 | 1124 | $2,100 | $1.87 | 23d | 1 | 0.25mi |
| 829 Linden St Apt 1 Rear Allentown, PA | 2.0 | 2.0 | 1200 | $1,495 | $1.25 | 23d | 1 | 0.27mi |
| 827 Linden St Unit 829-1 Allentown, PA | 2.0 | 2.0 | 1200 | $1,495 | $1.25 | 21d | 1 | 0.28mi |
| 347 N 7th St Apt 3 Allentown, PA | 3.0 | 1.0 | 1200 | $1,500 | $1.25 | 43d | 1 | 0.29mi |
| 1039 E St Unit Linden St unit Apt Allentown, PA | 2.0 | 1.0 | 1200 | $1,500 | $1.25 | 23d | 1 | 0.30mi |
| 144 N 7th St Allentown, PA | 2.0 | 1.0 | 850 | $1,595 | $1.88 | 23d | 1 | 0.32mi |
| 45 N 11th St Unit 3 Allentown, PA | 2.0 | 1.0 | 900 | $1,250 | $1.39 | 2d | 1 | 0.32mi |
| 1036 Linden St #2 Allentown, PA | 2.0 | 1.0 | 1200 | $1,600 | $1.33 | 2d | 1 | 0.32mi |
| 25 N 10th St Allentown, PA | 2.0 | 1.0 | 717 | $1,475 | $2.06 | 43d | 1 | 0.32mi |
| 635 N Lumber St Allentown, PA | 3.0 | 1.5 | 1117 | $1,750 | $1.57 | 2d | 1 | 0.33mi |
| 622 W Chew St Unit 2 Allentown, PA | 3.0 | 1.0 | 1161 | $1,600 | $1.38 | 18d | 1 | 0.34mi |
| 915 Tilghman St Apt 4 Allentown, PA | 3.0 | 1.0 | 1250 | $1,750 | $1.40 | 23d | 1 | 0.35mi |
| 835 Hamilton St Unit 509 Allentown, PA | 2.0 | 2.0 | 1052 | $2,399 | $2.28 | 18d | 1 | 0.35mi |
| 626 Oak St Allentown, PA | 3.0 | 1.0 | 1396 | $1,900 | $1.36 | 43d | 1 | 0.36mi |
| 835 Hamilton St Unit 409 Allentown, PA | 2.0 | 2.0 | 1052 | $2,374 | $2.26 | 18d | 1 | 0.36mi |
| 835 Hamilton St Unit 608 Allentown, PA | 2.0 | 2.0 | 1411 | $2,725 | $1.93 | 14d | 1 | 0.36mi |
| 835 Hamilton St Unit 424 Allentown, PA | 2.0 | 2.0 | 1411 | $2,625 | $1.86 | 14d | 1 | 0.36mi |
| 1210 W Turner St Unit 2 Allentown, PA | 2.0 | 2.0 | 1500 | $2,150 | $1.43 | 23d | 1 | 0.36mi |
| 1210 W Turner St Unit 1 Allentown, PA | 2.0 | 2.0 | 1200 | $2,050 | $1.71 | 23d | 1 | 0.36mi |
| 1210 W Turner St Unit 1 Allentown, PA | 2.0 | 2.0 | 1200 | $1,800 | $1.50 | 2d | 1 | 0.36mi |
| 1210 W Turner St Unit 2 Allentown, PA | 2.0 | 2.0 | 1500 | $1,900 | $1.27 | 2d | 1 | 0.36mi |
| 1210 W Turner St Unit 1 Allentown, PA | 2.0 | 2.0 | 1200 | $2,300 | $1.92 | 43d | 1 | 0.36mi |
| 1210 W Turner St Unit 2 Allentown, PA | 2.0 | 2.0 | 1500 | $2,400 | $1.60 | 43d | 1 | 0.36mi |
| 621 W Turner St Apt 14 Allentown, PA | 3.0 | 1.0 | 800 | $1,395 | $1.74 | 23d | 1 | 0.37mi |
| 1106 Tilghman St Unit 1st floor Allentown, PA | 2.0 | 1.0 | 1000 | $1,250 | $1.25 | 43d | 1 | 0.37mi |
| 107 N 7th St Allentown, PA | 2.0 | 1.0–2.0 | 855 | $2,972 | $3.47 | 2d | 23 | 0.38mi |
| 1145 Linden St Apt 2 Allentown, PA | 3.0 | 1.0 | 971 | $1,525 | $1.57 | 23d | 1 | 0.38mi |
| 218 N 6th St Apt 3 Allentown, PA | 3.0 | 1.0 | 750 | $1,600 | $2.13 | 23d | 1 | 0.39mi |
| 27 N 7th St Allentown, PA | 2.0 | 1.0–2.0 | 840 | $2,222 | $2.64 | 2d | 11 | 0.40mi |
| 932 W Hamilton St Allentown, PA | 2.0 | 1.0–2.0 | 862 | $2,350 | $2.73 | 2d | 15 | 0.40mi |
| 528 N 6th St Allentown, PA | 3.0 | 1.0 | 967 | $1,700 | $1.76 | 14d | 1 | 0.41mi |
| 1010 W Hamilton St Allentown, PA | 1.0–2.0 | 1.0–2.0 | 943 | $2,022 | $2.14 | 2d | 6 | 0.42mi |
| 432 N Law St Allentown, PA | 4.0 | 1.0 | 1328 | $1,500 | $1.13 | 14d | 1 | 0.44mi |
| 814 Washington St #2 Allentown, PA | 4.0 | 1.0 | 1200 | $1,600 | $1.33 | 2d | 1 | 0.46mi |
| 26 N 6th St Allentown, PA | 1.0–2.0 | 1.0–2.0 | 953 | $2,224 | $2.33 | 2d | 9 | 0.47mi |
Listing history 37 events
-
2026-06-18days on market $195,000 Active 93 DOM
-
2026-06-17days on market $195,000 Active 92 DOM
-
2026-06-16days on market $195,000 Active 91 DOM
-
2026-06-15days on market $195,000 Active 90 DOM
-
2026-06-14days on market $195,000 Active 88 DOM
-
2026-06-10days on market $195,000 Active 85 DOM
-
2026-06-09days on market $195,000 Active 84 DOM
-
2026-06-08days on market $195,000 Active 83 DOM
-
2026-06-07days on market $195,000 Active 82 DOM
-
2026-06-03days on market $195,000 Active 78 DOM
-
2026-06-02days on market $195,000 Active 77 DOM
-
2026-06-01days on market $195,000 Active 76 DOM
-
2026-05-31days on market $195,000 Active 75 DOM
-
2026-05-31days on market $195,000 Active 74 DOM
-
2026-04-05historical $1,495
-
2026-03-17$195,000 Active 352-char remark
Show marketing remark (352 chars)
This 3-bedroom, 1-bath row home in Allentown is perfect for an owner-occupant or investor looking to place a tenant quickly. A great opportunity to customize or generate rental income right away. This property is also part of a portfolio of 9 single-family homes available for sale, offering added investment potential. Tenant is leased through 4/2027.
-
2026-03-05$1,495
-
2024-05-06historical $1,295
-
2024-04-25price $1,295
-
2024-04-17price $1,395
-
2024-01-04$1,425
-
2022-07-12soldstatus $121,000
-
2022-07-11soldstatus $121,000 Sold 287-char remark
Show marketing remark (287 chars)
This well kept SFH is now available. Very clean interior . Currently leased to good tenants who would love to stay. Vinyl plank floors throughout the first floor, hardwood on the second, and carpet on the third. Schedule your showing and make this home yours or add it to your portfolio.
-
2022-07-11soldstatus $121,000 Sold
Show marketing remark (287 chars)
This well kept SFH is now available. Very clean interior . Currently leased to good tenants who would love to stay. Vinyl plank floors throughout the first floor, hardwood on the second, and carpet on the third. Schedule your showing and make this home yours or add it to your portfolio.
-
2022-05-28status Pending
Show marketing remark (287 chars)
This well kept SFH is now available. Very clean interior . Currently leased to good tenants who would love to stay. Vinyl plank floors throughout the first floor, hardwood on the second, and carpet on the third. Schedule your showing and make this home yours or add it to your portfolio.
-
2022-05-28status Pending 287-char remark
Show marketing remark (287 chars)
This well kept SFH is now available. Very clean interior . Currently leased to good tenants who would love to stay. Vinyl plank floors throughout the first floor, hardwood on the second, and carpet on the third. Schedule your showing and make this home yours or add it to your portfolio.
-
2022-05-11$130,000 Active 287-char remark
Show marketing remark (287 chars)
This well kept SFH is now available. Very clean interior . Currently leased to good tenants who would love to stay. Vinyl plank floors throughout the first floor, hardwood on the second, and carpet on the third. Schedule your showing and make this home yours or add it to your portfolio.
-
2022-05-11$130,000 Active
Show marketing remark (287 chars)
This well kept SFH is now available. Very clean interior . Currently leased to good tenants who would love to stay. Vinyl plank floors throughout the first floor, hardwood on the second, and carpet on the third. Schedule your showing and make this home yours or add it to your portfolio.
-
2021-05-03soldstatus $75,000
-
2021-04-30soldstatus $75,000 Sold
-
2021-02-18status Pending
-
2021-02-09$69,900 Active
-
2007-03-09soldstatus $50,000
-
2007-01-18soldstatus $50,000
-
2006-06-19$49,900
-
2006-01-31historical
-
2005-09-21$64,900
ⓘ Source: listings_history table (triggers on properties + properties_extension) + one-shot
backfill from property_details.listing_events for pre-trigger history.
Tax reassessment forecast PA · Partial reset (capped growth)
- Current annual tax
- $1,323 · $110/mo
- Projected year-2 tax
- $2,202 · $184/mo
- Expected delta
- +$879/yr (+$73/mo · 66.4%)
ⓘ Screening estimate from a state-policy table — verify with the county assessor before closing.
Climate risk First Street
- Flood 5/10 Major FEMA zone X (unshaded) · 66% chance over 30 yrs
- Wildfire 1/10 Low
- Heat 5/10 Major 7 d/yr ≥99°F today · 15 d/yr by 30 yrs out
- Wind 4/10 Moderate 15% chance of damaging wind over 30 yrs
- Air quality 3/10 Moderate 3 unhealthy d/yr today · 4 by 30 yrs out
Nearby sold comps map
Loading sold comps map…
Walkable amenities ~0.75 mi
Loading nearby amenities…
Taxation est. · year 1
- Rental income
- $22,068
- − Mortgage interest
- −$10,923
- − Property taxes
- −$1,323
- − Insurance
- −$975
- − Repairs & maintenance
- −$1,765
- − Management
- −$1,765
- − Depreciation
- −$5,673
- Taxable loss
- −$357
- Est. tax savings @ 24.0%
- +$86
- After-tax cash flow
- $2,950/yr
For passive investors: Depreciation is non-cash, so a rental often shows a tax loss while cash-flowing — sheltering income. Rental losses are passive: they offset passive income freely, and up to $25,000/yr can offset ordinary (W-2) income if you actively participate and your MAGI is under $100k (phasing out to $0 by $150k); unused losses carry forward. On sale, claimed depreciation is recaptured at up to 25%, and gains may owe capital-gains tax (a 1031 exchange can defer both). Figures are a year-1 estimate at your 24.0% rate — not tax advice; consult a CPA.
Schools (NCES district)
- District
- Allentown City SD
- NCES district ID
- 4202280
- Math proficiency
- 10% ▼ -10.00%
- Reading proficiency
- 20% ▼ -15.00%
- Median HH income
- $36,337
- Composite
- 12.43/100
- National rank
- #9630
- State rank
- #513 of 539 in PA
Livability — Allentown
- Score
- 81/100
- State rank
- #171
- US rank
- #1440
Category grades
Schools grade is shown separately in the Schools card above.
Census & demographics
- Census place
- Allentown, PA
- County
- Lehigh County · 333,019 people
- City population
- 172,996
- Metro
- Allentown-Bethlehem-Easton, PA-NJ
- Population (ZIP)
- 51,001
- Household income
- $43,085
- Rent vs Own
- Severe rent burden
- 4313.0
Population outlook (Lehigh County) Hauer SSP2
- Today (2025)
- 392,957 people
- By 2030
- 408,319 · +3.9%
- By 2040
- 440,007 · +12.0%
- By 2050
- 475,940 · +21.1%
- By 2075
- 590,448 · +50.3%
- By 2100
- 690,314 · +75.7%
Race, ethnicity, and origin ACS 2023
- Neighborhood character
- Predominantly Hispanic (69%)
- Race & ethnicity
- Hispanic / Latino 69% Two or more races 28% White 18% Black 10%
- Hispanic origin (detail)
- Mexican 3% Puerto Rican 38% Dominican 22%
- Common ancestry
- Polish 1% Romanian 1% Hispanic 1%
- Foreign-born
- 22% · Canada, Jamaica
- Languages at home
- 45% English-only · Spanish 52% Arabic 2%
Political lean MEDSL · Lehigh
- 2024 margin
- Toss-up / Even · D 50.7% · R 48.0% · Other 1.2%
- 2008→2024 swing
- -12.9pp toward R · 2008: 15.6pp · 2024: 2.7pp
- All cycles
- 2024: D+2.7 2020: D+7.6 2016: D+4.4 2012: D+7.5 2008: D+15.6
Not yet ingested
- Civics
- —
Market trends
- HPI YoY
- ▼ -227.01%
- Current HPI
- 404.834
- Rent YoY
- ▲ 5.48%
- Metro
- Allentown-Bethlehem-Easton, PA-NJ
- State GDP YoY
- ▲ 1.68%
- F500 in state
- 34
Industry mix (Fortune 500 HQ in PA)
| Industry | F500 HQs | Revenue |
|---|---|---|
| Healthcare | 2 | $309B |
|
||
| Insurance | 2 | $27B |
|
||
| Telecommunications / Media | 1 | $124B |
|
||
| Industrial Distribution | 1 | $22B |
|
||
| Financial Services | 1 | $20B |
|
||
| Chemicals / Materials | 1 | $18B |
|
||
Price history
-97.7% since first listed23 events — show timeline
- 2026-04-05 Rental Removed $1,495 APPFOLIO
- 2026-03-17 Listed $195,000 GLVRMLS
- 2026-03-05 Listed for Rent $1,495 APPFOLIO
- 2024-05-06 Rental Removed $1,295 GLVRMLS
- 2024-04-25 Price Changed $1,295 GLVRMLS
- 2024-04-17 Price Changed $1,395 GLVRMLS
- 2024-01-04 Listed for Rent $1,425 GLVRMLS
- 2022-07-12 Sold (Public Records) $121,000 Public Records
- 2022-07-11 Sold (MLS) $121,000 GLVRMLS
- 2022-07-11 Sold (MLS) $121,000 GLVRMLS
- 2022-05-28 Pending — GLVRMLS
- 2022-05-28 Pending — GLVRMLS
- 2022-05-11 Listed $130,000 GLVRMLS
- 2022-05-11 Listed $130,000 GLVRMLS
- 2021-05-03 Sold (Public Records) $75,000 Public Records
- 2021-04-30 Sold (MLS) $75,000 GLVRMLS
- 2021-02-18 Pending — GLVRMLS
- 2021-02-09 Listed $69,900 GLVRMLS
- 2007-03-09 Sold (MLS) $50,000 GLVRMLS
- 2007-01-18 Sold (Public Records) $50,000 Public Records
- 2006-06-19 Listed $49,900 GLVRMLS
- 2006-01-31 Listing Removed — GLVRMLS
- 2005-09-21 Listed $64,900 GLVRMLS
Property tax history
-2.1%/yrLatest (2026): $1,323 · +0.7% YoY. Source: county tax records.
Cash-flow waterfall
monthlySold comps — $/sqft
last 12 mo · ≤1 miLoading sold comps…