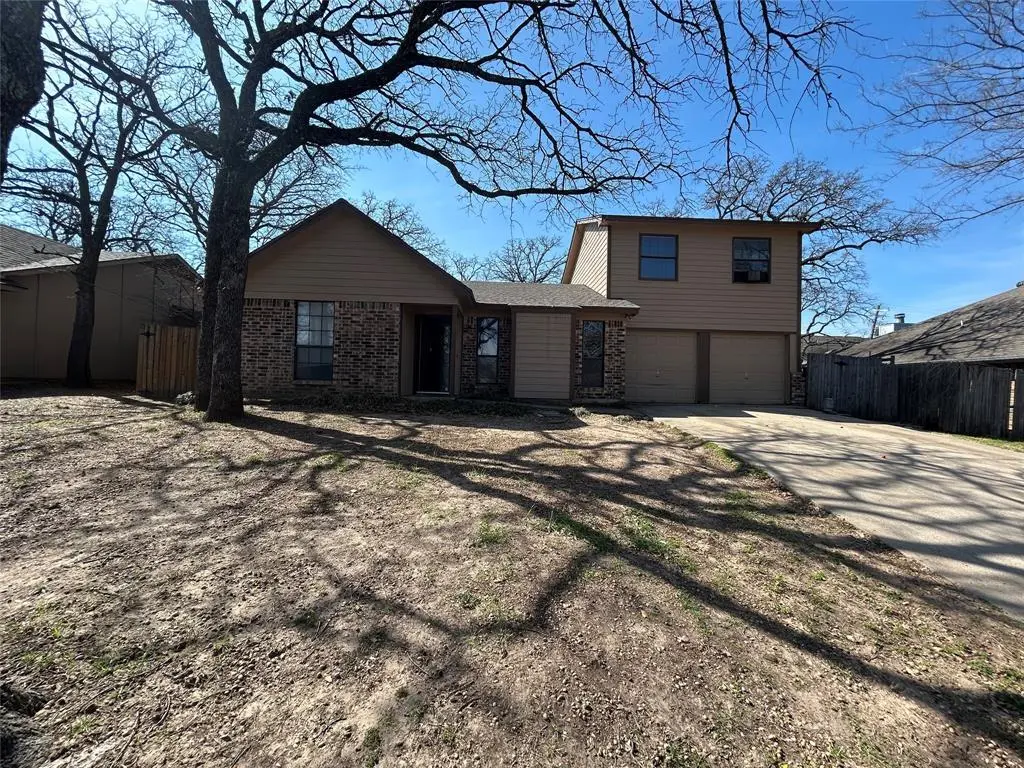
721 Timberoaks Dr · Azle, TX
Flood risk 1/10 · Minimal
- FEMA flood zone
- X (unshaded)
- Chance of flooding over 30 yrs
- 0.0%
- Est. flood insurance / yr
- $507 – $1,088
Fire risk 5/10 · Moderate
- Est. fire insurance / yr
- $1,222 – $2,270
Heat risk 7/10 · Major
- Hot days now (above 109°F)
- 7 days/yr
- Hot days in 30 yrs
- 22 days/yr
Wind risk 4/10 · Minor
- Chance of severe wind over 30 yrs
- 24.0%
Air-quality risk 2/10 · Minimal
- Unhealthy air days now
- 2 days/yr
- Unhealthy air days in 30 yrs
- 2 days/yr
Risk factors via First Street. Map © Google.
Why this score? — see what drove the D+ grade
The composite is a weighted blend of 9 inputs, each scored 0–100. Each bar is that input's sub-score; the figure is the points it added to the 100-point composite (weight × sub-score).
- ARV discount +15.0/15.0
- Cash flow +13.3/30.0
- 1% rule +4.3/10.0
- DSCR +4.0/10.0
- Schools +3.6/10.0
- Livability +3.6/5.0
- Rent growth +3.1/5.0
- Condition / age +2.5/5.0
- Appreciation +0.0/10.0
$199,000
🖨 Deal sheet (PDF) 📄 Offer letter ✓ Due diligence
Listing remarks
Priced to sell. As Is. Great for investment property or starter home. This home has lots of potential and is close to schools and Fort Worth. HOME HAS A 2YR OLD ROOF AND OUTSIDE SIDING AND PAINT. INSIDE AC UNIT IS 1 AND A HALF YRS OLD.
Key facts
- Outside siding
- 2yr old roof
- Inside ac unit
Tags
Property features AI
Finance
- Other: Listing is standard, exclusive right to sell; Possession at closing/funding
- Financial info: Acceptable financing: Cash, Conventional, FHA, VA
- HOA & community: No homeowners association
Exterior
- Parking: Attached garage with 2 garage spaces (garage faces front); Covered parking for 2 vehicles; Concrete driveway and enclosed garage
- Utilities: City water; City sewer; Cable available; Asphalt and concrete streets with curbs; Overhead utilities
- Home design: Single-family residence; Two levels; Residential property
- Construction: Built in 1983 (preowned); Brick and fiber cement exterior; Composition roof; Slab foundation
- Exterior features: Wood and other fencing; Few trees on lot; Easements for utilities
Interior
- Kitchen: Dishwasher; Disposal; Electric range; Other kitchen features listed
- Bedrooms: 3 bedrooms total; Primary bedroom on main level with walk-in closet (approx. 18 x 14)
- Flooring: Laminate flooring
- Bathrooms: 2 full bathrooms
- Heating & cooling: Central heating (electric); Central air conditioning; Ceiling fans; Window unit(s); Electric heating option
- Interior features: Vaulted ceilings; Cable TV available; Open living and dining areas (1 living area, 1 dining area); Room count listed as 2
- Laundry & utility: Washer/dryer connections and typical utilities available (specific laundry appliance not listed)
Neighborhood map
What this means for you Summary
Snapshot
- This is a 3-bed/2.0-bath single-family listed at $199k.
Deal economics
- At list price, monthly cash flow is $2 ($21/yr) — positive.
- The deal already cash-flows at list — no discount required.
- To meet the 1% rule (rent ≥ 1% of price), the offer needs to be $185k (6.8% below list).
- Recommended offer: $185k (6.8% below list) — sets the bar for 1% rule.
- Cap rate 6.3% vs local median 3.1% in Azle — top-decile yield for the area; either an underpriced asset or a hidden risk that comps aren't pricing in. Stress-test before assuming the spread holds.
Location & tenants
- Location reads 72/100 on livability (#267 in TX) — a middle-class / working-renter tenant base. Strengths: cost of living A+, housing A+, employment A; Watch: health & safety D+, amenities F, commute F.
- Azle ISD (suburban): math 37% / reading 43% proficiency, ranked #351 of 826 in TX (top 42%) — families likely to look elsewhere, expect single-tenant / working-renter base with shorter leases.
- Zoned schools: Walnut Creek El (math 37% / reading 46%, grade F, #1,437 of 4,322 statewide, top 34%, 632 students, 48% FRL); Santo Forte J H (math 28% / reading 41%, grade F, #858 of 1,662 statewide, top 54%, 514 students, 55% FRL); Azle H S (math 41% / reading 50%, grade D-, #634 of 1,632 statewide, top 39%, 2,054 students, 44% FRL) — zoned schools at 49% FRL track the district average.
- Market conditions: Rents rising (+2.3%/yr); 597 active listings in the ZIP; 25 comparable units currently listed for rent nearby; rentals at typical pace (median 15d on market — plan ~3-4 weeks tenant-placement turnaround); solid renter incomes; 18,938 units permitted in Tarrant County in 2024 (8,336 in 5+ unit buildings).
Forward outlook
- Local home prices are declining (-3.0%/yr); year-one equity from $1k of loan paydown is wiped out by about $6k of value loss. Plan a longer hold.
- Tarrant County population projected at +41% by 2050 — long-run rental-demand tailwind backs the buy-and-hold thesis.
Negotiation context
- Only 6 days on market — expect competitive offers; lowballing is unlikely to land.
- 4 sale attempts since 11y ago with the ask held roughly flat each time — persistent listings suggest the price (not the market) is what's stuck; bring a comps-based counter.
Risks & watch-outs
- Climate carrying-cost: moderate wildfire risk; extreme-heat days projected 7→22/yr by 2055 (HVAC capex compounding) — expect insurance premiums to compound above CPI over the hold.
Questions for the listing agent
- Is there a deadline driving the sale (1031 exchange, divorce, estate, relocation)? That informs how much negotiation room exists.
- The area grade is low — what's the realistic commute time and amenity access for the typical tenant pool here? Any planned neighborhood developments (good or bad) we should know about?
- What's the average days-on-market for RENTAL listings here right now (not sales)? A rising rental-DOM trend means longer vacancies and softer asking-rent achievability than the comps imply.
- What's the recent tenant-quality profile in this submarket — average credit score on applications, eviction rate, late-payment / NSF rate, and stable-employment percentage? A property-management company in the area should have these aggregated.
- How much new for-sale + rental construction is in the pipeline within 1–3 miles? Heavy new supply typically softens prices + rents 12–24 months out; constrained supply supports both.
Investment metrics
- 1% rule
- 0.93% ✗
- Cap rate
- 6.30%
- Cash-on-cash
- 0.04%
- DSCR
- 1.00
- GRM
- 8.9
CMA / ARV
- ARV (median comp)
- $265,710
- List price
- $199,000
- Delta
- -22.85%
- Verdict
- UNDERPRICED
- Comps
- 20 within 1.0 mi
Show comp detail 12 sales within ~0.75 mi
| Address | Dist | Beds/Ba | Sqft | Sold | Price | $/sf | Match |
|---|---|---|---|---|---|---|---|
| 705 Timberoaks Dr | 0.06mi | 3/2.0 | 1,442 (+5%) | 2mo | $269,000 | $187 | 87 |
| 749 Oak Park Dr | 0.28mi | 3/2.0 | 1,397 (+2%) | 4mo | $230,000 | $165 | 81 |
| 637 Inwood Rd | 0.23mi | 3/2.0 | 1,437 (+5%) | 1mo | $249,000 | $173 | 81 |
| 508 Logan Dr | 0.35mi | 3/2.0 | 1,405 (+2%) | 2mo | $250,000 | $178 | 78 |
| 705 Oak Park Dr | 0.23mi | 3/2.0 | 1,267 (-8%) | 0mo | $259,500 | $205 | 76 |
| 201 Pecan St | 0.45mi | 3/2.0 | 1,466 (+7%) | 2mo | $263,900 | $180 | 66 |
| 909 Red Bud Dr | 0.68mi | 3/2.0 | 1,431 (+4%) | 3mo | $225,000 | $157 | 58 |
| 1024 Red Oak St | 0.69mi | 3/2.0 | 1,456 (+6%) | 3mo | $259,000 | $178 | 56 |
| 1001 Rosebud Dr | 0.68mi | 3/2.0 | 1,493 (+9%) | 0mo | $230,000 | $154 | 54 |
| 904 Red Oak St | 0.50mi | 3/2.0 | 1,545 (+12%) | 3mo | $275,000 | $178 | 54 |
| 708 Vickie Dr | 0.61mi | 3/1.0 | 1,235 (-10%) | 2mo | $260,000 | $211 | 49 |
| 1008 Rosebud Dr | 0.68mi | 2/1.0 (-1) | 1,566 (+14%) | 6mo | $205,000 | $131 | 31 |
Match score weights: distance 35% · size 25% · config 20% · recency 20%. Top-matched comps best support the ARV.
Projected returns pro-forma
-3.0% appreciation · 2.31% rent growth · sell at horizon
- IRR
- -17.0%
- Equity multiple
- 0.40×
- Total profit
- $-33,332
- Equity at exit
- $29,672
- IRR
- -10.2%
- Equity multiple
- 0.39×
- Total profit
- $-33,723
- Equity at exit
- $17,206
Cash invested: $55,720 (down + closing). Projections, not guarantees.
Landlord ↔ Tenant lean methodology
- Overall (STATE)
- 87 Strongly Landlord-Friendly
- State Texas
- 87 Strongly Landlord-Friendly · R+5
- County
- — inherits STATE
- City
- — inherits STATE
ZIP-level market 76020
- Home prices YoY
- -20.6%
- Rents YoY
- 2.3%
- Active inventory
- 597
- Price-to-rent
- 8.9×
Monthly cashflow live
- Estimated rent
- $1,855 high interval (Pro) →
- Mortgage (P&I)
- −$1,044
- Tax from tax record
- −$337 /mo · $4,042/yr
- Insurance
- −$83
- HOA
- −$0
- Lot rent
- −$0
- Vacancy / Maint / Mgmt
- −$389
- Net cashflow
- $2
Break-even live
Sensitivity live
| Price | -10% $114 | -5% $58 | +0% $2 | +5% $-55 | +10% $-111 |
|---|---|---|---|---|---|
| Rent | -10% $-145 | -5% $-72 | +0% $2 | +5% $75 | +10% $148 |
| Rate | -1.0pp $102 | -0.5pp $52 | base $2 | +0.5pp $-50 | +1.0pp $-102 |
UW: 25.0% down · 7.5% · 30yr · 1.5% tax · 5.0% vac · 8.0% maint · 8.0% mgmt
Financing live
Cash to close
- Down payment
- $49,750
- Closing costs
- $5,970
- Reserves months
- —
- Total cash needed
- —
Loan-product check · same deal, 3 products live
Conventional
25% down · 7.5% · 30yr
- Down + closing
- —
- Monthly P&I
- —
- Monthly cashflow
- —
- DSCR
- —
- Eligible?
- —
Personal DTI + credit; lowest rate.
DSCR
20% down · 8.5% · 30yr
- Down + closing
- —
- Monthly P&I
- —
- Monthly cashflow
- —
- DSCR
- —
- Eligible?
- —
No personal income docs; deal must DSCR.
Hard money
10% down · 12.0% · 12mo
- Down + closing
- —
- Monthly P&I
- —
- Monthly cashflow
- —
- DSCR
- —
- Eligible?
- —
Short-term bridge; refi at stabilization.
Rent comps 25 comps
| Address | Beds | Baths | Sqft | Rent | $/sqft | DOM | Units | Dist |
|---|---|---|---|---|---|---|---|---|
| 745 Timberoaks Dr Azle, TX | 3.0 | 2.0 | 1304 | $1,865 | $1.43 | 6d | 1 | 0.12mi |
| 525 Commerce St Azle, TX | 1.0–3.0 | 1.0–2.0 | 852 | $1,405 | $1.65 | 0d | 1 | 0.21mi |
| 821 Timberoaks Dr Azle, TX | 3.0 | 2.0 | 1742 | $1,875 | $1.08 | 46d | 1 | 0.25mi |
| 316 Lochridge Dr Azle, TX | 2.0 | 2.0 | 1627 | $1,645 | $1.01 | 8d | 1 | 0.36mi |
| 424 Lochridge Dr Unit 424 Azle, TX | 3.0 | 2.0 | 1182 | $1,575 | $1.33 | 15d | 1 | 0.40mi |
| 1021 Timberoaks Dr Azle, TX | 1.0–2.0 | 1.0–1.5 | 792 | $1,250 | $1.58 | 0d | 16 | 0.45mi |
| 549 Dylan Ct Azle, TX | 3.0 | 2.0 | 1730 | $2,250 | $1.30 | 9d | 1 | 0.49mi |
| 515 W Main St Azle, TX | 2.0 | 1.0 | 1080 | $1,250 | $1.16 | 46d | 1 | 0.49mi |
| 527 W Main St Apt 40 Azle, TX | 2.0 | 1.0 | 1080 | $1,250 | $1.16 | 46d | 1 | 0.51mi |
| 605 Madeline Ct Azle, TX | 3.0 | 2.5 | 1714 | $2,400 | $1.40 | 46d | 1 | 0.51mi |
| 700 Stribling Cir Azle, TX | 3.0 | 2.0 | 1311 | $1,659 | $1.27 | 19d | 1 | 0.60mi |
| 912 Red Bud Dr Azle, TX | 3.0 | 1.0 | 1378 | $1,750 | $1.27 | 0d | 1 | 0.65mi |
| 728 Poe St Azle, TX | 3.0 | 2.0 | 1249 | $1,675 | $1.34 | 27d | 1 | 0.87mi |
| 444 Windsail Ln Azle, TX | 3.0 | 2.0 | 1811 | $2,500 | $1.38 | 46d | 1 | 0.93mi |
| 617 Park St Azle, TX | 3.0 | 2.0 | 1650 | $1,995 | $1.21 | 14d | 1 | 0.94mi |
| 1032 Greg St Azle, TX | 2.0 | 2.0 | 1200 | $1,695 | $1.41 | 21d | 1 | 1.06mi |
| 108 Parkwood Ct Azle, TX | 3.0 | 2.0 | 1226 | $1,899 | $1.55 | 5d | 1 | 1.08mi |
| 220 School St Azle, TX | 3.0 | 2.0 | 1423 | $1,895 | $1.33 | 46d | 1 | 1.09mi |
| 1002 N Stewart St Azle, TX | 3.0 | 1.0 | 1119 | $1,400 | $1.25 | 46d | 1 | 1.12mi |
| 213 Asheville St Azle, TX | 4.0 | 2.0 | 1678 | $2,300 | $1.37 | 46d | 1 | 1.16mi |
| 228 N Jarvis Ln Azle, TX | 3.0 | 2.0 | 1618 | $1,950 | $1.21 | 27d | 1 | 1.27mi |
| 228 N Jarvis Ln Azle, TX | 3.0 | 2.0 | 1618 | $1,950 | $1.21 | 8d | 1 | 1.27mi |
| 216 Post Oak St Azle, TX | 3.0 | 2.0 | 1581 | $1,995 | $1.26 | 15d | 1 | 1.41mi |
| 1329 Fox Hollow Ct Azle, TX | 2.0 | 1.0 | 924 | $900 | $0.97 | 8d | 1 | 1.47mi |
| 657 Cameron Way Azle, TX | 4.0 | 2.0 | 1768 | $2,150 | $1.22 | 15d | 1 | 1.49mi |
Listing history 22 events
-
2026-06-22days on market $199,000 Active 6 DOM
-
2026-06-21days on market $199,000 Active 5 DOM
-
2026-06-18days on market $199,000 Active 2 DOM
-
2026-06-17remarks 235-char remark
-
2026-06-17pricedays on market $199,000 Active 1 DOM
-
2026-06-04days on market $205,000 Active 59 DOM
-
2026-06-03days on market $205,000 Active 58 DOM
-
2026-06-02days on market $205,000 Active 57 DOM
-
2026-06-01days on market $205,000 Active 56 DOM
-
2026-05-31days on market $205,000 Active 55 DOM
-
2026-05-14price $219,000 226-char remark
-
2026-04-27price $235,900 226-char remark
-
2026-04-06$245,900 Active 226-char remark
-
2026-04-02historical
-
2026-03-20price $254,000
-
2026-03-02$259,000 Active
-
2023-01-13soldstatus
-
2015-09-10soldstatus
-
2015-09-04soldstatus Sold
-
2015-08-28status Pending
-
2015-08-17$96,180 Active
-
1983-10-11soldstatus
ⓘ Source: listings_history table (triggers on properties + properties_extension) + one-shot
backfill from property_details.listing_events for pre-trigger history.
Tax reassessment forecast TX · Resets to sale price
- Current annual tax
- $4,042 · $337/mo
- Projected year-2 tax
- $4,042 · $337/mo
- Expected delta
- $0/yr ($0/mo · -0.0%)
ⓘ Screening estimate from a state-policy table — verify with the county assessor before closing.
Climate risk First Street
- Flood 1/10 Low FEMA zone X (unshaded) · 0% chance over 30 yrs
- Wildfire 5/10 Major
- Heat 7/10 Severe 7 d/yr ≥109°F today · 22 d/yr by 30 yrs out
- Wind 4/10 Moderate 24% chance of damaging wind over 30 yrs
- Air quality 2/10 Low 2 unhealthy d/yr today · 2 by 30 yrs out
Nearby sold comps map
Loading sold comps map…
Walkable amenities ~0.75 mi
Loading nearby amenities…
Taxation est. · year 1
- Rental income
- $22,254
- − Mortgage interest
- −$11,147
- − Property taxes
- −$4,042
- − Insurance
- −$995
- − Repairs & maintenance
- −$1,780
- − Management
- −$1,780
- − Depreciation
- −$5,789
- Taxable loss
- −$3,280
- Est. tax savings @ 24.0%
- +$787
- After-tax cash flow
- $808/yr
For passive investors: Depreciation is non-cash, so a rental often shows a tax loss while cash-flowing — sheltering income. Rental losses are passive: they offset passive income freely, and up to $25,000/yr can offset ordinary (W-2) income if you actively participate and your MAGI is under $100k (phasing out to $0 by $150k); unused losses carry forward. On sale, claimed depreciation is recaptured at up to 25%, and gains may owe capital-gains tax (a 1031 exchange can defer both). Figures are a year-1 estimate at your 24.0% rate — not tax advice; consult a CPA.
Schools (NCES district)
- District
- Azle ISD
- NCES district ID
- 4809200
- Math proficiency
- 37% ▼ -11.00%
- Reading proficiency
- 43% ▼ -5.00%
- Median HH income
- $61,473
- Composite
- 35.57/100
- National rank
- #4900
- State rank
- #351 of 826 in TX
Livability — Azle
- Score
- 72/100
- State rank
- #267
- US rank
- #6239
Category grades
Schools grade is shown separately in the Schools card above.
Census & demographics
- Census place
- Azle, TX
- County
- Parker County · 144,797 people
- City population
- 34,602
- Metro
- Dallas-Fort Worth-Arlington, TX
- Population (ZIP)
- 34,602
- Household income
- $87,298
- Rent vs Own
- Severe rent burden
- 433.0
Population outlook (Tarrant County) Hauer SSP2
- Today (2025)
- 2,380,417 people
- By 2030
- 2,578,900 · +8.3%
- By 2040
- 2,974,995 · +25.0%
- By 2050
- 3,350,489 · +40.8%
- By 2075
- 4,216,909 · +77.2%
- By 2100
- 4,741,527 · +99.2%
Race, ethnicity, and origin ACS 2023
- Neighborhood character
- Predominantly White (78%)
- Race & ethnicity
- White 78% Hispanic / Latino 18% Two or more races 9% Black 1%
- Hispanic origin (detail)
- Mexican 15%
- Common ancestry
- Slovak 2% Italian 1% Portuguese 1%
- Foreign-born
- 5% · Canada
- Languages at home
- 89% English-only · Spanish 11%
Political lean MEDSL · Tarrant
- 2024 margin
- Lean R (+5.1) · D 46.7% · R 51.9% · Other 1.4%
- 2008→2024 swing
- +6.6pp toward D · 2008: -11.7pp · 2024: -5.1pp
- All cycles
- 2024: R+5.1 2020: D+0.2 2016: R+8.7 2012: R+15.7 2008: R+11.7
Not yet ingested
- Civics
- —
Market trends
- HPI YoY
- ▼ -74.72%
- Current HPI
- 287.155
- Rent YoY
- ▲ 2.31%
- Metro
- Dallas-Fort Worth-Arlington, TX
- State GDP YoY
- ▲ 3.95%
- F500 in state
- 110
Industry mix (Fortune 500 HQ in TX)
| Industry | F500 HQs | Revenue |
|---|---|---|
| Energy | 16 | $1,198B |
|
||
| Technology | 5 | $198B |
|
||
| Engineering / Construction | 4 | $72B |
|
||
| Energy Services | 3 | $60B |
|
||
| Utilities | 3 | $41B |
|
||
| Healthcare | 2 | $330B |
|
||
Price history
+106.9% since first listed14 events — show timeline
- 2026-06-16 Listed $199,000 NTREIS
- 2026-05-26 Price Changed $205,000 NTREIS
- 2026-05-14 Price Changed $219,000 NTREIS
- 2026-04-27 Price Changed $235,900 NTREIS
- 2026-04-06 Listed $245,900 NTREIS
- 2026-04-02 Listing Removed — NTREIS
- 2026-03-20 Price Changed $254,000 NTREIS
- 2026-03-02 Listed $259,000 NTREIS
- 2023-01-13 Sold (Public Records) — Public Records
- 2015-09-10 Sold (Public Records) — Public Records
- 2015-09-04 Sold (MLS) — NTREIS
- 2015-08-28 Pending — NTREIS
- 2015-08-17 Listed $96,180 NTREIS
- 1983-10-11 Sold (Public Records) — Public Records
Property tax history
+3.6%/yrLatest (2025): $4,042 · -17.6% YoY. Source: county tax records.
Cash-flow waterfall
monthlySold comps — $/sqft
last 12 mo · ≤1 miLoading sold comps…