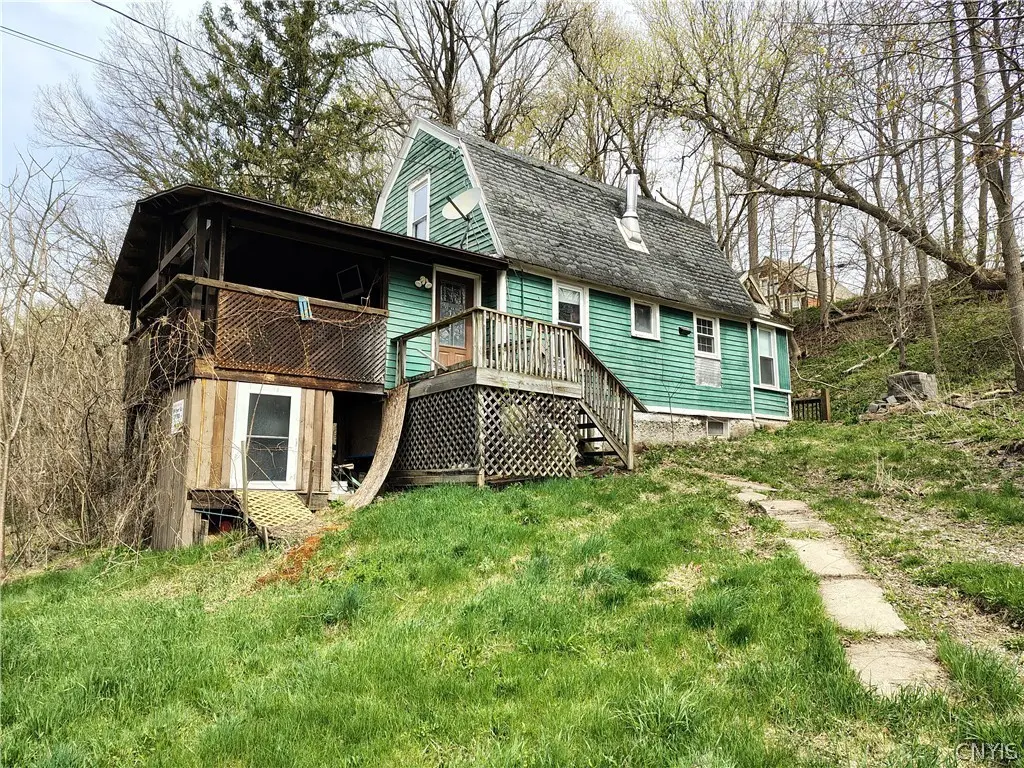
114 Piper Rd · East Herkimer, NY
Flood risk 1/10 · Minimal
- FEMA flood zone
- X
- Chance of flooding over 30 yrs
- 0.0%
- Est. flood insurance / yr
- $473 – $860
Fire risk 1/10 · Minimal
- Est. fire insurance / yr
- $691 – $1,283
Heat risk 2/10 · Minimal
- Hot days now (above 97°F)
- 7 days/yr
- Hot days in 30 yrs
- 16 days/yr
Wind risk 2/10 · Minimal
- Chance of severe wind over 30 yrs
- 1.0%
Air-quality risk 1/10 · Minimal
- Unhealthy air days now
- 0 days/yr
- Unhealthy air days in 30 yrs
- 0 days/yr
Risk factors via First Street. Map © Google.
Why this score? — see what drove the C- grade
The composite is a weighted blend of 9 inputs, each scored 0–100. Each bar is that input's sub-score; the figure is the points it added to the 100-point composite (weight × sub-score).
- Cash flow +15.0/30.0
- Appreciation +10.0/10.0
- ARV discount +7.5/15.0
- 1% rule +5.0/10.0
- DSCR +5.0/10.0
- Schools +3.9/10.0
- Rent growth +2.5/5.0
- Livability +2.5/5.0
- Condition / age +2.5/5.0
$29,900
🖨 Deal sheet 📄 Offer letter ✓ Due diligence
Listing remarks MLS
3 bed 1 bath home offering over 1400sqft with great potential for the right buyer. . The property is sold As-Is condition, Seller has no knowledge, priced to sell. Located right off of route 5. Short term seller financing options available.
Key facts
- 0.68 acre lot
- Parking
- Built 1940
Neighborhood map
What this means for you Summary
Snapshot
- This is a 3-bed/1.0-bath single-family listed at $30k.
Deal economics
- At list price, monthly cash flow is $1k ($14k/yr) — positive.
- The deal already cash-flows at list — no discount required.
- Meets the 1% rule at list price ($2k rent vs $30k).
- Recommended offer: $27k (9.0% below list) — sets the bar for market timing.
Location & tenants
- Location reads: area grade C — affects rentability + tenant quality, not the cash-flow math above.
- Herkimer Central School District (town): math 46% / reading 47% proficiency, ranked #455 of 590 in NY (top 77%) — families likely to look elsewhere, expect single-tenant / working-renter base with shorter leases.
- Market conditions: 56 active listings in the ZIP; 1 comparable units currently listed for rent nearby; 54 units permitted in Herkimer County in 2024 (0 in 5+ unit buildings).
Forward outlook
- In year one you build about $3k of equity ($207 loan paydown + $3k appreciation (10.0% local appreciation)).
- Herkimer County population projected at -24% by 2050 — secular population decline; favor cash flow + early exit over multi-decade hold.
- At projected returns (10.0% appreciation + 3.0% rent growth), your $8k cash investment doubles in ~1 year — after that, you're playing with house money.
- By year 9, paydown + projected appreciation supports a ~$33k cash-out refi (75% LTV) — recoverable capital for the next deal without selling this one.
Negotiation context
- It's been on market 106 days — a 9% lower offer ($27k) is reasonable based on typical stale-listing flexibility.
Risks & watch-outs
- Watch-outs: built in 1940 — expect roof / HVAC / electrical / plumbing capex.
Questions for the listing agent
- It's been on market 106 days. Have you received any prior offers? Is the seller open to a 9% concession, seller financing, or rate buy-down credit?
- Built in 1940 — when were the roof, HVAC, electrical panel, plumbing, and water heater last replaced?
- Why hasn't it sold? Are there any deal-killer items the seller is aware of (foundation, flood, title, zoning, code violations)?
- Is there a deadline driving the sale (1031 exchange, divorce, estate, relocation)? That informs how much negotiation room exists.
- What's the average days-on-market for RENTAL listings here right now (not sales)? A rising rental-DOM trend means longer vacancies and softer asking-rent achievability than the comps imply.
- What's the recent tenant-quality profile in this submarket — average credit score on applications, eviction rate, late-payment / NSF rate, and stable-employment percentage? A property-management company in the area should have these aggregated.
- How much new for-sale + rental construction is in the pipeline within 1–3 miles? Heavy new supply typically softens prices + rents 12–24 months out; constrained supply supports both.
Investment metrics
- 1% rule
- 5.69% ✓
- Cap rate
- 51.90%
- Cash-on-cash
- 162.88%
- DSCR
- 8.25
- GRM
- 1.5
CMA / ARV
- ARV (median comp)
- $166,969
- List price
- $29,900
- Delta
- -82.09%
- Verdict
- UNDERPRICED
- Comps
- 20 within 1.0 mi
Show comp detail 12 sales within ~0.75 mi
| Address | Dist | Beds/Ba | Sqft | Sold | Price | $/sf | Match |
|---|---|---|---|---|---|---|---|
| 352 Eureka Ave | 0.48mi | 3/1.5 | 1,386 (-3%) | 12mo | $110,000 | $79 | 60 |
| 171 Main Rd | 0.32mi | 4/1.0 (+1) | 1,568 (+10%) | 5mo | $146,000 | $93 | 60 |
| 101 East St | 0.44mi | 3/1.0 | 1,350 (-6%) | 12mo | $130,000 | $96 | 59 |
| 308 West St | 0.32mi | 4/2.0 (+1) | 1,324 (-8%) | 8mo | $214,000 | $162 | 57 |
| 401 Harter St | 0.61mi | 3/2.0 | 1,520 (+6%) | 5mo | $193,000 | $127 | 53 |
| 318 Gray St | 0.61mi | 3/1.0 | 1,316 (-8%) | 11mo | $145,500 | $111 | 49 |
| 404 Palisade St | 0.39mi | 3/1.5 | 1,232 (-14%) | 11mo | $205,000 | $166 | 47 |
| 110 Zoller Ave | 0.69mi | 3/2.0 | 1,340 (-6%) | 9mo | $205,100 | $153 | 46 |
| 349 Gray St | 0.65mi | 2/1.0 (-1) | 1,344 (-6%) | 13mo | $155,000 | $115 | 44 |
| 334 Gray St | 0.63mi | 4/1.5 (+1) | 1,536 (+7%) | 10mo | $201,400 | $131 | 43 |
| 515 W Lake Ave | 0.75mi | 4/1.5 (+1) | 1,633 (+14%) | 4mo | $109,900 | $67 | 31 |
| 310 E German St | 0.72mi | 4/1.0 (+1) | 1,624 (+14%) | 11mo | $150,000 | $92 | 30 |
Match score weights: distance 35% · size 25% · config 20% · recency 20%. Top-matched comps best support the ARV.
Projected returns pro-forma
10.0% appreciation · 3.0% rent growth · sell at horizon
- IRR
- —
- Equity multiple
- 11.59×
- Total profit
- $88,686
- Equity at exit
- $26,936
- IRR
- —
- Equity multiple
- 25.40×
- Total profit
- $204,300
- Equity at exit
- $58,089
Cash invested: $8,372 (down + closing). Projections, not guarantees.
Landlord ↔ Tenant lean methodology
- Overall (STATE)
- 15 Strongly Tenant-Friendly
- State New York
- 15 Strongly Tenant-Friendly · D+10
- County
- — inherits STATE
- City
- — inherits STATE
ZIP-level market 13350
- Home prices YoY
- 8.9%
- Active inventory
- 56
- Price-to-rent
- 1.5×
Monthly cashflow live
- Estimated rent
- $1,700 medium interval (Pro) →
- Mortgage (P&I)
- −$157
- Tax est. 1.5%
- −$37 /mo · $448/yr
- Insurance
- −$12
- HOA
- −$0
- Vacancy / Maint / Mgmt
- −$357
- Net cashflow
- $1,136
Break-even live
UW: 25.0% down · 7.5% · 30yr · 1.5% tax · 5.0% vac · 8.0% maint · 8.0% mgmt
Financing live
Cash to close
- Down payment
- $7,475
- Closing costs
- $897
- Reserves months
- —
- Total cash needed
- —
Loan-product check · same deal, 3 products live
Conventional
25% down · 7.5% · 30yr
- Down + closing
- —
- Monthly P&I
- —
- Monthly cashflow
- —
- DSCR
- —
- Eligible?
- —
Personal DTI + credit; lowest rate.
DSCR
20% down · 8.5% · 30yr
- Down + closing
- —
- Monthly P&I
- —
- Monthly cashflow
- —
- DSCR
- —
- Eligible?
- —
No personal income docs; deal must DSCR.
Hard money
10% down · 12.0% · 12mo
- Down + closing
- —
- Monthly P&I
- —
- Monthly cashflow
- —
- DSCR
- —
- Eligible?
- —
Short-term bridge; refi at stabilization.
Rent comps 1 comps
| Address | Beds | Baths | Sqft | Rent | $/sqft | DOM | Units | Dist |
|---|---|---|---|---|---|---|---|---|
| 502 Lake St Herkimer, NY | 3.0 | 1.0 | 1125 | $1,700 | $1.51 | 43d | 1 | 0.71mi |
Listing history 6 events
-
2026-05-15status Pending 240-char remark
Show marketing remark (240 chars)
3 bed 1 bath home offering over 1400sqft with great potential for the right buyer. . The property is sold As-Is condition, Seller has no knowledge, priced to sell. Located right off of route 5. Short term seller financing options available.
-
2026-04-19price $29,900 240-char remark
Show marketing remark (240 chars)
3 bed 1 bath home offering over 1400sqft with great potential for the right buyer. . The property is sold As-Is condition, Seller has no knowledge, priced to sell. Located right off of route 5. Short term seller financing options available.
-
2026-04-13price $32,900 240-char remark
Show marketing remark (240 chars)
3 bed 1 bath home offering over 1400sqft with great potential for the right buyer. . The property is sold As-Is condition, Seller has no knowledge, priced to sell. Located right off of route 5. Short term seller financing options available.
-
2026-03-18price $34,900 240-char remark
Show marketing remark (240 chars)
3 bed 1 bath home offering over 1400sqft with great potential for the right buyer. . The property is sold As-Is condition, Seller has no knowledge, priced to sell. Located right off of route 5. Short term seller financing options available.
-
2026-02-20price $37,900 240-char remark
Show marketing remark (240 chars)
3 bed 1 bath home offering over 1400sqft with great potential for the right buyer. . The property is sold As-Is condition, Seller has no knowledge, priced to sell. Located right off of route 5. Short term seller financing options available.
-
2026-01-29$39,900 Active 240-char remark
Show marketing remark (240 chars)
3 bed 1 bath home offering over 1400sqft with great potential for the right buyer. . The property is sold As-Is condition, Seller has no knowledge, priced to sell. Located right off of route 5. Short term seller financing options available.
ⓘ Source: listings_history table (triggers on properties + properties_extension) + one-shot
backfill from property_details.listing_events for pre-trigger history.
Climate risk First Street
- Flood 1/10 Low FEMA zone X · 0% chance over 30 yrs
- Wildfire 1/10 Low
- Heat 2/10 Low 7 d/yr ≥97°F today · 16 d/yr by 30 yrs out
- Wind 2/10 Low 100% chance of damaging wind over 30 yrs
- Air quality 1/10 Low 0 unhealthy d/yr today · 0 by 30 yrs out
Nearby sold comps map
Loading sold comps map…
Walkable amenities ~0.75 mi
Loading nearby amenities…
Taxation est. · year 1
- Rental income
- $20,400
- − Mortgage interest
- −$1,675
- − Property taxes
- −$448
- − Insurance
- −$150
- − Repairs & maintenance
- −$1,632
- − Management
- −$1,632
- − Depreciation
- −$870
- Taxable income
- $13,993
- Est. tax owed @ 24.0%
- −$3,358
- After-tax cash flow
- $10,278/yr
For passive investors: Depreciation is non-cash, so a rental often shows a tax loss while cash-flowing — sheltering income. Rental losses are passive: they offset passive income freely, and up to $25,000/yr can offset ordinary (W-2) income if you actively participate and your MAGI is under $100k (phasing out to $0 by $150k); unused losses carry forward. On sale, claimed depreciation is recaptured at up to 25%, and gains may owe capital-gains tax (a 1031 exchange can defer both). Figures are a year-1 estimate at your 24.0% rate — not tax advice; consult a CPA.
Schools (NCES district)
- District
- Herkimer Central School District
- NCES district ID
- 3614220
- Math proficiency
- 46% ▲ 6.00%
- Reading proficiency
- 47% ▲ 9.00%
- Median HH income
- $39,447
- Composite
- 38.87/100
- National rank
- #4100
- State rank
- #455 of 590 in NY
Livability — East Herkimer
No livability data for this city. (Only ~50 U.S. cities are tracked.)
Census & demographics
- Census place
- East Herkimer, NY
- Population (ZIP)
- 9,641
Population outlook (Herkimer County) Hauer SSP2
- Today (2025)
- 59,340 people
- By 2030
- 56,838 · -4.2%
- By 2040
- 51,098 · -13.9%
- By 2050
- 45,080 · -24.0%
- By 2075
- 32,648 · -45.0%
- By 2100
- 22,266 · -62.5%
Race, ethnicity, and origin ACS 2023
- Neighborhood character
- Predominantly White (90%)
- Race & ethnicity
- White 90% Two or more races 5% Black 2% Asian 2% Hispanic / Latino 1%
- Common ancestry
- Romanian 9% Lithuanian 4% Italian 3%
- Foreign-born
- 4% · Canada, China
- Languages at home
- 92% English-only · French/Haitian/Cajun 2% Other Asian/Pacific 1% Spanish 1%
Political lean MEDSL · Herkimer
- 2024 margin
- Solid R (+36.4) · D 31.8% · R 68.2%
- 2008→2024 swing
- -27.1pp toward R · 2008: -9.3pp · 2024: -36.4pp
- All cycles
- 2024: R+36.4 2020: R+30.5 2016: R+34.5 2012: R+8.4 2008: R+9.3
Not yet ingested
- Civics
- —
Market trends
- HPI YoY
- ▲ 26.43%
- Current HPI
- 324.4601
- Rent YoY
- —
- Metro
- —
- State GDP YoY
- ▲ 2.60%
- F500 in state
- 92
Industry mix (Fortune 500 HQ in NY)
| Industry | F500 HQs | Revenue |
|---|---|---|
| Financial Services | 10 | $950B |
|
||
| Consumer Goods | 9 | $162B |
|
||
| Insurance | 4 | $225B |
|
||
| Telecommunications | 2 | $144B |
|
||
| Pharmaceuticals | 2 | $112B |
|
||
| Media / Entertainment | 2 | $69B |
|
||
Price history
-25.1% since first listed6 events — show timeline
- 2026-05-15 Pending — CNYIS
- 2026-04-19 Price Changed $29,900 CNYIS
- 2026-04-13 Price Changed $32,900 CNYIS
- 2026-03-18 Price Changed $34,900 CNYIS
- 2026-02-20 Price Changed $37,900 CNYIS
- 2026-01-29 Listed $39,900 CNYIS
Property tax history
+2.1%/yrLatest (2025): $2,652 · +2.3% YoY. Source: county tax records.
Cash-flow waterfall
monthlySold comps — $/sqft
last 12 mo · ≤1 miLoading sold comps…