822 Lark Ln · Otisville, NY
Flood risk 1/10 · Minimal
- FEMA flood zone
- X (unshaded)
- Chance of flooding over 30 yrs
- 0.0%
- Est. flood insurance / yr
- $507 – $1,088
Fire risk 4/10 · Minor
- Est. fire insurance / yr
- $691 – $1,283
Heat risk 4/10 · Minor
- Hot days now (above 96°F)
- 7 days/yr
- Hot days in 30 yrs
- 16 days/yr
Wind risk 3/10 · Minor
- Chance of severe wind over 30 yrs
- 8.0%
Air-quality risk 2/10 · Minimal
- Unhealthy air days now
- 1 days/yr
- Unhealthy air days in 30 yrs
- 2 days/yr
Risk factors via First Street. Map © Google.
Why this score? — see what drove the C- grade
The composite is a weighted blend of 9 inputs, each scored 0–100. Each bar is that input's sub-score; the figure is the points it added to the 100-point composite (weight × sub-score).
- Cash flow +15.0/30.0
- ARV discount +7.5/15.0
- 1% rule +5.0/10.0
- DSCR +5.0/10.0
- Appreciation +5.0/10.0
- Schools +3.9/10.0
- Livability +3.5/5.0
- Condition / age +2.8/5.0
- Rent growth +2.5/5.0
$50,000
🖨 Deal sheet 📄 Offer letter ✓ Due diligence
Listing remarks
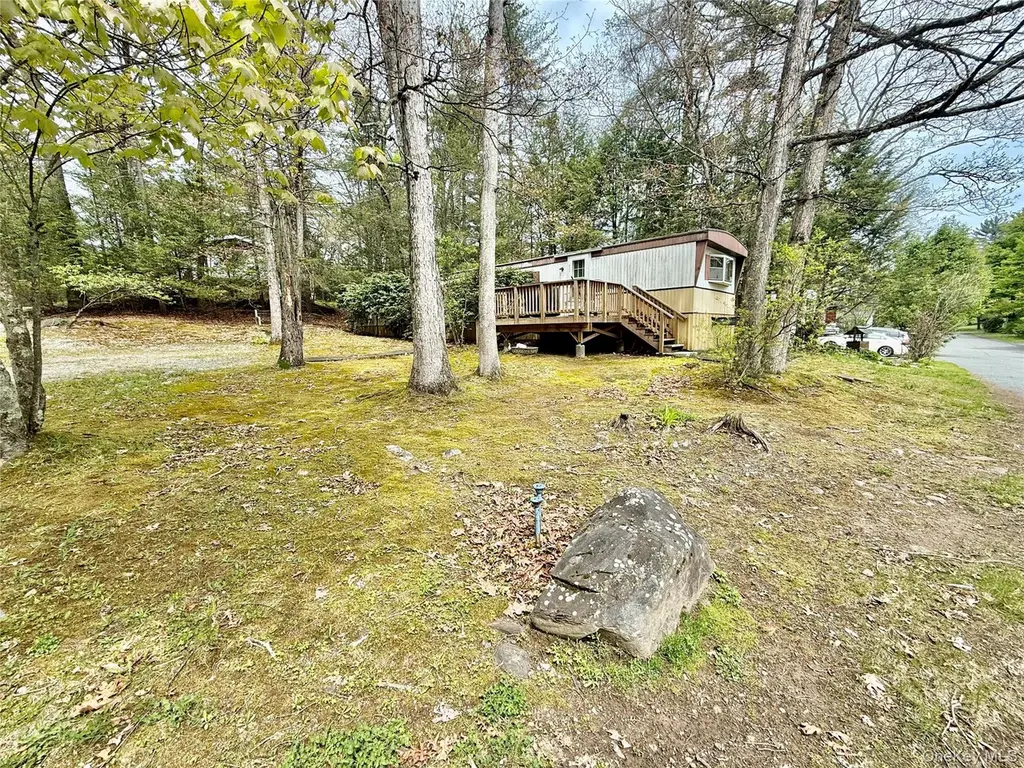
Charming manufactured home located in the peaceful community of Cuddebackville, NY on a corner lot! Offering 3 bedroom and 1 bath, this well-maintained property offers comfortable one-level living with a bright and inviting layout. Enjoy a spacious living area, functional kitchen with ample cabinet space, and cozy bedrooms designed for everyday comfort. Outside, the property provides room to relax, garden, or entertain while enjoying the quiet surroundings of the Hudson Valley countryside. Conveniently located near hiking trails, the Delaware River, commuter routes, and local shopping, this home is perfect as a full-time residence, weekend getaway, or affordable investment opportunity. A gr
Key facts
- Functional kitchen
- Spacious living area
- Ample cabinet space
Tags
Property features AI
Finance
- HOA & community: Has association (Pine Grive); Association fee $660 per month; Association fee includes water and sewer
Exterior
- Parking: Driveway
- Utilities: Electric service by Orange & Rockland; Water connected; Sewer connected (shared septic); Cable connected; Electricity connected
- Home design: Mobile home
- Construction: Aluminum siding
- Exterior features: Cleared lot; Corner lot; Not waterfront
Interior
- Kitchen: Gas range; Refrigerator
- Bedrooms: Bedroom on the first floor
- Bathrooms: One full bathroom
- Heating & cooling: Forced air heating; No central air
- Interior features: First-floor bedroom; First-floor full bathroom; Eat-in kitchen; Seven total rooms
Neighborhood map
What this means for you Summary
Snapshot
- This is a 3-bed/1.0-bath manufactured listed at $50k. Condition is rated average.
Deal economics
- At list price, monthly cash flow is $981 ($12k/yr) — positive.
- The deal already cash-flows at list — no discount required.
- Meets the 1% rule at list price ($3k rent vs $50k).
- Recommended offer: $48k (3.0% below list) — sets the bar for market timing.
- Cap rate 29.8% vs local median 2.4% in Otisville — top-decile yield for the area; either an underpriced asset or a hidden risk that comps aren't pricing in. Stress-test before assuming the spread holds.
Location & tenants
- Location reads 70/100 on livability (#459 in NY) — a middle-class / working-renter tenant base. Strengths: employment A+, housing A+, crime A; Watch: amenities F, commute F.
- Port Jervis City School District (rural): math 43% / reading 50% proficiency, ranked #451 of 590 in NY (top 76%) — families likely to look elsewhere, expect single-tenant / working-renter base with shorter leases.
- Zoned schools: N A Hamilton Bicentennial School (math 42% / reading 62%, grade C-, #988 of 2,108 statewide, top 49%, 464 students, 54% FRL); Port Jervis Middle School (math 22% / reading 35%, grade F, #569 of 729 statewide, top 78%, 379 students, 59% FRL); Port Jervis Senior High School (math 87% / reading 95%, grade A+, #203 of 1,100 statewide, top 20%, 750 students, 55% FRL) — zoned schools at 56% FRL track the district average.
- Market conditions: 20 active listings in the ZIP; 1,746 units permitted in Orange County in 2024 (1,265 in 5+ unit buildings).
Forward outlook
- In year one you build about $378 of equity ($346 loan paydown + $32 appreciation (0.1% local appreciation)).
- At projected returns (0.1% appreciation + 3.0% rent growth), your $14k cash investment doubles in ~2 years — after that, you're playing with house money.
Negotiation context
- It's been on market 37 days — a 3% lower offer ($48k) is reasonable based on typical stale-listing flexibility.
Risks & watch-outs
- Watch-outs: HOA is 26% of rent.
Questions for the listing agent
- It's been on market 37 days. Have you received any prior offers? Is the seller open to a 3% concession, seller financing, or rate buy-down credit?
- Built in 1978 — when were the roof, HVAC, electrical panel, plumbing, and water heater last replaced?
- What does the HOA fee cover, when was the last increase, and are there any pending special assessments or reserve-fund shortfalls?
- Is there a deadline driving the sale (1031 exchange, divorce, estate, relocation)? That informs how much negotiation room exists.
- Schools are D-rated, which usually means shorter tenancies and higher turnover. Who's the typical renter profile here, and what's been the actual vacancy rate?
- What's the average days-on-market for RENTAL listings here right now (not sales)? A rising rental-DOM trend means longer vacancies and softer asking-rent achievability than the comps imply.
- What's the recent tenant-quality profile in this submarket — average credit score on applications, eviction rate, late-payment / NSF rate, and stable-employment percentage? A property-management company in the area should have these aggregated.
- How much new for-sale + rental construction is in the pipeline within 1–3 miles? Heavy new supply typically softens prices + rents 12–24 months out; constrained supply supports both.
Investment metrics
- 1% rule
- 5.03% ✓
- Cap rate
- 29.83%
- Cash-on-cash
- 84.05%
- DSCR
- 4.74
- GRM
- 1.7
CMA / ARV
No comps found within radius.
Projected returns pro-forma
0.06% appreciation · 3.0% rent growth · sell at horizon
- IRR
- 86.7%
- Equity multiple
- 5.40×
- Total profit
- $61,581
- Equity at exit
- $14,678
- IRR
- 88.1%
- Equity multiple
- 11.18×
- Total profit
- $142,569
- Equity at exit
- $17,771
Cash invested: $14,000 (down + closing). Projections, not guarantees.
Landlord ↔ Tenant lean methodology
- Overall (STATE)
- 15 Strongly Tenant-Friendly
- State New York
- 15 Strongly Tenant-Friendly · D+10
- County
- — inherits STATE
- City
- — inherits STATE
ZIP-level market 12729
- Home prices YoY
- 0.0%
- Active inventory
- 20
- Price-to-rent
- 1.7×
Monthly cashflow live
- Estimated rent
- $2,514 medium interval (Pro) →
- Mortgage (P&I)
- −$262
- Tax est. 1.5%
- −$62 /mo · $750/yr
- Insurance
- −$21
- HOA
- −$660
- Vacancy / Maint / Mgmt
- −$528
- Net cashflow
- $981
Break-even live
UW: 25.0% down · 7.5% · 30yr · 1.5% tax · 5.0% vac · 8.0% maint · 8.0% mgmt
Financing live
Cash to close
- Down payment
- $12,500
- Closing costs
- $1,500
- Reserves months
- —
- Total cash needed
- —
Loan-product check · same deal, 3 products live
Conventional
25% down · 7.5% · 30yr
- Down + closing
- —
- Monthly P&I
- —
- Monthly cashflow
- —
- DSCR
- —
- Eligible?
- —
Personal DTI + credit; lowest rate.
DSCR
20% down · 8.5% · 30yr
- Down + closing
- —
- Monthly P&I
- —
- Monthly cashflow
- —
- DSCR
- —
- Eligible?
- —
No personal income docs; deal must DSCR.
Hard money
10% down · 12.0% · 12mo
- Down + closing
- —
- Monthly P&I
- —
- Monthly cashflow
- —
- DSCR
- —
- Eligible?
- —
Short-term bridge; refi at stabilization.
HOA detail
- Monthly dues
- $660 · $7,920/yr
Listing history 16 events
-
2026-06-18days on market $50,000 Active 37 DOM
-
2026-06-17days on market $50,000 Active 36 DOM
-
2026-06-16days on market $50,000 Active 35 DOM
-
2026-06-15days on market $50,000 Active 34 DOM
-
2026-06-14days on market $50,000 Active 32 DOM
-
2026-06-13days on market $50,000 Active 31 DOM
-
2026-06-10days on market $50,000 Active 29 DOM
-
2026-06-09days on market $50,000 Active 28 DOM
-
2026-06-08days on market $50,000 Active 27 DOM
-
2026-06-07days on market $50,000 Active 26 DOM
-
2026-06-03days on market $50,000 Active 22 DOM
-
2026-06-02days on market $50,000 Active 21 DOM
-
2026-06-01days on market $50,000 Active 20 DOM
-
2026-05-31days on market $50,000 Active 19 DOM
-
2026-05-30days on market $50,000 Active 18 DOM
-
2026-05-12$50,000 Active 768-char remark
ⓘ Source: listings_history table (triggers on properties + properties_extension) + one-shot
backfill from property_details.listing_events for pre-trigger history.
Climate risk First Street
- Flood 1/10 Low FEMA zone X (unshaded) · 0% chance over 30 yrs
- Wildfire 4/10 Moderate
- Heat 4/10 Moderate 7 d/yr ≥96°F today · 16 d/yr by 30 yrs out
- Wind 3/10 Moderate 8% chance of damaging wind over 30 yrs
- Air quality 2/10 Low 1 unhealthy d/yr today · 2 by 30 yrs out
Nearby sold comps map
Loading sold comps map…
Walkable amenities ~0.75 mi
Loading nearby amenities…
Taxation est. · year 1
- Rental income
- $30,168
- − Mortgage interest
- −$2,801
- − Property taxes
- −$750
- − Insurance
- −$250
- − Repairs & maintenance
- −$2,413
- − Management
- −$2,413
- − HOA
- −$7,920
- − Depreciation
- −$1,455
- Taxable income
- $12,166
- Est. tax owed @ 24.0%
- −$2,920
- After-tax cash flow
- $8,847/yr
For passive investors: Depreciation is non-cash, so a rental often shows a tax loss while cash-flowing — sheltering income. Rental losses are passive: they offset passive income freely, and up to $25,000/yr can offset ordinary (W-2) income if you actively participate and your MAGI is under $100k (phasing out to $0 by $150k); unused losses carry forward. On sale, claimed depreciation is recaptured at up to 25%, and gains may owe capital-gains tax (a 1031 exchange can defer both). Figures are a year-1 estimate at your 24.0% rate — not tax advice; consult a CPA.
Condition & rehab AI · 12 photos
A charming manufactured home with average condition, requiring minor repairs and updates to enhance its resale and rental value.
Repairs flagged
- Minor kitchen backsplash — simple update to modernize
- Minor bathroom vanity — update to larger vanity for better storage
- Minor exterior siding — painting or minor repairs needed
Value-add opportunities
- Resale paint interior walls — enhances curb appeal and interior aesthetics
- Resale update kitchen backsplash — modernizes the space and adds value
- Rental replace curtains/blinds — improves light and privacy
Renovation cost estimate screening
| Repair item | Severity | Est. cost |
|---|---|---|
| kitchen backsplash · simple update to modernize | Minor | $500–3,000 |
| bathroom vanity · update to larger vanity for better storage | Minor | $500–3,000 |
| exterior siding · painting or minor repairs needed | Minor | $500–3,000 |
| Total estimated repair cost · 3 items | $1,500–9,000 |
Value-add ROI direction
- Resale paint interior walls — enhances curb appeal and interior aesthetics ↑
- Resale update kitchen backsplash — modernizes the space and adds value ↑
- Rental replace curtains/blinds — improves light and privacy ↑
ⓘ Cost ranges are severity-bucket heuristics (US national rule-of-thumb). Get contractor quotes + a written scope before underwriting a rehab budget.
Schools (NCES district)
- District
- Port Jervis City School District
- NCES district ID
- 3623520
- Math proficiency
- 43% ▼ -7.00%
- Reading proficiency
- 50% ▲ 5.00%
- Median HH income
- $44,506
- Composite
- 39.33/100
- National rank
- #3984
- State rank
- #451 of 590 in NY
Livability — Otisville
- Score
- 70/100
- State rank
- #459
- US rank
- #7992
Category grades
Schools grade is shown separately in the Schools card above.
Census & demographics
- City population
- 3,940
- Population (ZIP)
- 1,307
Population outlook (Orange County) Hauer SSP2
- Today (2025)
- 379,830 people
- By 2030
- 378,955 · -0.2%
- By 2040
- 375,444 · -1.2%
- By 2050
- 369,311 · -2.8%
- By 2075
- 354,233 · -6.7%
- By 2100
- 318,150 · -16.2%
Race, ethnicity, and origin ACS 2023
- Neighborhood character
- Diverse neighborhood (Simpson 0.61)
- Race & ethnicity
- White 59% Black 14% Asian 12% Hispanic / Latino 9% Two or more races 6%
- Hispanic origin (detail)
- Puerto Rican 9%
- Common ancestry
- Hispanic 13% Romanian 6% Iranian 5%
- Foreign-born
- 16% · China
- Languages at home
- 80% English-only · Chinese 11% Spanish 4% French/Haitian/Cajun 3%
Political lean MEDSL · Orange
- 2024 margin
- Lean R (+8.4) · D 45.8% · R 54.2%
- 2008→2024 swing
- -12.5pp toward R · 2008: 4.1pp · 2024: -8.4pp
- All cycles
- 2024: R+8.4 2020: R+0.2 2016: R+6.5 2012: D+5.2 2008: D+4.1
Not yet ingested
- Civics
- —
Market trends
- HPI YoY
- ▲ 0.06%
- Current HPI
- 341.1758
- Rent YoY
- —
- Metro
- —
- State GDP YoY
- ▲ 2.60%
- F500 in state
- 92
Industry mix (Fortune 500 HQ in NY)
| Industry | F500 HQs | Revenue |
|---|---|---|
| Financial Services | 10 | $950B |
|
||
| Consumer Goods | 9 | $162B |
|
||
| Insurance | 4 | $225B |
|
||
| Telecommunications | 2 | $144B |
|
||
| Pharmaceuticals | 2 | $112B |
|
||
| Media / Entertainment | 2 | $69B |
|
||
Price history
1 event — show timeline
- 2026-05-12 Listed $50,000 OneKey® MLS as Distributed by MLS Grid
Cash-flow waterfall
monthlySold comps — $/sqft
last 12 mo · ≤1 miLoading sold comps…