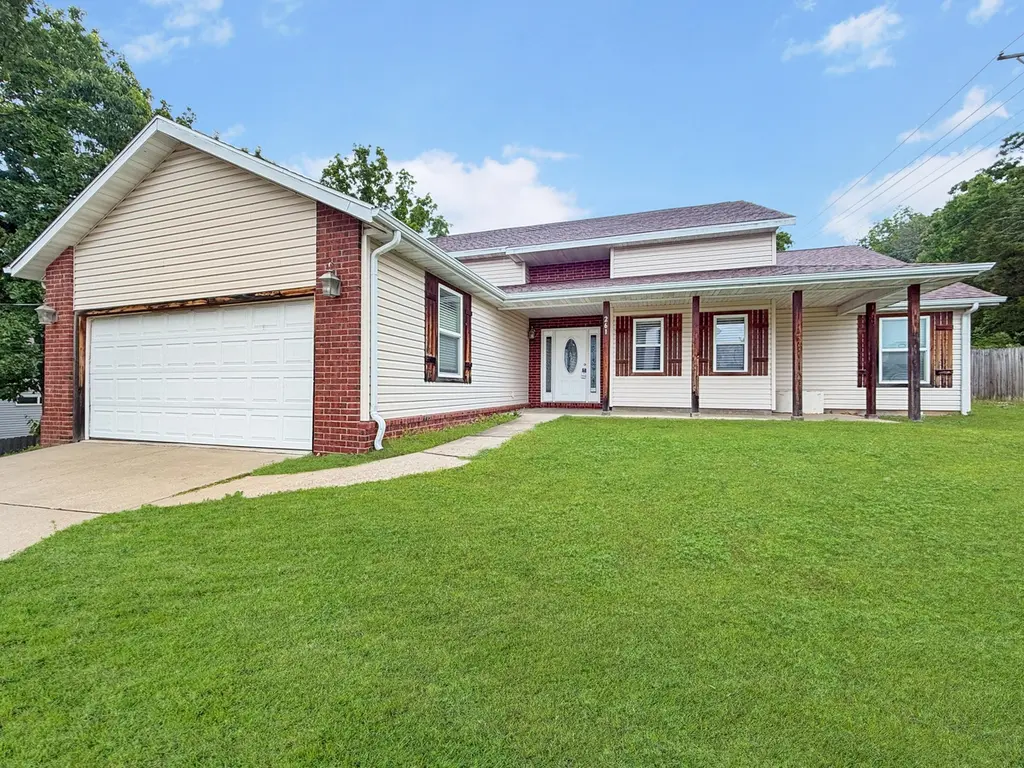
261 Pine St · Branson, MO
Flood risk 1/10 · Minimal
- FEMA flood zone
- X (unshaded)
- Chance of flooding over 30 yrs
- 0.0%
- Est. flood insurance / yr
- $473 – $860
Fire risk 3/10 · Minor
- Est. fire insurance / yr
- $1,054 – $1,958
Heat risk 5/10 · Moderate
- Hot days now (above 106°F)
- 7 days/yr
- Hot days in 30 yrs
- 21 days/yr
Wind risk 2/10 · Minimal
- Chance of severe wind over 30 yrs
- 0.0%
Air-quality risk 2/10 · Minimal
- Unhealthy air days now
- 0 days/yr
- Unhealthy air days in 30 yrs
- 1 days/yr
Risk factors via First Street. Map © Google.
Why this score? — see what drove the D- grade
The composite is a weighted blend of 9 inputs, each scored 0–100. Each bar is that input's sub-score; the figure is the points it added to the 100-point composite (weight × sub-score).
- Cash flow +12.6/30.0
- ARV discount +6.9/15.0
- Schools +4.2/10.0
- Livability +3.9/5.0
- DSCR +3.7/10.0
- Rent growth +3.2/5.0
- 1% rule +2.5/10.0
- Condition / age +2.5/5.0
- Appreciation +0.0/10.0
$270,750
🖨 Deal sheet (PDF) 📄 Offer letter ✓ Due diligence
Listing remarks
This inviting home combines comfort, space, and peace of mind with major updates already completed, including a new roof, new gutters, and a new A/C system. Step inside to a bright, open-concept living area featuring vaulted ceilings, warm flooring, and abundant natural light. The spacious layout flows seamlessly into the kitchen, complete with ample cabinetry, a functional bar-top seating area, and a layout perfect for everyday living or entertaining. The exterior offers great curb appeal with a welcoming front entry and attached garage, while the interior design provides both openness and functionality. Located in a very safe and quiet neighborhood, this home offers a sense of comfort and
Key facts
- 0.3 acre lot
- 2 garage spots
- Built 2006
Property features AI
Exterior
- Parking: 2-car garage (garage faces rear)
- Utilities: Public water; Public sewer; Cable available
- Home design: Single-family residence; One-story home; Vinyl siding and brick exterior; Rear-facing garage; Entry faces Pine St / located in Gateway subdivision
- Construction: Vinyl siding and brick construction; Composition roof; Slab foundation; Built with accessibility features including therapeutic whirlpool
- Exterior features: Partial privacy fencing; Level lot; Asphalt and concrete driveway/road surfaces
Interior
- Kitchen: Dishwasher; Microwave; Garbage disposal; Laminate counters
- Bedrooms: Bedrooms with walk-in closet(s)
- Flooring: Laminate flooring (implied by laminate counters and interior finishes)
- Bathrooms: 2 full bathrooms; Soaking tub in at least one bathroom
- Heating & cooling: Central air conditioning; Electric forced-air heating
- Interior features: Entrance foyer; Soaking tub / therapeutic whirlpool; Laminate countertops; Walk-in closet(s); Cathedral ceilings; Insulated double-pane windows
- Laundry & utility: Electric water heater
Neighborhood map
What this means for you Summary
Snapshot
- This is a 3-bed/2.0-bath other listed at $271k.
Deal economics
- At list price, monthly cash flow is $-36 ($-427/yr) — negative.
- To cash-flow at today's rent, offer at most $264k (2.3% below list).
- To meet the 1% rule (rent ≥ 1% of price), the offer needs to be $202k (25.2% below list).
- Recommended offer: $202k (25.2% below list) — sets the bar for 1% rule.
- Cap rate 6.1% vs local median 2.6% in Branson — top-decile yield for the area; either an underpriced asset or a hidden risk that comps aren't pricing in. Stress-test before assuming the spread holds.
Location & tenants
- Location reads 77/100 on livability (#32 in MO, #2,940 nationally) — a middle-class / working-renter tenant base. Strengths: commute A+, cost of living A+, health & safety A+; Watch: employment C-, crime F.
- Branson R-IV (rural): math 48% / reading 52% proficiency, ranked #44 of 324 in MO (top 14%) — acceptable for families but not a draw, mixed tenant base, ~2y average lease.
- Zoned schools: Cedar Ridge Primary (345 students, 72% FRL); Branson Jr. High (math 48% / reading 49%, grade C-, #81 of 391 statewide, top 21%, 724 students, 51% FRL); Branson High (math 42% / reading 56%, grade D, #145 of 521 statewide, top 28%, 1,423 students, 46% FRL).
- Market conditions: Rents rising (+2.9%/yr); 1061 active listings in the ZIP; 4 comparable units currently listed for rent nearby; rentals lingering (median 46d on market — plan ~5-8 weeks vacancy on turnover, expect pricing pressure); 100% of comp listings sitting > 30 days — soft ceiling on asking rent; 331 units permitted in Taney County in 2024 (50 in 5+ unit buildings).
- This rent runs 40% of the median local income ($60k/yr) — at the standard rent-burdened threshold; future hikes will face affordability resistance.
Forward outlook
- Local home prices are declining (-3.0%/yr); year-one equity from $2k of loan paydown is wiped out by about $8k of value loss. Plan a longer hold.
- Taney County population projected at +17% by 2050 — long-run rental-demand tailwind backs the buy-and-hold thesis.
Negotiation context
- It's been on market 46 days — a 3% lower offer ($263k) is reasonable based on typical stale-listing flexibility.
- 7 sale attempts since 3y ago; this cycle's ask has dropped $29k (10%) from the opening price — seller is motivated, your offer sets the floor, not the list.
Risks & watch-outs
- Climate carrying-cost: extreme-heat days projected 7→21/yr by 2055 (HVAC capex compounding) — expect insurance premiums to compound above CPI over the hold.
Questions for the listing agent
- What do current leases actually rent for vs. the listed asking? Can we see a recent rent roll and the last 12 months of T-12 income?
- It's been on market 46 days. Have you received any prior offers? Is the seller open to a 25% concession, seller financing, or rate buy-down credit?
- Is there a deadline driving the sale (1031 exchange, divorce, estate, relocation)? That informs how much negotiation room exists.
- Crime grade is F in this area — have there been break-ins, vandalism, or insurance claims at this property in the last 3 years? What carrier currently insures it and at what premium?
- The area grade is low — what's the realistic commute time and amenity access for the typical tenant pool here? Any planned neighborhood developments (good or bad) we should know about?
- What's the average days-on-market for RENTAL listings here right now (not sales)? A rising rental-DOM trend means longer vacancies and softer asking-rent achievability than the comps imply.
- What's the recent tenant-quality profile in this submarket — average credit score on applications, eviction rate, late-payment / NSF rate, and stable-employment percentage? A property-management company in the area should have these aggregated.
- How much new for-sale + rental construction is in the pipeline within 1–3 miles? Heavy new supply typically softens prices + rents 12–24 months out; constrained supply supports both.
Investment metrics
- 1% rule
- 0.75% ✗
- Cap rate
- 6.14%
- Cash-on-cash
- -0.56%
- DSCR
- 0.97
- GRM
- 11.1
CMA / ARV
- ARV (median comp)
- $267,202
- List price
- $270,750
- Delta
- 1.33%
- Verdict
- FAIR
- Comps
- 11 within 1.0 mi
Projected returns pro-forma
-3.0% appreciation · 2.9% rent growth · sell at horizon
- IRR
- -17.4%
- Equity multiple
- 0.39×
- Total profit
- $-46,456
- Equity at exit
- $40,370
- IRR
- -9.7%
- Equity multiple
- 0.41×
- Total profit
- $-44,669
- Equity at exit
- $23,410
Cash invested: $75,810 (down + closing). Projections, not guarantees.
Landlord ↔ Tenant lean methodology
- Overall (STATE)
- 81 Strongly Landlord-Friendly
- State Missouri
- 81 Strongly Landlord-Friendly · R+10
- County
- — inherits STATE
- City
- — inherits STATE
ZIP-level market 65616
- Home prices YoY
- -24.3%
- Rents YoY
- 2.9%
- Active inventory
- 1061
- Price-to-rent
- 11.1×
Monthly cashflow live
- Estimated rent
- $2,024 medium interval (Pro) →
- Mortgage (P&I)
- −$1,420
- Tax from tax record
- −$102 /mo · $1,226/yr
- Insurance
- −$113
- HOA
- −$0
- Vacancy / Maint / Mgmt
- −$425
- Net cashflow
- $-36
Break-even live
Sensitivity live
| Price | -10% $118 | -5% $41 | +0% $-36 | +5% $-112 | +10% $-189 |
|---|---|---|---|---|---|
| Rent | -10% $-195 | -5% $-116 | +0% $-36 | +5% $44 | +10% $124 |
| Rate | -1.0pp $101 | -0.5pp $33 | base $-36 | +0.5pp $-106 | +1.0pp $-177 |
UW: 25.0% down · 7.5% · 30yr · 1.5% tax · 5.0% vac · 8.0% maint · 8.0% mgmt
Financing live
Cash to close
- Down payment
- $67,688
- Closing costs
- $8,122
- Reserves months
- —
- Total cash needed
- —
Loan-product check · same deal, 3 products live
Conventional
25% down · 7.5% · 30yr
- Down + closing
- —
- Monthly P&I
- —
- Monthly cashflow
- —
- DSCR
- —
- Eligible?
- —
Personal DTI + credit; lowest rate.
DSCR
20% down · 8.5% · 30yr
- Down + closing
- —
- Monthly P&I
- —
- Monthly cashflow
- —
- DSCR
- —
- Eligible?
- —
No personal income docs; deal must DSCR.
Hard money
10% down · 12.0% · 12mo
- Down + closing
- —
- Monthly P&I
- —
- Monthly cashflow
- —
- DSCR
- —
- Eligible?
- —
Short-term bridge; refi at stabilization.
Rent comps 4 comps
| Address | Beds | Baths | Sqft | Rent | $/sqft | DOM | Units | Dist |
|---|---|---|---|---|---|---|---|---|
| 745 Aaron Way Branson, MO | 4.0 | 2.0 | 1575 | $2,250 | $1.43 | 45d | 1 | 0.33mi |
| 172 Forest Ln Branson, MO | 3.0 | 3.0 | 1600 | $1,750 | $1.09 | 45d | 1 | 1.13mi |
| 190 Forest Ln Branson, MO | 4.0 | 3.0 | 1550 | $1,995 | $1.29 | 45d | 1 | 1.14mi |
| 139 Woodland Dr N Branson, MO | 3.0 | 2.0 | 1339 | $1,750 | $1.31 | 45d | 1 | 1.20mi |
Listing history 33 events
-
2026-06-22days on market $270,750 Active 46 DOM
-
2026-06-21days on market $270,750 Active 45 DOM
-
2026-06-19days on market $270,750 Active 43 DOM
-
2026-06-18days on market $270,750 Active 42 DOM
-
2026-06-17days on market $270,750 Active 41 DOM
-
2026-06-16days on market $270,750 Active 40 DOM
-
2026-06-15days on market $270,750 Active 39 DOM
-
2026-06-14days on market $270,750 Active 37 DOM
-
2026-06-13price $270,750 Active 36 DOM
-
2026-06-12days on market $285,000 Active 36 DOM
-
2026-06-09days on market $285,000 Active 33 DOM
-
2026-06-08days on market $285,000 Active 32 DOM
-
2026-06-07days on market $285,000 Active 31 DOM
-
2026-06-03days on market $285,000 Active 27 DOM
-
2026-06-02days on market $285,000 Active 26 DOM
-
2026-06-01days on market $285,000 Active 25 DOM
-
2026-05-31days on market $285,000 Active 24 DOM
-
2026-05-30days on market $285,000 Active 23 DOM
-
2026-05-07$299,900 Active 1035-char remark
-
2025-04-14historical $1,650
-
2025-04-11$1,650
-
2025-04-04historical $1,650
-
2025-03-29price $1,650
-
2025-03-16historical $2,000
-
2025-03-14$2,000
-
2025-02-20$2,000
-
2024-08-26historical $2,000
-
2024-07-21$2,000
-
2023-12-22historical $2,000
-
2023-12-14$2,000
-
2023-11-11historical $1,250
-
2023-11-10$1,250
-
2006-10-04soldstatus
ⓘ Source: listings_history table (triggers on properties + properties_extension) + one-shot
backfill from property_details.listing_events for pre-trigger history.
Tax reassessment forecast MO · Resets to sale price
- Current annual tax
- $1,226 · $102/mo
- Projected year-2 tax
- $2,626 · $219/mo
- Expected delta
- +$1,401/yr (+$117/mo · 114.3%)
ⓘ Screening estimate from a state-policy table — verify with the county assessor before closing.
Climate risk First Street
- Flood 1/10 Low FEMA zone X (unshaded) · 0% chance over 30 yrs
- Wildfire 3/10 Moderate
- Heat 5/10 Major 7 d/yr ≥106°F today · 21 d/yr by 30 yrs out
- Wind 2/10 Low 0% chance of damaging wind over 30 yrs
- Air quality 2/10 Low 0 unhealthy d/yr today · 1 by 30 yrs out
Nearby sold comps map
Loading sold comps map…
Walkable amenities ~0.75 mi
Loading nearby amenities…
Taxation est. · year 1
- Rental income
- $24,292
- − Mortgage interest
- −$15,166
- − Property taxes
- −$1,226
- − Insurance
- −$1,354
- − Repairs & maintenance
- −$1,943
- − Management
- −$1,943
- − Depreciation
- −$7,876
- Taxable loss
- −$5,217
- Est. tax savings @ 24.0%
- +$1,252
- After-tax cash flow
- $825/yr
For passive investors: Depreciation is non-cash, so a rental often shows a tax loss while cash-flowing — sheltering income. Rental losses are passive: they offset passive income freely, and up to $25,000/yr can offset ordinary (W-2) income if you actively participate and your MAGI is under $100k (phasing out to $0 by $150k); unused losses carry forward. On sale, claimed depreciation is recaptured at up to 25%, and gains may owe capital-gains tax (a 1031 exchange can defer both). Figures are a year-1 estimate at your 24.0% rate — not tax advice; consult a CPA.
Schools (NCES district)
- District
- Branson R-IV
- NCES district ID
- 2905760
- Math proficiency
- 48% ▼ -6.00%
- Reading proficiency
- 52% ▼ -3.00%
- Median HH income
- $41,473
- Composite
- 41.96/100
- National rank
- #3347
- State rank
- #44 of 324 in MO
Livability — Branson
- Score
- 77/100
- State rank
- #32
- US rank
- #2940
Category grades
Schools grade is shown separately in the Schools card above.
Census & demographics
- Census place
- Branson, MO
- County
- Taney County · 28,460 people
- City population
- 28,460
- Metro
- Branson, MO
- Population (ZIP)
- 28,460
- Household income
- $60,489
- Rent vs Own
- Severe rent burden
- 1065.0
Population outlook (Taney County) Hauer SSP2
- Today (2025)
- 59,017 people
- By 2030
- 61,235 · +3.8%
- By 2040
- 65,225 · +10.5%
- By 2050
- 68,842 · +16.6%
- By 2075
- 77,705 · +31.7%
- By 2100
- 82,002 · +38.9%
Race, ethnicity, and origin ACS 2023
- Neighborhood character
- Predominantly White (82%)
- Race & ethnicity
- White 82% Two or more races 10% Hispanic / Latino 10% Black 2% Asian 2%
- Hispanic origin (detail)
- Mexican 6% Puerto Rican 2%
- Common ancestry
- Italian 4% Lithuanian 3% Slovak 2%
- Foreign-born
- 5% · Canada
- Languages at home
- 89% English-only · Spanish 7% Other Indo-European 1% Russian/Polish/Slavic 1%
Political lean MEDSL · Taney
- 2024 margin
- Solid R (+59.3) · D 19.9% · R 79.2%
- 2008→2024 swing
- -22.2pp toward R · 2008: -37.2pp · 2024: -59.3pp
- All cycles
- 2024: R+59.3 2020: R+57.7 2016: R+59.3 2012: R+47.4 2008: R+37.2
Not yet ingested
- Civics
- —
Market trends
- HPI YoY
- ▼ -64.45%
- Current HPI
- 200.8392
- Rent YoY
- ▲ 2.90%
- Metro
- Branson, MO
- State GDP YoY
- ▲ 1.84%
- F500 in state
- 20
Industry mix (Fortune 500 HQ in MO)
| Industry | F500 HQs | Revenue |
|---|---|---|
| Healthcare | 1 | $163B |
|
||
| Insurance | 1 | $21B |
|
||
| Industrial Technology | 1 | $17B |
|
||
| Retail | 1 | $16B |
|
||
| Industrial Distribution | 1 | $10B |
|
||
| Utilities | 1 | $9B |
|
||
Price history
+21560.0% since first listed17 events — show timeline
- 2026-06-13 Price Changed $270,750 SOMO
- 2026-05-22 Price Changed $285,000 SOMO
- 2026-05-07 Listed $299,900 SOMO
- 2025-04-14 Rental Removed $1,650 APPFOLIO
- 2025-04-11 Listed for Rent $1,650 APPFOLIO
- 2025-04-04 Rental Removed $1,650 RENT.
- 2025-03-29 Price Changed $1,650 RENT.
- 2025-03-16 Rental Removed $2,000 APPFOLIO
- 2025-03-14 Listed for Rent $2,000 RENT.
- 2025-02-20 Listed for Rent $2,000 APPFOLIO
- 2024-08-26 Rental Removed $2,000 APPFOLIO
- 2024-07-21 Listed for Rent $2,000 APPFOLIO
- 2023-12-22 Rental Removed $2,000 APPFOLIO
- 2023-12-14 Listed for Rent $2,000 APPFOLIO
- 2023-11-11 Rental Removed $1,250 APPFOLIO
- 2023-11-10 Listed for Rent $1,250 APPFOLIO
- 2006-10-04 Sold (Public Records) — Public Records
Property tax history
+0.6%/yrLatest (2025): $1,226 · -14.8% YoY. Source: county tax records.
Cash-flow waterfall
monthlySold comps — $/sqft
last 12 mo · ≤1 miLoading sold comps…