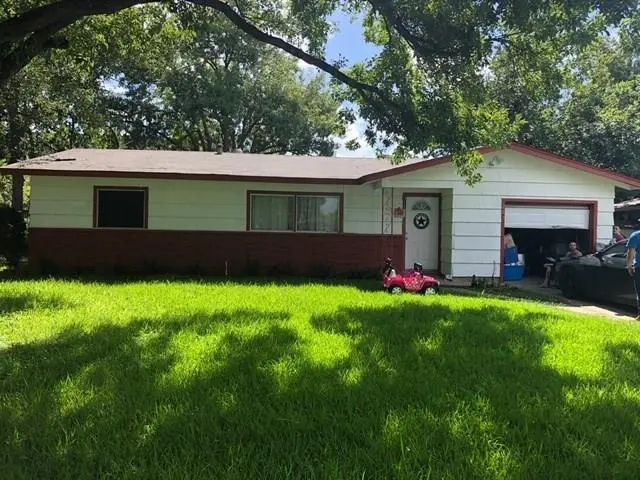
207 W Saunders St · League City, TX
Flood risk 4/10 · Minor
- FEMA flood zone
- X (unshaded)
- Chance of flooding over 30 yrs
- 0.22%
- Est. flood insurance / yr
- $507 – $1,088
Fire risk 1/10 · Minimal
- Est. fire insurance / yr
- $1,222 – $2,270
Heat risk 10/10 · Severe
- Hot days now (above 108°F)
- 7 days/yr
- Hot days in 30 yrs
- 25 days/yr
Wind risk 9/10 · Severe
- Chance of severe wind over 30 yrs
- 99.0%
Air-quality risk 2/10 · Minimal
- Unhealthy air days now
- 1 days/yr
- Unhealthy air days in 30 yrs
- 1 days/yr
Risk factors via First Street. Map © Google.
Why this score? — see what drove the D grade
The composite is a weighted blend of 9 inputs, each scored 0–100. Each bar is that input's sub-score; the figure is the points it added to the 100-point composite (weight × sub-score).
- ARV discount +15.0/15.0
- Cash flow +8.6/30.0
- Schools +4.6/10.0
- Livability +3.8/5.0
- 1% rule +3.4/10.0
- Rent growth +2.7/5.0
- Condition / age +2.5/5.0
- DSCR +2.3/10.0
- Appreciation +0.0/10.0
$221,999
🖨 Deal sheet (PDF) 📄 Offer letter ✓ Due diligence
Listing remarks
Spacious Single-Story Home with Bonus Room and Extra Storage Welcome to this great single-story home featuring 3 bedrooms, 2 bathrooms, and an additional bonus room that can be used as a fourth bedroom, office, or flex space. The property also includes an additional garage in the back—perfect for extra storage or a workshop. Conveniently located near freeway access, restaurants, and shopping, this home offers both comfort and convenience. A must-see opportunity for families or investors!
Key facts
- Extra storage
- Bonus room
- Freeway access
Tags
Property features AI
Exterior
- Parking: Attached garage (1 car)
- Utilities: Public water; Public sewer
- Home design: Residential property; Single-story (all main rooms listed on the first floor)
- Construction: Vinyl siding; Composition roof; Slab foundation; Built in 1954
- Exterior features: Back yard fence; Cleared lot
Interior
- Kitchen: Dishwasher; Electric range; Microwave; Oven; Garbage disposal; Refrigerator
- Bedrooms: Primary bedroom on the first floor (approx. 11 x 10); Two additional bedrooms on the first floor (each approx. 10 x 10)
- Flooring: Carpet; Laminate; Tile
- Bathrooms: 1 full bathroom; 1 half bathroom
- Interior features: Ceiling fan(s)
- Laundry & utility: Washer hookup; Gas dryer hookup
Neighborhood map
What this means for you Summary
Snapshot
- This is a 3-bed/2.0-bath single-family listed at $222k.
Deal economics
- At list price, monthly cash flow is $-192 ($-2k/yr) — negative.
- To cash-flow at today's rent, offer at most $188k (15.3% below list).
- To meet the 1% rule (rent ≥ 1% of price), the offer needs to be $187k (15.9% below list).
- Recommended offer: $187k (15.9% below list) — sets the bar for 1% rule.
- Cap rate 5.3% vs local median 2.7% in League City — top-decile yield for the area; either an underpriced asset or a hidden risk that comps aren't pricing in. Stress-test before assuming the spread holds.
Location & tenants
- Location reads 75/100 on livability (#135 in TX, #3,961 nationally) — a middle-class / working-renter tenant base. Strengths: crime A+, employment A+, housing A+; Watch: amenities F, commute F, health & safety F.
- Clear Creek ISD (suburban): math 48% / reading 54% proficiency, ranked #114 of 826 in TX (top 14%) — acceptable for families but not a draw, mixed tenant base, ~2y average lease.
- Zoned schools: Ralph Parr El (math 51% / reading 57%, grade C, #664 of 4,322 statewide, top 16%, 704 students, 37% FRL); Victory Lakes Int (math 47% / reading 54%, grade C, #333 of 1,662 statewide, top 21%, 937 students, 28% FRL); Clear Creek H S (math 51% / reading 54%, grade C-, #444 of 1,632 statewide, top 27%, 2,400 students, 0% FRL) — zoned schools at 22% FRL track the district average.
- Market conditions: Rents flat; 959 active listings in the ZIP; 33 comparable units currently listed for rent nearby; rentals leasing fast (median 9d on market — plan ~1-2 weeks tenant-placement turnaround); high-income renter base; 3,258 units permitted in Galveston County in 2024 (0 in 5+ unit buildings).
Forward outlook
- Local home prices are declining (-3.0%/yr); year-one equity from $2k of loan paydown is wiped out by about $7k of value loss. Plan a longer hold.
- Galveston County population projected at +43% by 2050 — long-run rental-demand tailwind backs the buy-and-hold thesis.
Negotiation context
- It's been on market 26 days — a 2% lower offer ($219k) is reasonable based on typical stale-listing flexibility.
- 7 sale attempts since 8y ago with the ask held roughly flat each time — persistent listings suggest the price (not the market) is what's stuck; bring a comps-based counter.
Risks & watch-outs
- Watch-outs: built in 1954 — expect roof / HVAC / electrical / plumbing capex.
- Climate carrying-cost: severe wind risk, 99% chance of damaging wind over 30y; extreme-heat days projected 7→25/yr by 2055 (HVAC capex compounding) — expect insurance premiums to compound above CPI over the hold.
Questions for the listing agent
- What do current leases actually rent for vs. the listed asking? Can we see a recent rent roll and the last 12 months of T-12 income?
- Built in 1954 — when were the roof, HVAC, electrical panel, plumbing, and water heater last replaced?
- Is there a deadline driving the sale (1031 exchange, divorce, estate, relocation)? That informs how much negotiation room exists.
- Schools are B-rated — typically a magnet for longer-tenancy family renters. What's the average tenant stay here, and is there a school-zone premium baked into asking?
- The area grade is low — what's the realistic commute time and amenity access for the typical tenant pool here? Any planned neighborhood developments (good or bad) we should know about?
- What's the average days-on-market for RENTAL listings here right now (not sales)? A rising rental-DOM trend means longer vacancies and softer asking-rent achievability than the comps imply.
- What's the recent tenant-quality profile in this submarket — average credit score on applications, eviction rate, late-payment / NSF rate, and stable-employment percentage? A property-management company in the area should have these aggregated.
- How much new for-sale + rental construction is in the pipeline within 1–3 miles? Heavy new supply typically softens prices + rents 12–24 months out; constrained supply supports both.
Investment metrics
- 1% rule
- 0.84% ✗
- Cap rate
- 5.25%
- Cash-on-cash
- -3.71%
- DSCR
- 0.83
- GRM
- 9.9
CMA / ARV
- ARV (median comp)
- $341,575
- List price
- $221,999
- Delta
- -35.01%
- Verdict
- UNDERPRICED
- Comps
- 20 within 2.0 mi
Show comp detail 12 sales within ~0.75 mi
| Address | Dist | Beds/Ba | Sqft | Sold | Price | $/sf | Match |
|---|---|---|---|---|---|---|---|
| 215 Oakwood St | 0.43mi | 3/2.0 | 1,599 (-1%) | 10mo | $265,000 | $166 | 69 |
| 213 Oakwood St | 0.43mi | 3/2.0 | 1,584 (-2%) | 10mo | $262,000 | $165 | 68 |
| 218 Englewood Dr | 0.44mi | 3/2.0 | 1,598 (-1%) | 12mo | $318,500 | $199 | 67 |
| 203 Fleetwood Cir | 0.52mi | 3/2.0 | 1,596 (-2%) | 11mo | $239,900 | $150 | 64 |
| 203 W Saunders St | 0.03mi | 3/2.0 | 1,382 (-15%) | 14mo | $225,000 | $163 | 62 |
| 217 Oakwood St | 0.42mi | 3/2.0 | 1,715 (+6%) | 11mo | $275,000 | $160 | 62 |
| 218 Pecan Dr | 0.58mi | 3/2.0 | 1,620 (-0%) | 14mo | $349,999 | $216 | 62 |
| 807 Driftwood St | 0.47mi | 3/2.0 | 1,730 (+7%) | 9mo | $240,000 | $139 | 59 |
| 205 Oakwood St | 0.46mi | 4/2.0 (+1) | 1,546 (-5%) | 11mo | $249,000 | $161 | 57 |
| 212 Englewood Dr | 0.46mi | 3/2.0 | 1,532 (-6%) | 15mo | $250,000 | $163 | 56 |
| 613 4th | 0.64mi | 3/2.5 | 1,683 (+4%) | 12mo | $329,900 | $196 | 52 |
| 604 Elmore St | 0.50mi | 3/2.0 | 1,757 (+8%) | 14mo | $349,000 | $199 | 51 |
Match score weights: distance 35% · size 25% · config 20% · recency 20%. Top-matched comps best support the ARV.
Projected returns pro-forma
-3.0% appreciation · 0.78% rent growth · sell at horizon
- IRR
- -25.2%
- Equity multiple
- 0.16×
- Total profit
- $-52,196
- Equity at exit
- $33,101
- IRR
- -30.8%
- Equity multiple
- -0.24×
- Total profit
- $-76,796
- Equity at exit
- $19,194
Cash invested: $62,160 (down + closing). Projections, not guarantees.
Landlord ↔ Tenant lean methodology
- Overall (STATE)
- 87 Strongly Landlord-Friendly
- State Texas
- 87 Strongly Landlord-Friendly · R+5
- County
- — inherits STATE
- City
- — inherits STATE
ZIP-level market 77573
- Home prices YoY
- -29.2%
- Rents YoY
- 0.8%
- Active inventory
- 959
- Price-to-rent
- 9.9×
Monthly cashflow live
- Estimated rent
- $1,867 high interval (Pro) →
- Mortgage (P&I)
- −$1,164
- Tax from tax record
- −$411 /mo · $4,931/yr
- Insurance
- −$92
- HOA
- −$0
- Vacancy / Maint / Mgmt
- −$392
- Net cashflow
- $-192
Break-even live
Sensitivity live
| Price | -10% $-67 | -5% $-130 | +0% $-192 | +5% $-255 | +10% $-318 |
|---|---|---|---|---|---|
| Rent | -10% $-340 | -5% $-266 | +0% $-192 | +5% $-119 | +10% $-45 |
| Rate | -1.0pp $-81 | -0.5pp $-136 | base $-192 | +0.5pp $-250 | +1.0pp $-308 |
UW: 25.0% down · 7.5% · 30yr · 1.5% tax · 5.0% vac · 8.0% maint · 8.0% mgmt
Financing live
Cash to close
- Down payment
- $55,500
- Closing costs
- $6,660
- Reserves months
- —
- Total cash needed
- —
Loan-product check · same deal, 3 products live
Conventional
25% down · 7.5% · 30yr
- Down + closing
- —
- Monthly P&I
- —
- Monthly cashflow
- —
- DSCR
- —
- Eligible?
- —
Personal DTI + credit; lowest rate.
DSCR
20% down · 8.5% · 30yr
- Down + closing
- —
- Monthly P&I
- —
- Monthly cashflow
- —
- DSCR
- —
- Eligible?
- —
No personal income docs; deal must DSCR.
Hard money
10% down · 12.0% · 12mo
- Down + closing
- —
- Monthly P&I
- —
- Monthly cashflow
- —
- DSCR
- —
- Eligible?
- —
Short-term bridge; refi at stabilization.
Rent comps 33 comps
| Address | Beds | Baths | Sqft | Rent | $/sqft | DOM | Units | Dist |
|---|---|---|---|---|---|---|---|---|
| 18 W Walker St League City, TX | 2.0 | 2.0 | 1172 | $1,662 | $1.42 | 45d | 1 | 0.05mi |
| 113 W Main St League City, TX | 2.0 | 2.0 | 1144 | $1,699 | $1.49 | 26d | 1 | 0.26mi |
| 382 Hyland Ln League City, TX | 3.0 | 2.0 | 2229 | $1,200 | $0.54 | 0d | 1 | 0.32mi |
| 382 Hyland Ln League City, TX | 3.0 | 2.0 | 2227 | $1,480 | $0.66 | 4d | 1 | 0.32mi |
| 310 Waco Ave Apt 206 League City, TX | 2.0 | 1.5 | 1100 | $1,250 | $1.14 | 0d | 1 | 0.44mi |
| 316 3rd St League City, TX | 3.0 | 1.0 | 1400 | $1,450 | $1.04 | 45d | 1 | 0.46mi |
| 703 Coryell St League City, TX | 3.0 | 2.0 | 1580 | $1,595 | $1.01 | 23d | 1 | 0.73mi |
| 1751 W Walker St Unit 3174 League City, TX | 3.0 | 2.0 | 1363 | $2,536 | $1.86 | 0d | 1 | 0.75mi |
| 1751 W Walker St Unit 1784 League City, TX | 3.0 | 2.0 | 1363 | $2,485 | $1.82 | 0d | 1 | 0.75mi |
| 301 N Wesley Dr Unit 2047 League City, TX | 2.0 | 2.0 | 1067 | $1,614 | $1.51 | 0d | 1 | 1.09mi |
| 301 N Wesley Dr Unit 3047 League City, TX | 3.0 | 2.0 | 1445 | $1,640 | $1.13 | 12d | 1 | 1.09mi |
| 2205 W Walker St Unit 424 League City, TX | 2.0 | 2.0 | 1093 | $1,615 | $1.48 | 9d | 1 | 1.10mi |
| 301 N Wesley Dr League City, TX | 2.0 | 2.0 | 1144 | $1,699 | $1.49 | 45d | 1 | 1.14mi |
| 307 N Wesley Dr League City, TX | 2.0 | 2.0 | 1067 | $1,469 | $1.38 | 45d | 1 | 1.14mi |
| 301 N Wesley Dr Unit 3112 League City, TX | 3.0 | 2.0 | 1445 | $1,589 | $1.10 | 0d | 1 | 1.15mi |
| 301 N Wesley Dr Apt 424 League City, TX | 2.0 | 2.0 | 1067 | $1,589 | $1.49 | 7d | 1 | 1.15mi |
| 301 N Wesley Dr Unit 3174 League City, TX | 3.0 | 2.0 | 1445 | $1,640 | $1.13 | 0d | 1 | 1.15mi |
| 301 N Wesley Dr Apt 422 League City, TX | 2.0 | 2.0 | 1067 | $1,589 | $1.49 | 9d | 1 | 1.15mi |
| 301 N Wesley Dr Unit 338 League City, TX | 2.0 | 2.0 | 1067 | $1,613 | $1.51 | 12d | 1 | 1.15mi |
| 301 N Wesley Dr Unit 334 League City, TX | 3.0 | 2.0 | 1445 | $2,084 | $1.44 | 45d | 1 | 1.15mi |
| 301 N Wesley Dr Unit 2112 League City, TX | 2.0 | 2.0 | 1067 | $1,573 | $1.47 | 0d | 1 | 1.15mi |
| 350 N Wesley Dr League City, TX | 1.0–2.0 | 1.0–2.0 | 872 | $2,120 | $2.43 | 0d | 15 | 1.15mi |
| 2205 W Walker St Unit 3174 League City, TX | 3.0 | 2.0 | 1434 | $2,149 | $1.50 | 0d | 1 | 1.18mi |
| 2205 W Walker St Unit 2238 League City, TX | 3.0 | 2.0 | 1434 | $1,975 | $1.38 | 45d | 1 | 1.18mi |
| 2205 W Walker St Unit 2228 League City, TX | 2.0 | 2.0 | 1093 | $1,599 | $1.46 | 0d | 1 | 1.18mi |
| 2205 W Walker St Unit 2174 League City, TX | 2.0 | 2.0 | 1093 | $1,532 | $1.40 | 18d | 1 | 1.18mi |
| 2205 W Walker St Unit 2262 League City, TX | 2.0 | 2.0 | 1093 | $1,565 | $1.43 | 14d | 1 | 1.18mi |
| 1627 Texas Ave League City, TX | 4.0 | 2.0 | 1430 | $2,800 | $1.96 | 45d | 1 | 1.21mi |
| 1521 Pearl Dr League City, TX | 4.0 | 2.5 | 1747 | $2,500 | $1.43 | 0d | 1 | 1.23mi |
| 1612 2nd St League City, TX | 3.0 | 2.0 | 1496 | $2,200 | $1.47 | 45d | 1 | 1.31mi |
| 1617 3rd St League City, TX | 4.0 | 2.0 | 1687 | $2,150 | $1.27 | 45d | 1 | 1.34mi |
| 306 Lafayette Ln League City, TX | 4.0 | 2.0 | 2232 | $2,250 | $1.01 | 45d | 1 | 1.41mi |
| 1835 Wren Dr League City, TX | 3.0 | 2.0 | 1092 | $1,595 | $1.46 | 3d | 1 | 1.49mi |
Listing history 35 events
-
2026-06-17days on market $221,999 Pending 26 DOM
-
2026-06-16days on market $221,999 Pending 25 DOM
-
2026-06-15days on market $221,999 Pending 24 DOM
-
2026-06-13days on market $221,999 Pending 22 DOM
-
2026-06-13days on market $221,999 Pending 21 DOM
-
2026-06-10status $221,999 Pending 18 DOM
-
2026-06-09days on market $221,999 Active 18 DOM
-
2026-06-08days on market $221,999 Active 17 DOM
-
2026-06-07days on market $221,999 Active 16 DOM
-
2026-06-04days on market $221,999 Active 13 DOM
-
2026-06-03days on market $221,999 Active 12 DOM
-
2026-06-02days on market $221,999 Active 11 DOM
-
2026-06-01days on market $221,999 Active 10 DOM
-
2026-05-31days on market $221,999 Active 9 DOM
-
2026-05-07historical
-
2026-01-14price $221,999
-
2025-12-19price $226,999
-
2025-10-22$233,999 Active
-
2025-10-22historical
-
2025-10-20price $239,000
-
2025-08-19price $245,000
-
2025-05-16$250,000 Active
-
2023-10-12historical $1,800
-
2023-10-12historical
-
2023-10-01$1,800
-
2023-03-08$240,000 Active
-
2021-07-07soldstatus
-
2019-06-28soldstatus Sold
-
2019-06-28soldstatus
-
2019-05-16status Pending
-
2019-05-03$220,000 Active
-
2018-09-07soldstatus Sold
-
2018-09-03status Pending
-
2018-08-28status Option Pending
-
2018-08-22$100,000 Active
ⓘ Source: listings_history table (triggers on properties + properties_extension) + one-shot
backfill from property_details.listing_events for pre-trigger history.
Tax reassessment forecast TX · Resets to sale price
- Current annual tax
- $4,931 · $411/mo
- Projected year-2 tax
- $4,931 · $411/mo
- Expected delta
- $0/yr ($0/mo · 0.0%)
ⓘ Screening estimate from a state-policy table — verify with the county assessor before closing.
Climate risk First Street
- Flood 4/10 Moderate FEMA zone X (unshaded) · 22% chance over 30 yrs
- Wildfire 1/10 Low
- Heat 10/10 Extreme 7 d/yr ≥108°F today · 25 d/yr by 30 yrs out
- Wind 9/10 Extreme 99% chance of damaging wind over 30 yrs
- Air quality 2/10 Low 1 unhealthy d/yr today · 1 by 30 yrs out
Nearby sold comps map
Loading sold comps map…
Walkable amenities ~0.75 mi
Loading nearby amenities…
Taxation est. · year 1
- Rental income
- $22,409
- − Mortgage interest
- −$12,435
- − Property taxes
- −$4,931
- − Insurance
- −$1,110
- − Repairs & maintenance
- −$1,793
- − Management
- −$1,793
- − Depreciation
- −$6,458
- Taxable loss
- −$6,111
- Est. tax savings @ 24.0%
- +$1,467
- After-tax cash flow
- $-842/yr
For passive investors: Depreciation is non-cash, so a rental often shows a tax loss while cash-flowing — sheltering income. Rental losses are passive: they offset passive income freely, and up to $25,000/yr can offset ordinary (W-2) income if you actively participate and your MAGI is under $100k (phasing out to $0 by $150k); unused losses carry forward. On sale, claimed depreciation is recaptured at up to 25%, and gains may owe capital-gains tax (a 1031 exchange can defer both). Figures are a year-1 estimate at your 24.0% rate — not tax advice; consult a CPA.
Schools (NCES district)
- District
- Clear Creek ISD
- NCES district ID
- 4814280
- Math proficiency
- 48% ▼ -10.00%
- Reading proficiency
- 54% ▼ -4.00%
- Median HH income
- $80,240
- Composite
- 46.49/100
- National rank
- #2431
- State rank
- #114 of 826 in TX
Livability — League City
- Score
- 75/100
- State rank
- #135
- US rank
- #3961
Category grades
Schools grade is shown separately in the Schools card above.
Census & demographics
- Census place
- League City, TX
- County
- Galveston County · 357,330 people
- City population
- 98,109
- Metro
- Houston-The Woodlands-Sugar Land, TX
- Population (ZIP)
- 98,109
- Household income
- $122,722
- Rent vs Own
- Severe rent burden
- 2226.0
Population outlook (Galveston County) Hauer SSP2
- Today (2025)
- 390,640 people
- By 2030
- 425,226 · +8.9%
- By 2040
- 493,765 · +26.4%
- By 2050
- 559,698 · +43.3%
- By 2075
- 719,260 · +84.1%
- By 2100
- 819,628 · +109.8%
Race, ethnicity, and origin ACS 2023
- Neighborhood character
- Majority White (64%)
- Race & ethnicity
- White 64% Hispanic / Latino 19% Two or more races 12% Black 6% Asian 5%
- Hispanic origin (detail)
- Mexican 13%
- Common ancestry
- Italian 3% Lithuanian 2% Romanian 2%
- Foreign-born
- 11% · Canada, Vietnam, China
- Languages at home
- 82% English-only · Spanish 11% Other Asian/Pacific 1% Other Indo-European 1%
Political lean MEDSL · Galveston
- 2024 margin
- Strong R (+27.4) · D 35.7% · R 63.1% · Other 1.2%
- 2008→2024 swing
- -7.9pp toward R · 2008: -19.5pp · 2024: -27.4pp
- All cycles
- 2024: R+27.4 2020: R+22.6 2016: R+22.6 2012: R+26.9 2008: R+19.5
Not yet ingested
- Civics
- —
Market trends
- HPI YoY
- ▼ -100.70%
- Current HPI
- 244.0714
- Rent YoY
- ▲ 0.78%
- Metro
- Houston-The Woodlands-Sugar Land, TX
- State GDP YoY
- ▲ 3.95%
- F500 in state
- 110
Industry mix (Fortune 500 HQ in TX)
| Industry | F500 HQs | Revenue |
|---|---|---|
| Energy | 16 | $1,198B |
|
||
| Technology | 5 | $198B |
|
||
| Engineering / Construction | 4 | $72B |
|
||
| Energy Services | 3 | $60B |
|
||
| Utilities | 3 | $41B |
|
||
| Healthcare | 2 | $330B |
|
||
Price history
+122.0% since first listed24 events — show timeline
- 2026-06-18 Pending — HARMLS
- 2026-06-09 Pending — HARMLS
- 2026-05-22 Listed $221,999 HARMLS
- 2026-05-07 Listing Removed — HARMLS
- 2026-01-14 Price Changed $221,999 HARMLS
- 2025-12-19 Price Changed $226,999 HARMLS
- 2025-10-22 Listing Removed — HARMLS
- 2025-10-22 Listed $233,999 HARMLS
- 2025-10-20 Price Changed $239,000 HARMLS
- 2025-08-19 Price Changed $245,000 HARMLS
- 2025-05-16 Listed $250,000 HARMLS
- 2023-10-12 Rental Removed $1,800 BUILDIUM
- 2023-10-12 Listing Removed — HARMLS
- 2023-10-01 Listed for Rent $1,800 BUILDIUM
- 2023-03-08 Listed $240,000 HARMLS
- 2021-07-07 Sold (Public Records) — Public Records
- 2019-06-28 Sold (Public Records) — Public Records
- 2019-06-28 Sold (MLS) — HARMLS
- 2019-05-16 Pending — HARMLS
- 2019-05-03 Listed $220,000 HARMLS
- 2018-09-07 Sold (MLS) — HARMLS
- 2018-09-03 Pending — HARMLS
- 2018-08-28 Pending — HARMLS
- 2018-08-22 Listed $100,000 HARMLS
Property tax history
+7.3%/yrLatest (2025): $4,931 · +4.6% YoY. Source: county tax records.
Cash-flow waterfall
monthlySold comps — $/sqft
last 12 mo · ≤1 miLoading sold comps…