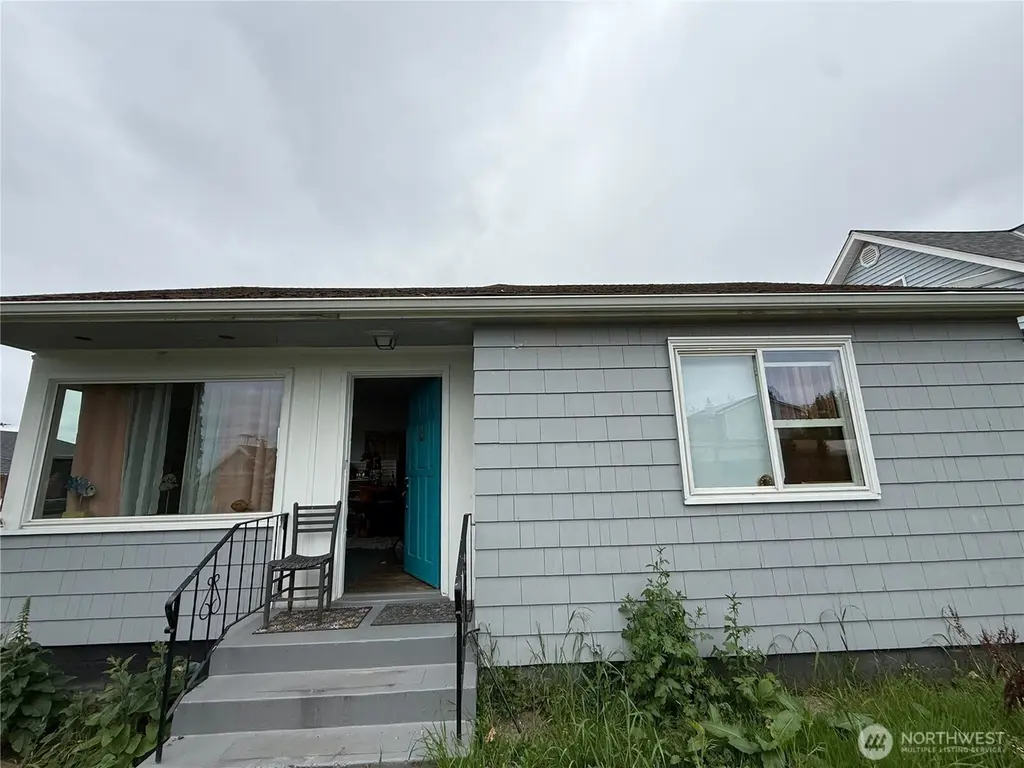
1210 E 35th St · Tacoma, WA
Flood risk 1/10 · Minimal
- FEMA flood zone
- X (unshaded)
- Chance of flooding over 30 yrs
- 0.0%
- Est. flood insurance / yr
- $507 – $1,088
Fire risk 1/10 · Minimal
- Est. fire insurance / yr
- $604 – $1,122
Heat risk 3/10 · Minor
- Hot days now (above 87°F)
- 7 days/yr
- Hot days in 30 yrs
- 15 days/yr
Wind risk 1/10 · Minimal
- Chance of severe wind over 30 yrs
- —
Air-quality risk 7/10 · Major
- Unhealthy air days now
- 10 days/yr
- Unhealthy air days in 30 yrs
- 12 days/yr
Risk factors via First Street. Map © Google.
Why this score? — see what drove the D+ grade
The composite is a weighted blend of 9 inputs, each scored 0–100. Each bar is that input's sub-score; the figure is the points it added to the 100-point composite (weight × sub-score).
- ARV discount +15.0/15.0
- Cash flow +12.9/30.0
- Schools +4.2/10.0
- DSCR +3.9/10.0
- Livability +3.9/5.0
- 1% rule +3.7/10.0
- Rent growth +2.9/5.0
- Condition / age +2.5/5.0
- Appreciation +0.0/10.0
$275,000
🖨 Deal sheet 📄 Offer letter ✓ Due diligence
Listing remarks
Great investment property in an up-and-coming location with lots of potential. Paved alley-access for possible DADU. As-is estate sale. Cash or rehab loan only. All existing appliances convey with property. Buyer to verify all details.
Key facts
- Paved alley-access
- Investment property
- Existing appliances
Tags
Property features AI
Finance
- Financial info: Listing terms: Cash or rehab loan
Exterior
- Parking: 2 uncovered parking spaces; Driveway and off-street parking
- Security: Partially fenced
- Utilities: Public water; Sewer connected; Electric power
- Home design: Single-family residence; One story; Built on lot; Main entry
- Construction: Wood construction; Composition (shingle) roof
- Exterior features: Wood exterior; Wood products; Partially fenced yard; Alley access; Paved surfaces; Sidewalk
Interior
- Bedrooms: 3 bedrooms (all on the main level)
- Flooring: Hardwood
- Bathrooms: One three-quarter bathroom; One half bathroom; Two total main-level bathrooms (one three-quarter and one half); One shower
- Heating & cooling: Baseboard heating; Forced air cooling; Electric energy source
- Interior features: Hardwood floors; Partially fenced security
Neighborhood map
What this means for you Summary
Snapshot
- This is a 3-bed/2.0-bath single-family listed at $275k.
Deal economics
- At list price, monthly cash flow is $-18 ($-215/yr) — negative.
- To cash-flow at today's rent, offer at most $272k (0.9% below list).
- To meet the 1% rule (rent ≥ 1% of price), the offer needs to be $238k (13.3% below list).
- Recommended offer: $238k (13.3% below list) — sets the bar for 1% rule.
- Cap rate 6.2% vs local median 2.9% in Tacoma — top-decile yield for the area; either an underpriced asset or a hidden risk that comps aren't pricing in. Stress-test before assuming the spread holds.
Location & tenants
- Location reads 78/100 on livability (#127 in WA, #2,535 nationally) — a middle-class / working-renter tenant base. Strengths: amenities A+, commute A+, housing A+; Watch: cost of living D, crime F.
- Tacoma School District (urban): math 40% / reading 53% proficiency, ranked #169 of 291 in WA (top 58%) — families likely to look elsewhere, expect single-tenant / working-renter base with shorter leases.
- Zoned schools: Lincoln High School (1,578 students, 73% FRL) — zoned schools average 73% FRL vs 53% district-wide (21 pts higher); higher-poverty schools than district average — tighter screening recommended.
- Market conditions: Rents rising (+1.6%/yr); 176 active listings in the ZIP; 33 comparable units currently listed for rent nearby; rentals leasing fast (median 13d on market — plan ~1-2 weeks tenant-placement turnaround); solid renter incomes; 3,209 units permitted in Pierce County in 2024 (1,269 in 5+ unit buildings).
- This rent runs 35% of the median local income ($82k/yr) — at the standard rent-burdened threshold; future hikes will face affordability resistance.
Forward outlook
- Local home prices are declining (-3.0%/yr); year-one equity from $2k of loan paydown is wiped out by about $8k of value loss. Plan a longer hold.
- Pierce County population projected at +26% by 2050 — long-run rental-demand tailwind backs the buy-and-hold thesis.
Negotiation context
- Only 3 days on market — expect competitive offers; lowballing is unlikely to land.
Risks & watch-outs
- Watch-outs: built in 1943 — expect roof / HVAC / electrical / plumbing capex.
Questions for the listing agent
- What do current leases actually rent for vs. the listed asking? Can we see a recent rent roll and the last 12 months of T-12 income?
- Built in 1943 — when were the roof, HVAC, electrical panel, plumbing, and water heater last replaced?
- Is there a deadline driving the sale (1031 exchange, divorce, estate, relocation)? That informs how much negotiation room exists.
- Schools are B-rated — typically a magnet for longer-tenancy family renters. What's the average tenant stay here, and is there a school-zone premium baked into asking?
- Crime grade is F in this area — have there been break-ins, vandalism, or insurance claims at this property in the last 3 years? What carrier currently insures it and at what premium?
- The area grade is low — what's the realistic commute time and amenity access for the typical tenant pool here? Any planned neighborhood developments (good or bad) we should know about?
- What's the average days-on-market for RENTAL listings here right now (not sales)? A rising rental-DOM trend means longer vacancies and softer asking-rent achievability than the comps imply.
- What's the recent tenant-quality profile in this submarket — average credit score on applications, eviction rate, late-payment / NSF rate, and stable-employment percentage? A property-management company in the area should have these aggregated.
- How much new for-sale + rental construction is in the pipeline within 1–3 miles? Heavy new supply typically softens prices + rents 12–24 months out; constrained supply supports both.
Investment metrics
- 1% rule
- 0.87% ✗
- Cap rate
- 6.21%
- Cash-on-cash
- -0.28%
- DSCR
- 0.99
- GRM
- 9.6
CMA / ARV
- ARV (on-the-fly)
- $401,632
- Comps found
- 12
Show comp detail 12 sales within ~0.75 mi
| Address | Dist | Beds/Ba | Sqft | Sold | Price | $/sf | Match |
|---|---|---|---|---|---|---|---|
| 3592 E L St | 0.29mi | 3/2.0 | 1,250 (+2%) | 6mo | $469,900 | $376 | 79 |
| 1439 E 35th St | 0.21mi | 3/2.0 | 1,300 (+6%) | 6mo | $515,000 | $396 | 76 |
| 1621 E 34th St | 0.33mi | 3/2.0 | 1,332 (+8%) | 3mo | $417,000 | $313 | 69 |
| 3595 E K St | 0.30mi | 3/1.0 | 1,092 (-11%) | 3mo | $400,000 | $366 | 60 |
| 3607 E Spokane St | 0.42mi | 3/1.0 | 1,346 (+9%) | 1mo | $445,000 | $331 | 60 |
| 1406 E 30th St | 0.36mi | 4/1.5 (+1) | 1,332 (+8%) | 3mo | $300,000 | $225 | 60 |
| 3597 E F St | 0.52mi | 2/1.0 (-1) | 1,308 (+6%) | 1mo | $415,000 | $317 | 56 |
| 1619 E Fairbanks St | 0.35mi | 3/1.0 | 1,056 (-14%) | 2mo | $369,999 | $350 | 54 |
| 3607 E F St | 0.54mi | 3/1.0 | 1,120 (-9%) | 4mo | $365,000 | $326 | 52 |
| 3715 E Spokane St | 0.53mi | 3/1.0 | 1,084 (-12%) | 4mo | $315,000 | $291 | 48 |
| 2034 E Fairbanks St | 0.67mi | 4/1.0 (+1) | 1,308 (+6%) | 6mo | $425,000 | $325 | 44 |
| 3831 E I St | 0.65mi | 3/2.0 | 1,389 (+13%) | 6mo | $440,000 | $317 | 43 |
Match score weights: distance 35% · size 25% · config 20% · recency 20%. Top-matched comps best support the ARV.
Projected returns pro-forma
-3.0% appreciation · 1.64% rent growth · sell at horizon
- IRR
- -18.3%
- Equity multiple
- 0.37×
- Total profit
- $-48,887
- Equity at exit
- $41,003
- IRR
- -13.5%
- Equity multiple
- 0.26×
- Total profit
- $-56,742
- Equity at exit
- $23,777
Cash invested: $77,000 (down + closing). Projections, not guarantees.
Landlord ↔ Tenant lean methodology
- Overall (STATE)
- 28 Tenant-Leaning
- State Washington
- 28 Tenant-Leaning · D+8
- County
- — inherits STATE
- City
- — inherits STATE
ZIP-level market 98404
- Rents YoY
- 1.6%
- Active inventory
- 176
- Price-to-rent
- 9.6×
Monthly cashflow live
- Estimated rent
- $2,383 high interval (Pro) →
- Mortgage (P&I)
- −$1,442
- Tax est. 1.5%
- −$344 /mo · $4,125/yr
- Insurance
- −$115
- HOA
- −$0
- Vacancy / Maint / Mgmt
- −$500
- Net cashflow
- $-18
Break-even live
UW: 25.0% down · 7.5% · 30yr · 1.5% tax · 5.0% vac · 8.0% maint · 8.0% mgmt
Financing live
Cash to close
- Down payment
- $68,750
- Closing costs
- $8,250
- Reserves months
- —
- Total cash needed
- —
Loan-product check · same deal, 3 products live
Conventional
25% down · 7.5% · 30yr
- Down + closing
- —
- Monthly P&I
- —
- Monthly cashflow
- —
- DSCR
- —
- Eligible?
- —
Personal DTI + credit; lowest rate.
DSCR
20% down · 8.5% · 30yr
- Down + closing
- —
- Monthly P&I
- —
- Monthly cashflow
- —
- DSCR
- —
- Eligible?
- —
No personal income docs; deal must DSCR.
Hard money
10% down · 12.0% · 12mo
- Down + closing
- —
- Monthly P&I
- —
- Monthly cashflow
- —
- DSCR
- —
- Eligible?
- —
Short-term bridge; refi at stabilization.
Rent comps 33 comps
| Address | Beds | Baths | Sqft | Rent | $/sqft | DOM | Units | Dist |
|---|---|---|---|---|---|---|---|---|
| 3562 E L St Tacoma, WA | 3.0 | 2.0 | 1200 | $2,397 | $2.00 | 24d | 1 | 0.21mi |
| 3611 E Howe St Tacoma, WA | 2.0 | 1.0 | 938 | $2,020 | $2.15 | 15d | 1 | 0.35mi |
| 522 E 32nd St Unit C Tacoma, WA | 2.0 | 1.0 | 843 | $1,845 | $2.19 | 2d | 1 | 0.53mi |
| 1405 E 38th St Tacoma, WA | 3.0 | 2.5 | 1265 | $2,650 | $2.09 | 1d | 1 | 0.56mi |
| 3599 E E St Tacoma, WA | 2.0 | 1.0 | 950 | $1,399 | $1.47 | 24d | 1 | 0.59mi |
| 416 E Wright Ave Unit 2 Tacoma, WA | 2.0 | 1.0 | 750 | $1,450 | $1.93 | 24d | 1 | 0.59mi |
| 409 E 34th St Tacoma, WA | 2.0 | 1.5 | 1008 | $2,000 | $1.98 | 24d | 1 | 0.60mi |
| 3101 E D St Tacoma, WA | 1.0–2.0 | 1.0 | 800 | $1,550 | $1.94 | 3d | 3 | 0.63mi |
| 2036 E Morton St Tacoma, WA | 3.0 | 1.0 | 889 | $3,300 | $3.71 | 1d | 1 | 0.64mi |
| 3571 E B St Tacoma, WA | 4.0 | 1.5 | 1276 | $2,637 | $2.07 | 11d | 1 | 0.76mi |
| 210 E 36th St Unit B Tacoma, WA | 2.0 | 1.0 | 800 | $1,700 | $2.12 | 2d | 1 | 0.78mi |
| 4305 E M St Tacoma, WA | 2.0 | 1.0 | 1500 | $2,300 | $1.53 | 2d | 1 | 0.89mi |
| 3201 Pacific Ave #1007 Tacoma, WA | 2.0 | 2.0 | 1280 | $2,500 | $1.95 | 24d | 1 | 0.92mi |
| 4051 E F St Tacoma, WA | 3.0 | 1.0 | 1168 | $2,500 | $2.14 | 24d | 1 | 0.94mi |
| 3202 Pacific Ave Tacoma, WA | 2.0 | 1.0 | 750 | $1,674 | $2.23 | 24d | 2 | 0.96mi |
| 3310 S C St Unit 3302 Tacoma, WA | 2.0 | 2.5 | 1008 | $2,550 | $2.53 | 24d | 1 | 1.01mi |
| 3310 S C St Unit 3304 Tacoma, WA | 2.0 | 2.5 | 1008 | $2,395 | $2.38 | 5d | 1 | 1.01mi |
| 3310 S C St Unit 3310 Tacoma, WA | 2.0 | 2.5 | 1008 | $2,595 | $2.57 | 24d | 1 | 1.01mi |
| 3310 S C St Unit 3306 Tacoma, WA | 2.0 | 2.5 | 1008 | $2,495 | $2.48 | 24d | 1 | 1.01mi |
| 201 E 25th St Tacoma, WA | 3.0 | 1.0–2.0 | 663 | $3,213 | $4.85 | 1d | 8 | 1.01mi |
| 619 S 35th St Unit A Tacoma, WA | 2.0 | 2.5 | 1019 | $2,650 | $2.60 | 24d | 1 | 1.25mi |
| 2515 Jefferson Ave Tacoma, WA | 2.0 | 1.0–2.0 | 744 | $2,700 | $3.63 | 2d | 15 | 1.25mi |
| 4609 E C St Unit C Tacoma, WA | 2.0 | 1.0 | 900 | $2,200 | $2.44 | 18d | 1 | 1.30mi |
| 1933 Dock St Tacoma, WA | 2.0 | 1.0–2.0 | 762 | $2,925 | $3.84 | 1d | 12 | 1.30mi |
| 2120 Commerce St Tacoma, WA | 1.0–2.0 | 1.0–2.0 | 782 | $2,750 | $3.51 | 10d | 6 | 1.35mi |
| 217 S 45th St Tacoma, WA | 3.0 | 2.5 | 1352 | $2,700 | $2.00 | 22d | 1 | 1.37mi |
| 409 S 23rd St Tacoma, WA | 2.0 | 1.0 | 565 | $1,880 | $3.33 | 3d | 30 | 1.39mi |
| 4640 E B St Tacoma, WA | 2.0 | 2.0 | 1100 | $2,500 | $2.27 | 24d | 1 | 1.41mi |
| 1705 Dock St Tacoma, WA | 2.0 | 1.0–2.0 | 929 | $3,750 | $4.04 | 1d | 21 | 1.46mi |
| 3824 S Park Ave Tacoma, WA | 2.0 | 1.0 | 1100 | $1,935 | $1.76 | 16d | 1 | 1.46mi |
| 3824 Park Ave S Unit A Tacoma, WA | 2.0 | 1.0 | 1100 | $1,835 | $1.67 | 2d | 1 | 1.46mi |
| 3718 S Yakima Ave Unit 2 Tacoma, WA | 2.0 | 1.0 | 850 | $1,800 | $2.12 | 3d | 1 | 1.48mi |
| 618 S 23rd St Unit 618 Tacoma, WA | 3.0 | 2.5 | 1362 | $5,400 | $3.96 | 12d | 1 | 1.50mi |
Listing history 1 events
-
2026-05-20$275,000 Active
ⓘ Source: listings_history table (triggers on properties + properties_extension) + one-shot
backfill from property_details.listing_events for pre-trigger history.
Climate risk First Street
- Flood 1/10 Low FEMA zone X (unshaded) · 0% chance over 30 yrs
- Wildfire 1/10 Low
- Heat 3/10 Moderate 7 d/yr ≥87°F today · 15 d/yr by 30 yrs out
- Wind 1/10 Low
- Air quality 7/10 Severe 10 unhealthy d/yr today · 12 by 30 yrs out
Nearby sold comps map
Loading sold comps map…
Walkable amenities ~0.75 mi
Loading nearby amenities…
Taxation est. · year 1
- Rental income
- $28,595
- − Mortgage interest
- −$15,404
- − Property taxes
- −$4,125
- − Insurance
- −$1,375
- − Repairs & maintenance
- −$2,288
- − Management
- −$2,288
- − Depreciation
- −$8,000
- Taxable loss
- −$4,884
- Est. tax savings @ 24.0%
- +$1,172
- After-tax cash flow
- $957/yr
For passive investors: Depreciation is non-cash, so a rental often shows a tax loss while cash-flowing — sheltering income. Rental losses are passive: they offset passive income freely, and up to $25,000/yr can offset ordinary (W-2) income if you actively participate and your MAGI is under $100k (phasing out to $0 by $150k); unused losses carry forward. On sale, claimed depreciation is recaptured at up to 25%, and gains may owe capital-gains tax (a 1031 exchange can defer both). Figures are a year-1 estimate at your 24.0% rate — not tax advice; consult a CPA.
Schools (NCES district)
- District
- Tacoma School District
- NCES district ID
- 5308700
- Math proficiency
- 40% ▬ 0.00%
- Reading proficiency
- 53% ▲ 1.00%
- Median HH income
- $52,467
- Composite
- 42.25/100
- National rank
- #6987
- State rank
- #169 of 291 in WA
Livability — Tacoma
- Score
- 78/100
- State rank
- #127
- US rank
- #2535
Category grades
Schools grade is shown separately in the Schools card above.
Census & demographics
- Census place
- Tacoma, WA
- County
- Pierce County · 788,257 people
- Metro
- Seattle-Tacoma-Bellevue, WA
- Population (ZIP)
- 35,961
- Household income
- $82,191
- Rent vs Own
- Severe rent burden
- 989.0
Population outlook (Pierce County) Hauer SSP2
- Today (2025)
- 956,648 people
- By 2030
- 1,010,862 · +5.7%
- By 2040
- 1,113,170 · +16.4%
- By 2050
- 1,206,524 · +26.1%
- By 2075
- 1,436,425 · +50.2%
- By 2100
- 1,563,654 · +63.5%
Race, ethnicity, and origin ACS 2023
- Neighborhood character
- Highly diverse neighborhood (Simpson 0.77)
- Race & ethnicity
- White 38% Hispanic / Latino 20% Asian 17% Two or more races 16% Black 11% Native American 3% Pacific Islander 1%
- Hispanic origin (detail)
- Mexican 16% Puerto Rican 1%
- Common ancestry
- Italian 3% Portuguese 2% Slovak 1%
- Foreign-born
- 20% · Canada, Vietnam, South Korea
- Languages at home
- 68% English-only · Spanish 13% Other Asian/Pacific 7% Vietnamese 4%
Political lean MEDSL · Pierce
- 2024 margin
- D (+10.8) · D 53.9% · R 43.1% · Other 3.0%
- 2008→2024 swing
- -1.4pp toward R · 2008: 12.2pp · 2024: 10.8pp
- All cycles
- 2024: D+10.8 2020: D+11.2 2016: D+7.5 2012: D+11.0 2008: D+12.2
Not yet ingested
- Civics
- —
Market trends
- HPI YoY
- ▼ -462.09%
- Current HPI
- 360.0843
- Rent YoY
- ▲ 1.64%
- Metro
- Seattle-Tacoma-Bellevue, WA
- State GDP YoY
- ▲ 4.65%
- F500 in state
- 22
Industry mix (Fortune 500 HQ in WA)
| Industry | F500 HQs | Revenue |
|---|---|---|
| Retail | 2 | $269B |
|
||
| Technology / Retail | 1 | $638B |
|
||
| Technology | 1 | $245B |
|
||
| Telecommunications | 1 | $38B |
|
||
| Food / Beverage | 1 | $36B |
|
||
| Automotive / Trucks | 1 | $34B |
|
||
Price history
1 event — show timeline
- 2026-05-20 Listed $275,000 NWMLS as Distributed by MLS Grid
Property tax history
+0.7%/yrLatest (2026): $50 · -2.6% YoY. Source: county tax records.
Cash-flow waterfall
monthlySold comps — $/sqft
last 12 mo · ≤1 miLoading sold comps…