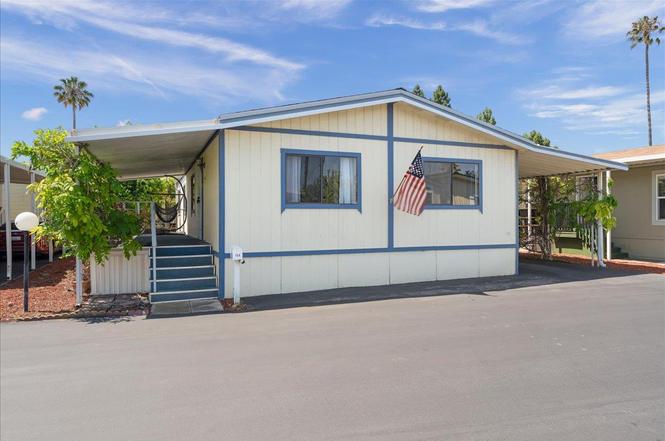
1075 Space Park Way #154 · Mountain View, CA
Flood risk 3/10 · Minor
- FEMA flood zone
- X
- Chance of flooding over 30 yrs
- 0.17%
- Est. flood insurance / yr
- $507 – $1,088
Fire risk 1/10 · Minimal
- Est. fire insurance / yr
- $659 – $1,223
Heat risk 4/10 · Minor
- Hot days now (above 89°F)
- 7 days/yr
- Hot days in 30 yrs
- 15 days/yr
Wind risk 1/10 · Minimal
- Chance of severe wind over 30 yrs
- —
Air-quality risk 7/10 · Major
- Unhealthy air days now
- 13 days/yr
- Unhealthy air days in 30 yrs
- 13 days/yr
Risk factors via First Street. Map © Google.
Why this score? — see what drove the B grade
The composite is a weighted blend of 9 inputs, each scored 0–100. Each bar is that input's sub-score; the figure is the points it added to the 100-point composite (weight × sub-score).
- Cash flow +30.0/30.0
- DSCR +10.0/10.0
- 1% rule +9.1/10.0
- Schools +8.0/10.0
- Livability +4.2/5.0
- Appreciation +3.4/10.0
- Rent growth +3.4/5.0
- Condition / age +2.5/5.0
- ARV discount +0.0/15.0
$298,000
🖨 Deal sheet 📄 Offer letter ✓ Due diligence
Listing remarks MLS
Charming Mountain View home in the highly desirable Santiago Villa community, located in the heart of the North Bayshore technology corridor. This well-maintained residence features a spacious 2-bedroom floor plan plus bonus room, 2 full bathrooms, and approximately 1,152 square feet of living space. The open-concept layout offers abundant natural light, central heating and air conditioning, luxury vinyl tile flooring, an oversized walk-in closet in the primary suite, and an in-unit washer and dryer. Enjoy a spacious front porch and a private backyard with mature landscaping, a Meyer lemon tree, and room for relaxing or entertaining. Ideally located minutes from Google, NASA Ames Research Center, LinkedIn, Intuit, Shoreline Amphitheatre, Stevens Creek Trail, Downtown Mountain View, Caltrain, and major commuter routes including Highways 101 and 85. Residents enjoy resort-style amenities including a clubhouse, swimming pool, hot tub, sauna, fitness center, BBQ area, community garden plots, and childrens play area. Experience the perfect blend of comfort, convenience, and Silicon Valley living.
Key facts
- Private backyard
- Mountain view home
- Meyer lemon tree
Tags
Property features AI
Finance
- HOA & community: Clubhouse; Community pool; Playground; Car wash area
Exterior
- Parking: Carport (2 spaces); Assigned space number 154; Leased land park home site; Space rent applies
- Utilities: Public water; Public sewer; Public utilities
- Home design: Single-story
- Exterior features: Composition roof; Assessor-reported lot information; Pets allowed (with number restrictions)
Interior
- Bedrooms: 2 bedrooms
- Bathrooms: 2 full bathrooms
- Heating & cooling: Central forced air heating (gas); Central forced air cooling
- Interior features: Dining bar; no formal dining room; Central forced air cooling; Central forced air heating with gas
Neighborhood map
What this means for you Summary
Snapshot
- This is a 2-bed/2.0-bath manufactured listed at $298k.
Deal economics
- At list price, monthly cash flow is $1k ($15k/yr) — positive.
- The deal already cash-flows at list — no discount required.
- Meets the 1% rule at list price ($4k rent vs $298k).
- Cap rate 11.3% vs local median 1.4% in Mountain View — top-decile yield for the area; either an underpriced asset or a hidden risk that comps aren't pricing in. Stress-test before assuming the spread holds.
Location & tenants
- Location reads 84/100 on livability (#14 in CA, #671 nationally) — a professional / high-income tenant draw. Strengths: amenities A+, commute A+, employment A+; Watch: crime D+, cost of living F.
- Mountain View-Los Altos Union High (urban): math 77% / reading 86% proficiency, ranked #11 of 517 in CA (top 2%) — strong family-tenant draw, lease renewals of 3-5y typical.
- Zoned schools: Mountain View High (math 83% / reading 89%, grade A, #25 of 1,170 statewide, top 2%, 2,220 students, 13% FRL).
- Market conditions: Rents rising (+3.6%/yr); 57 active listings in the ZIP; 18 comparable units currently listed for rent nearby; rentals leasing fast (median 2d on market — plan ~1-2 weeks tenant-placement turnaround); high-income renter base; 3,838 units permitted in Santa Clara County in 2024 (1,886 in 5+ unit buildings).
Forward outlook
- Local home prices are declining (-3.0%/yr); year-one equity from $2k of loan paydown is wiped out by about $9k of value loss. Plan a longer hold.
- Santa Clara County population projected at +24% by 2050 — long-run rental-demand tailwind backs the buy-and-hold thesis.
- At projected returns (-3.0% appreciation + 3.6% rent growth), your $83k cash investment doubles in ~7 years — after that, you're playing with house money.
Negotiation context
- Only 2 days on market — expect competitive offers; lowballing is unlikely to land.
- 5 sale attempts since 13y ago with the ask held roughly flat each time — persistent listings suggest the price (not the market) is what's stuck; bring a comps-based counter.
- Current owner paid $132k; list at $298k implies a 126% gain — meaningful room to come down on a strong offer.
Questions for the listing agent
- Built in 1972 — when were the roof, HVAC, electrical panel, plumbing, and water heater last replaced?
- Is there a deadline driving the sale (1031 exchange, divorce, estate, relocation)? That informs how much negotiation room exists.
- Schools are A-rated — typically a magnet for longer-tenancy family renters. What's the average tenant stay here, and is there a school-zone premium baked into asking?
- Crime grade is D in this area — have there been break-ins, vandalism, or insurance claims at this property in the last 3 years? What carrier currently insures it and at what premium?
- What's the average days-on-market for RENTAL listings here right now (not sales)? A rising rental-DOM trend means longer vacancies and softer asking-rent achievability than the comps imply.
- What's the recent tenant-quality profile in this submarket — average credit score on applications, eviction rate, late-payment / NSF rate, and stable-employment percentage? A property-management company in the area should have these aggregated.
- How much new for-sale + rental construction is in the pipeline within 1–3 miles? Heavy new supply typically softens prices + rents 12–24 months out; constrained supply supports both.
Investment metrics
- 1% rule
- 1.41% ✓
- Cap rate
- 11.33%
- Cash-on-cash
- 17.98%
- DSCR
- 1.80
- GRM
- 5.9
CMA / ARV
- ARV (on-the-fly)
- $239,616
- Comps found
- 6
Show comp detail 6 sales within ~0.75 mi
| Address | Dist | Beds/Ba | Sqft | Sold | Price | $/sf | Match |
|---|---|---|---|---|---|---|---|
| 1075 Space Park Way #301 | 0.00mi | 2/2.0 | 1,152 (0%) | 8mo | $215,000 | $187 | 93 |
| 1075 Space Park Way #171 | 0.18mi | 2/2.0 | 1,152 (0%) | 4mo | $240,000 | $208 | 89 |
| 1075 Space Park Way #52 | 0.00mi | 3/2.0 (+1) | 1,248 (+8%) | 2mo | $270,000 | $216 | 79 |
| 1075 Space Park Way #60 | 0.21mi | 2/2.0 | 1,080 (-6%) | 3mo | $200,000 | $185 | 77 |
| 1075 Space Park Way #145 | 0.19mi | 2/2.0 | 1,040 (-10%) | 2mo | $195,000 | $188 | 73 |
| 1075 Space Park Way #138 | 0.18mi | 2/2.0 | 1,248 (+8%) | 6mo | $289,000 | $232 | 73 |
Match score weights: distance 35% · size 25% · config 20% · recency 20%. Top-matched comps best support the ARV.
Projected returns pro-forma
-3.0% appreciation · 3.56% rent growth · sell at horizon
- IRR
- 10.2%
- Equity multiple
- 1.40×
- Total profit
- $33,757
- Equity at exit
- $44,433
- IRR
- 19.7%
- Equity multiple
- 2.70×
- Total profit
- $142,011
- Equity at exit
- $25,766
Cash invested: $83,440 (down + closing). Projections, not guarantees.
Landlord ↔ Tenant lean methodology
- Overall (CITY)
- 0 Strongly Tenant-Friendly
- State California
- 18 Strongly Tenant-Friendly · D+13
- County
- — inherits STATE
- City Mountain View
- 0 Strongly Tenant-Friendly · D+34
ZIP-level market 94043
- Home prices YoY
- -0.9%
- Rents YoY
- 3.6%
- Active inventory
- 57
- Price-to-rent
- 5.9×
Monthly cashflow live
- Estimated rent
- $4,189 high interval (Pro) →
- Mortgage (P&I)
- −$1,563
- Tax est. 1.5%
- −$372 /mo · $4,470/yr
- Insurance
- −$124
- HOA
- −$0
- Vacancy / Maint / Mgmt
- −$880
- Net cashflow
- $1,250
Break-even live
UW: 25.0% down · 7.5% · 30yr · 1.5% tax · 5.0% vac · 8.0% maint · 8.0% mgmt
Financing live
Cash to close
- Down payment
- $74,500
- Closing costs
- $8,940
- Reserves months
- —
- Total cash needed
- —
Loan-product check · same deal, 3 products live
Conventional
25% down · 7.5% · 30yr
- Down + closing
- —
- Monthly P&I
- —
- Monthly cashflow
- —
- DSCR
- —
- Eligible?
- —
Personal DTI + credit; lowest rate.
DSCR
20% down · 8.5% · 30yr
- Down + closing
- —
- Monthly P&I
- —
- Monthly cashflow
- —
- DSCR
- —
- Eligible?
- —
No personal income docs; deal must DSCR.
Hard money
10% down · 12.0% · 12mo
- Down + closing
- —
- Monthly P&I
- —
- Monthly cashflow
- —
- DSCR
- —
- Eligible?
- —
Short-term bridge; refi at stabilization.
Rent comps 18 comps
| Address | Beds | Baths | Sqft | Rent | $/sqft | DOM | Units | Dist |
|---|---|---|---|---|---|---|---|---|
| 601 Cinnamon Cir Mountain View, CA | 2.0 | 2.5 | 1122 | $5,500 | $4.90 | 2d | 1 | 0.80mi |
| 750 N Shoreline Blvd Mountain View, CA | 1.0–3.0 | 1.0–2.0 | 937 | $4,795 | $5.11 | 1d | 1 | 0.97mi |
| 600 N Whisman Rd #462 Mountain View, CA | 3.0 | 2.0 | 950 | $4,120 | $4.34 | 1d | 1 | 1.09mi |
| 1300 Montecito Ave Unit 12 Mountain View, CA | 2.0 | 1.0 | 900 | $2,995 | $3.33 | 1d | 1 | 1.17mi |
| 1300 Montecito Ave Unit 4 Mountain View, CA | 2.0 | 2.0 | 920 | $3,250 | $3.53 | 1d | 1 | 1.17mi |
| 1300 Montecito Ave Unit 18 Mountain View, CA | 2.0 | 2.0 | 920 | $3,295 | $3.58 | 14d | 1 | 1.17mi |
| 1300 Montecito Ave Unit 16 Mountain View, CA | 2.0 | 2.0 | 920 | $3,095 | $3.36 | 1d | 1 | 1.17mi |
| 1300 Montecito Ave Unit 17 Mountain View, CA | 2.0 | 2.0 | 920 | $3,195 | $3.47 | 1d | 1 | 1.17mi |
| 37 Sherland Ave Unit 39-A Mountain View, CA | 2.0 | 1.0 | 1000 | $3,889 | $3.89 | 10d | 1 | 1.18mi |
| 1375 Montecito Ave Mountain View, CA | 1.0 | 1.0 | 950 | $2,950 | $3.11 | 1d | 1 | 1.26mi |
| 50 E Middlefield Rd Mountain View, CA | 2.0 | 2.0 | 1100 | $3,500 | $3.18 | 19d | 1 | 1.27mi |
| 555 W Middlefield Rd Mountain View, CA | 2.0 | 1.0–2.0 | 656 | $3,616 | $5.51 | 1d | 1 | 1.28mi |
| 505 Cypress Point Dr #70 Mountain View, CA | 2.0 | 1.0 | 843 | $3,500 | $4.15 | 14d | 1 | 1.33mi |
| 716 Astor Ct #1589 Mountain View, CA | 2.0 | 2.0 | 1150 | $4,100 | $3.57 | 1d | 1 | 1.36mi |
| 9 Forest Glen St #843 Mountain View, CA | 3.0 | 2.5 | 1225 | $6,080 | $4.96 | 1d | 1 | 1.37mi |
| 14 Forest Glen St #841 Mountain View, CA | 2.0 | 2.5 | 1080 | $5,170 | $4.79 | 1d | 1 | 1.37mi |
| 15 Cassandra Way #1607 Mountain View, CA | 2.0 | 2.0 | 992 | $6,770 | $6.82 | 1d | 1 | 1.47mi |
| 801 Washington St #449 Mountain View, CA | 1.0 | 1.0 | 762 | $4,930 | $6.47 | 1d | 1 | 1.50mi |
Listing history 3 events
-
2026-06-18days on market $298,000 Active 2 DOM
-
2026-06-17remarks 699-char remark
-
2026-06-17$298,000 Active 1 DOM
ⓘ Source: listings_history table (triggers on properties + properties_extension) + one-shot
backfill from property_details.listing_events for pre-trigger history.
Climate risk First Street
- Flood 3/10 Moderate FEMA zone X · 17% chance over 30 yrs
- Wildfire 1/10 Low
- Heat 4/10 Moderate 7 d/yr ≥89°F today · 15 d/yr by 30 yrs out
- Wind 1/10 Low
- Air quality 7/10 Severe 13 unhealthy d/yr today · 13 by 30 yrs out
Nearby sold comps map
Loading sold comps map…
Walkable amenities ~0.75 mi
Loading nearby amenities…
Taxation est. · year 1
- Rental income
- $50,268
- − Mortgage interest
- −$16,693
- − Property taxes
- −$4,470
- − Insurance
- −$1,490
- − Repairs & maintenance
- −$4,021
- − Management
- −$4,021
- − Depreciation
- −$8,669
- Taxable income
- $10,904
- Est. tax owed @ 24.0%
- −$2,617
- After-tax cash flow
- $12,382/yr
For passive investors: Depreciation is non-cash, so a rental often shows a tax loss while cash-flowing — sheltering income. Rental losses are passive: they offset passive income freely, and up to $25,000/yr can offset ordinary (W-2) income if you actively participate and your MAGI is under $100k (phasing out to $0 by $150k); unused losses carry forward. On sale, claimed depreciation is recaptured at up to 25%, and gains may owe capital-gains tax (a 1031 exchange can defer both). Figures are a year-1 estimate at your 24.0% rate — not tax advice; consult a CPA.
Schools (NCES district)
- District
- Mountain View-Los Altos Union High
- NCES district ID
- 0626310
- Math proficiency
- 77% ▲ 9.00%
- Reading proficiency
- 86% ▲ 4.00%
- Median HH income
- $161,233
- Composite
- 79.5/100
- National rank
- #59
- State rank
- #11 of 517 in CA
Livability — Mountain View
- Score
- 84/100
- State rank
- #14
- US rank
- #671
Category grades
Schools grade is shown separately in the Schools card above.
Census & demographics
- Census place
- Mountain View, CA
- County
- Santa Clara County · 1,806,974 people
- City population
- 84,858
- Metro
- San Jose-Sunnyvale-Santa Clara, CA
- Population (ZIP)
- 33,176
- Household income
- $203,298
- Rent vs Own
- Severe rent burden
- 979.0
Population outlook (Santa Clara County) Hauer SSP2
- Today (2025)
- 2,179,074 people
- By 2030
- 2,301,297 · +5.6%
- By 2040
- 2,528,195 · +16.0%
- By 2050
- 2,712,135 · +24.5%
- By 2075
- 2,998,701 · +37.6%
- By 2100
- 2,931,429 · +34.5%
Race, ethnicity, and origin ACS 2023
- Neighborhood character
- Highly diverse neighborhood (Simpson 0.71)
- Race & ethnicity
- White 38% Asian 33% Hispanic / Latino 19% Two or more races 16% Black 3%
- Hispanic origin (detail)
- Mexican 13%
- Common ancestry
- Lithuanian 2% Scotch-Irish 2% Italian 2%
- Foreign-born
- 42% · China, Canada, South Korea
- Languages at home
- 52% English-only · Chinese 14% Spanish 12% Other Indo-European 8%
Political lean MEDSL · Santa Clara
- 2024 margin
- Solid D (+40.0) · D 68.1% · R 28.1% · Other 3.8%
- 2008→2024 swing
- -0.9pp no change · 2008: 40.9pp · 2024: 40.0pp
- All cycles
- 2024: D+40.0 2020: D+47.4 2016: D+52.5 2012: D+42.1 2008: D+40.9
Not yet ingested
- Civics
- —
Market trends
- HPI YoY
- ▼ -3.22%
- Current HPI
- 346.0026
- Rent YoY
- ▲ 3.56%
- Metro
- San Jose-Sunnyvale-Santa Clara, CA
- State GDP YoY
- ▲ 3.21%
- F500 in state
- 116
Industry mix (Fortune 500 HQ in CA)
| Industry | F500 HQs | Revenue |
|---|---|---|
| Technology | 27 | $1,492B |
|
||
| Financial Services | 3 | $174B |
|
||
| Retail | 3 | $44B |
|
||
| Insurance | 3 | $26B |
|
||
| Media / Entertainment | 2 | $115B |
|
||
| Pharmaceuticals / Biotech | 2 | $62B |
|
||
Price history
+183.8% since first listed13 events — show timeline
- 2026-06-16 Listed $298,000 MLSListings
- 2026-06-16 Listed $298,000 bridgeMLS, Bay East AOR, or Contra Costa AOR
- 2017-01-03 Sold (MLS) $132,000 MLSListings
- 2016-11-09 Pending — MLSListings
- 2016-10-23 Price Changed $135,000 MLSListings
- 2016-09-12 Price Changed $139,000 MLSListings
- 2016-08-18 Listed $149,000 MLSListings
- 2013-09-30 Sold (MLS) $105,000 MLSListings
- 2013-09-24 Pending — MLSListings
- 2013-09-10 Pending — MLSListings
- 2013-08-31 Relisted — MLSListings
- 2013-08-14 Pending — MLSListings
- 2013-08-09 Listed $105,000 MLSListings
Cash-flow waterfall
monthlySold comps — $/sqft
last 12 mo · ≤1 miLoading sold comps…