 🏗️ New Construction
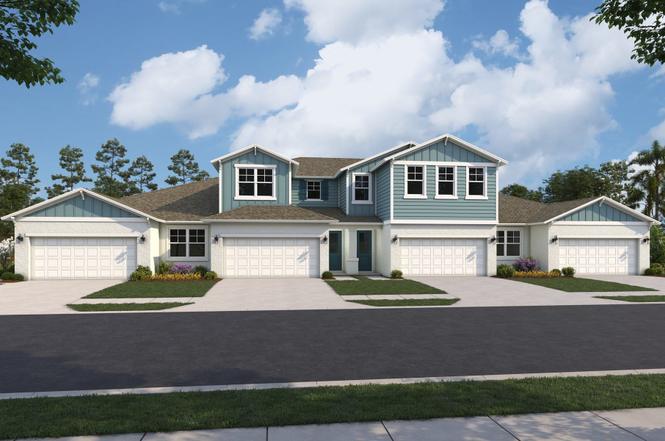
Manatee Plan · Ellenton, FL
Flood risk No data
- FEMA flood zone
- —
- Chance of flooding over 30 yrs
- —
- Est. flood insurance / yr
- —
Fire risk No data
- Est. fire insurance / yr
- —
Heat risk No data
- Hot days now (above threshold)
- —
- Hot days in 30 yrs
- —
Wind risk No data
- Chance of severe wind over 30 yrs
- —
Air-quality risk No data
- Unhealthy air days now
- —
- Unhealthy air days in 30 yrs
- —
Risk factors via First Street. Map © Google.
Why this score? — see what drove the D- grade
The composite is a weighted blend of 9 inputs, each scored 0–100. Each bar is that input's sub-score; the figure is the points it added to the 100-point composite (weight × sub-score).
- Cash flow +9.8/30.0
- ARV discount +7.5/15.0
- Schools +4.4/10.0
- Condition / age +4.0/5.0
- Livability +3.8/5.0
- 1% rule +2.9/10.0
- DSCR +2.8/10.0
- Rent growth +2.3/5.0
- Appreciation +0.0/10.0
$289,990
🖨 Deal sheet (PDF) 📄 Offer letter ✓ Due diligence
Listing remarks
The Manatee home plan offers a comfortable and efficient layout with three bedrooms and two bathrooms spread across 1,433 square feet. This charming residence features a spacious open-concept living area that seamlessly connects the living room, dining space, and a well-appointed kitchen, perfect for family gatherings and entertaining guests. Natural light floods the interior through large windows, enhancing the welcoming atmosphere. The home also includes a convenient two-car garage, providing ample storage and parking space. Designed with functionality and style in mind, the Manatee plan ensures a cozy and inviting environment for modern living.
Key facts
- 2 garage spots
- Listed 137 days
Property features AI
Finance
- Financial info: List price $289,990
Exterior
- Home design: Single-family home (Manatee plan); New construction - Plan model
Interior
- Bedrooms: 3 bedrooms
- Bathrooms: 2 full bathrooms
- Interior features: Open living area (1,433 sq ft total living area)
Neighborhood map
What this means for you Summary
Snapshot
- This is a 3-bed/2.0-bath townhouse listed at $290k. Condition is rated good.
Deal economics
- At list price, monthly cash flow is $-211 ($-3k/yr) — negative.
- The deal already cash-flows at list — no discount required.
- To meet the 1% rule (rent ≥ 1% of price), the offer needs to be $262k (9.8% below list).
- Recommended offer: $255k (12.0% below list) — sets the bar for market timing.
- Cap rate 5.5% vs local median 4.5% in Ellenton — meaningfully above typical; check what's discounted (condition, days-on-market, listing class) to confirm the premium yield is real.
Location & tenants
- Location reads 76/100 on livability (#232 in FL, #3,666 nationally) — a middle-class / working-renter tenant base. Strengths: cost of living A+, housing A+, health & safety A+; Watch: amenities F, commute F.
- Manatee (suburban): math 54% / reading 50% proficiency, ranked #26 of 73 in FL (top 36%) — acceptable for families but not a draw, mixed tenant base, ~2y average lease.
- Zoned schools: Virgil Mills Elementary School (math 69% / reading 65%, grade B+, #450 of 2,144 statewide, top 22%, 818 students, 43% FRL); Buffalo Creek Middle School (math 59% / reading 51%, grade B-, #180 of 571 statewide, top 32%, 1,127 students, 44% FRL); Palmetto High School (math 22% / reading 36%, grade F, #456 of 667 statewide, top 68%, 2,100 students, 61% FRL) — zoned schools at 50% FRL track the district average.
- Market conditions: Rents soft (-0.9%/yr); 2194 active listings in the ZIP; 18 comparable units currently listed for rent nearby; rentals at typical pace (median 23d on market — plan ~3-4 weeks tenant-placement turnaround); high-income renter base; 7,472 units permitted in Manatee County in 2024 (1,782 in 5+ unit buildings).
Forward outlook
- Local home prices are declining (-3.0%/yr); year-one equity from $2k of loan paydown is wiped out by about $10k of value loss. Plan a longer hold.
- Manatee County population projected at +43% by 2050 — long-run rental-demand tailwind backs the buy-and-hold thesis.
Negotiation context
- It's been on market 137 days — a 12% lower offer ($255k) is reasonable based on typical stale-listing flexibility.
Questions for the listing agent
- What do current leases actually rent for vs. the listed asking? Can we see a recent rent roll and the last 12 months of T-12 income?
- It's been on market 137 days. Have you received any prior offers? Is the seller open to a 12% concession, seller financing, or rate buy-down credit?
- Why hasn't it sold? Are there any deal-killer items the seller is aware of (foundation, flood, title, zoning, code violations)?
- Is there a deadline driving the sale (1031 exchange, divorce, estate, relocation)? That informs how much negotiation room exists.
- Schools are D-rated, which usually means shorter tenancies and higher turnover. Who's the typical renter profile here, and what's been the actual vacancy rate?
- The area grade is low — what's the realistic commute time and amenity access for the typical tenant pool here? Any planned neighborhood developments (good or bad) we should know about?
- What's the average days-on-market for RENTAL listings here right now (not sales)? A rising rental-DOM trend means longer vacancies and softer asking-rent achievability than the comps imply.
- What's the recent tenant-quality profile in this submarket — average credit score on applications, eviction rate, late-payment / NSF rate, and stable-employment percentage? A property-management company in the area should have these aggregated.
- How much new for-sale + rental construction is in the pipeline within 1–3 miles? Heavy new supply typically softens prices + rents 12–24 months out; constrained supply supports both.
Investment metrics
- 1% rule
- 0.79% ✗
- Cap rate
- 5.53%
- Cash-on-cash
- -2.74%
- DSCR
- 0.88
- GRM
- 10.5
CMA / ARV
- ARV (on-the-fly)
- $329,590
- Comps found
- 10
Show comp detail 10 sales within ~0.75 mi
| Address | Dist | Beds/Ba | Sqft | Sold | Price | $/sf | Match |
|---|---|---|---|---|---|---|---|
| 7574 Sea Oak Ct | 0.22mi | 3/2.0 | 1,433 (0%) | 1mo | $329,990 | $230 | 89 |
| 7626 Sea Oak Ct | 0.18mi | 3/2.0 | 1,433 (0%) | 5mo | $299,990 | $209 | 87 |
| 7610 Sea Oak Ct | 0.19mi | 3/2.0 | 1,433 (0%) | 5mo | $305,000 | $213 | 87 |
| 9148 Gulf Haven Dr | 0.19mi | 3/2.0 | 1,433 (0%) | 7mo | $319,990 | $223 | 85 |
| 9136 Gulf Haven Dr | 0.19mi | 3/2.0 | 1,433 (0%) | 8mo | $310,000 | $216 | 85 |
| 9238 Gulf Haven Dr | 0.17mi | 3/2.0 | 1,433 (0%) | 9mo | $340,000 | $237 | 85 |
| 9234 Gulf Haven Dr | 0.33mi | 3/2.0 | 1,433 (0%) | 9mo | $310,120 | $216 | 77 |
| 9222 Gulf Haven Dr | 0.30mi | 3/2.0 | 1,433 (0%) | 11mo | $335,000 | $234 | 77 |
| 9250 Gulf Haven Dr | 0.26mi | 3/2.0 | 1,433 (0%) | 16mo | $366,990 | $256 | 75 |
| 9117 Gulf Haven Dr | 0.16mi | 3/2.0 | 1,386 (-3%) | 20mo | $444,528 | $321 | 70 |
Match score weights: distance 35% · size 25% · config 20% · recency 20%. Top-matched comps best support the ARV.
Projected returns pro-forma
-3.0% appreciation · 0.0% rent growth · sell at horizon
- IRR
- -24.3%
- Equity multiple
- 0.19×
- Total profit
- $-74,445
- Equity at exit
- $49,143
- IRR
- -31.4%
- Equity multiple
- -0.21×
- Total profit
- $-111,565
- Equity at exit
- $28,497
Cash invested: $92,285 (down + closing). Projections, not guarantees.
Landlord ↔ Tenant lean methodology
- Overall (STATE)
- 87 Strongly Landlord-Friendly
- State Florida
- 87 Strongly Landlord-Friendly · R+3
- County
- — inherits STATE
- City
- — inherits STATE
ZIP-level market 34219
- Home prices YoY
- -23.7%
- Rents YoY
- -0.9%
- Active inventory
- 2194
- Price-to-rent
- 9.2×
Monthly cashflow live
- Estimated rent
- $2,617 high interval (Pro) →
- Mortgage (P&I)
- −$1,728
- Tax est. 1.5%
- −$412 /mo · $4,944/yr
- Insurance
- −$137
- HOA
- −$0
- Vacancy / Maint / Mgmt
- −$550
- Net cashflow
- $-211
Break-even live
Sensitivity live
| Price | -10% $17 | -5% $-97 | +0% $-211 | +5% $-324 | +10% $-438 |
|---|---|---|---|---|---|
| Rent | -10% $-417 | -5% $-314 | +0% $-211 | +5% $-107 | +10% $-4 |
| Rate | -1.0pp $-45 | -0.5pp $-127 | base $-211 | +0.5pp $-296 | +1.0pp $-383 |
UW: 25.0% down · 7.5% · 30yr · 1.5% tax · 5.0% vac · 8.0% maint · 8.0% mgmt
Financing live
Cash to close
- Down payment
- $82,398
- Closing costs
- $9,888
- Reserves months
- —
- Total cash needed
- —
Loan-product check · same deal, 3 products live
Conventional
25% down · 7.5% · 30yr
- Down + closing
- —
- Monthly P&I
- —
- Monthly cashflow
- —
- DSCR
- —
- Eligible?
- —
Personal DTI + credit; lowest rate.
DSCR
20% down · 8.5% · 30yr
- Down + closing
- —
- Monthly P&I
- —
- Monthly cashflow
- —
- DSCR
- —
- Eligible?
- —
No personal income docs; deal must DSCR.
Hard money
10% down · 12.0% · 12mo
- Down + closing
- —
- Monthly P&I
- —
- Monthly cashflow
- —
- DSCR
- —
- Eligible?
- —
Short-term bridge; refi at stabilization.
Rent comps 18 comps
| Address | Beds | Baths | Sqft | Rent | $/sqft | DOM | Units | Dist |
|---|---|---|---|---|---|---|---|---|
| 7566 Sea Oak Ct Palmetto, FL | 3.0 | 2.5 | 1807 | $2,700 | $1.49 | 23d | 1 | 0.17mi |
| 7562 Sea Oak Ct Palmetto, FL | 3.0 | 2.0 | 1433 | $2,400 | $1.67 | 23d | 1 | 0.17mi |
| 7122 87th Ln E Palmetto, FL | 4.0 | 2.0 | 1593 | $2,750 | $1.73 | 25d | 1 | 0.36mi |
| 9207 Bonita Mar Dr Parrish, FL | 3.0 | 2.5 | 1666 | $2,275 | $1.37 | 25d | 1 | 0.39mi |
| 9224 Bonita Mar Dr Parrish, FL | 3.0 | 2.5 | 1799 | $2,290 | $1.27 | 25d | 1 | 0.41mi |
| 8505 Bella Mar Trl Parrish, FL | 4.0 | 2.5 | 1870 | $2,750 | $1.47 | 18d | 1 | 0.57mi |
| 8132 Tea Olive Ter Palmetto, FL | 4.0 | 3.0 | 1698 | $2,500 | $1.47 | 25d | 1 | 0.85mi |
| 10120 Abrazo DR Palmetto, FL | 1.0–3.0 | 1.0–2.5 | 1122 | $2,675 | $2.38 | 3d | 24 | 0.87mi |
| 9009 Moccasin Wallow Rd Parrish, FL | 3.0–4.0 | 2.5 | 1581 | $2,056 | $1.30 | 3d | 32 | 0.88mi |
| 10504 Spring Tide Way Palmetto, FL | 2.0 | 2.0 | 1533 | $2,500 | $1.63 | 5d | 1 | 1.06mi |
| 6210 Terra Lago Cir Palmetto, FL | 1.0–3.0 | 1.0–2.0 | 1015 | $2,405 | $2.37 | 5d | 50 | 1.11mi |
| 6354 Fairmont Ln Palmetto, FL | 2.0 | 2.5 | 1123 | $2,000 | $1.78 | 25d | 1 | 1.27mi |
| 6345 Willowside St Palmetto, FL | 3.0 | 2.5 | 1407 | $2,200 | $1.56 | 25d | 1 | 1.27mi |
| 6334 Fairmont Ln Palmetto, FL | 2.0 | 2.5 | 1235 | $1,795 | $1.45 | 5d | 1 | 1.28mi |
| 6249 Fairmont Ln Palmetto, FL | 2.0 | 2.5 | 1200 | $1,890 | $1.57 | 16d | 1 | 1.28mi |
| 6256 Fairmont Ln Palmetto, FL | 2.0 | 2.5 | 1216 | $1,845 | $1.52 | 16d | 1 | 1.30mi |
| 5871 Bungalow Grove Ct Palmetto, FL | 3.0 | 2.0 | 1492 | $2,185 | $1.46 | 23d | 1 | 1.31mi |
| 9962 Last Light Gln Parrish, FL | 4.0 | 2.0 | 1740 | $2,495 | $1.43 | 5d | 1 | 1.45mi |
Listing history 15 events
-
2026-06-22days on market $289,990 Active 137 DOM
-
2026-06-18days on market $289,990 Active 134 DOM
-
2026-06-17days on market $289,990 Active 133 DOM
-
2026-06-16days on market $289,990 Active 132 DOM
-
2026-06-15days on market $289,990 Active 131 DOM
-
2026-06-13days on market $289,990 Active 129 DOM
-
2026-06-13days on market $289,990 Active 128 DOM
-
2026-06-10days on market $289,990 Active 126 DOM
-
2026-06-09days on market $289,990 Active 125 DOM
-
2026-06-08days on market $289,990 Active 124 DOM
-
2026-06-08days on market $289,990 Active 123 DOM
-
2026-06-03days on market $289,990 Active 119 DOM
-
2026-06-02days on market $289,990 Active 118 DOM
-
2026-06-01days on market $289,990 Active 117 DOM
-
2026-05-31days on market $289,990 Active 116 DOM
ⓘ Source: listings_history table (triggers on properties + properties_extension) + one-shot
backfill from property_details.listing_events for pre-trigger history.
Nearby sold comps map
Loading sold comps map…
Walkable amenities ~0.75 mi
Loading nearby amenities…
Taxation est. · year 1
- Rental income
- $31,401
- − Mortgage interest
- −$18,462
- − Property taxes
- −$4,944
- − Insurance
- −$1,648
- − Repairs & maintenance
- −$2,512
- − Management
- −$2,512
- − Depreciation
- −$9,588
- Taxable loss
- −$8,265
- Est. tax savings @ 24.0%
- +$1,984
- After-tax cash flow
- $-542/yr
For passive investors: Depreciation is non-cash, so a rental often shows a tax loss while cash-flowing — sheltering income. Rental losses are passive: they offset passive income freely, and up to $25,000/yr can offset ordinary (W-2) income if you actively participate and your MAGI is under $100k (phasing out to $0 by $150k); unused losses carry forward. On sale, claimed depreciation is recaptured at up to 25%, and gains may owe capital-gains tax (a 1031 exchange can defer both). Figures are a year-1 estimate at your 24.0% rate — not tax advice; consult a CPA.
Condition & rehab AI · 7 photos
This well-maintained and updated townhouse is move-in ready with a good condition score and potential for further value enhancement through minor updates.
Value-add opportunities
- Both Painting the exterior — Fresh paint can enhance curb appeal and property value.
- Both Landscaping improvements — Enhanced landscaping can attract more buyers and renters.
- Resale Upgrading the kitchen appliances — Modern appliances can increase the home's appeal to potential buyers.
- Both Adding smart home features — Smart home features can increase the home's value and attract tech-savvy buyers and renters.
- Both Upgrading the HVAC system — A more efficient HVAC system can improve comfort and reduce energy costs, attracting more buyers and renters.
Renovation cost estimate screening
Value-add ROI direction
- Both Painting the exterior — Fresh paint can enhance curb appeal and property value. ↑
- Both Landscaping improvements — Enhanced landscaping can attract more buyers and renters. ↑
- Resale Upgrading the kitchen appliances — Modern appliances can increase the home's appeal to potential buyers. ↑
- Both Adding smart home features — Smart home features can increase the home's value and attract tech-savvy buyers and renters. ↑
- Both Upgrading the HVAC system — A more efficient HVAC system can improve comfort and reduce energy costs, attracting more buyers and renters. ↑
ⓘ Cost ranges are severity-bucket heuristics (US national rule-of-thumb). Get contractor quotes + a written scope before underwriting a rehab budget.
Schools (NCES district)
- District
- Manatee
- NCES district ID
- 1201230
- Math proficiency
- 54% ▼ -6.00%
- Reading proficiency
- 50% ▼ -2.00%
- Median HH income
- $49,607
- Composite
- 44.43/100
- National rank
- #2806
- State rank
- #26 of 73 in FL
Livability — Ellenton
- Score
- 76/100
- State rank
- #232
- US rank
- #3666
Category grades
Schools grade is shown separately in the Schools card above.
Census & demographics
- County
- Manatee County · 416,364 people
- City population
- 52,177
- Metro
- North Port-Sarasota-Bradenton, FL
- Population (ZIP)
- 33,296
- Household income
- $113,773
- Rent vs Own
- Severe rent burden
- 219.0
Population outlook (Manatee County) Hauer SSP2
- Today (2025)
- 447,342 people
- By 2030
- 488,911 · +9.3%
- By 2040
- 567,934 · +27.0%
- By 2050
- 637,995 · +42.6%
- By 2075
- 781,970 · +74.8%
- By 2100
- 848,272 · +89.6%
Race, ethnicity, and origin ACS 2023
- Neighborhood character
- Predominantly White (75%)
- Race & ethnicity
- White 75% Hispanic / Latino 11% Two or more races 8% Black 8% Asian 2%
- Hispanic origin (detail)
- Mexican 2% Puerto Rican 3%
- Common ancestry
- Romanian 4% Hispanic 2% Russian 2%
- Foreign-born
- 10% · Canada, Dominican Republic, Jamaica
- Languages at home
- 88% English-only · Spanish 7% French/Haitian/Cajun 2% Other Asian/Pacific 1%
Political lean MEDSL · Manatee
- 2024 margin
- Strong R (+23.5) · D 37.9% · R 61.4%
- 2008→2024 swing
- -16.5pp toward R · 2008: -7.0pp · 2024: -23.5pp
- All cycles
- 2024: R+23.5 2020: R+16.1 2016: R+17.1 2012: R+12.5 2008: R+7.0
Not yet ingested
- Civics
- —
Market trends
- HPI YoY
- ▼ -84.45%
- Current HPI
- 271.7131
- Rent YoY
- ▼ -0.95%
- Metro
- North Port-Sarasota-Bradenton, FL
- State GDP YoY
- ▲ 3.28%
- F500 in state
- 36
Industry mix (Fortune 500 HQ in FL)
| Industry | F500 HQs | Revenue |
|---|---|---|
| Industrial Technology | 2 | $29B |
|
||
| Insurance | 2 | $17B |
|
||
| Retail | 1 | $60B |
|
||
| Technology Distribution | 1 | $58B |
|
||
| Homebuilding | 1 | $35B |
|
||
| Technology Manufacturing | 1 | $35B |
|
||
Cash-flow waterfall
monthlySold comps — $/sqft
last 12 mo · ≤1 miLoading sold comps…