 🏷️ Likely Rental
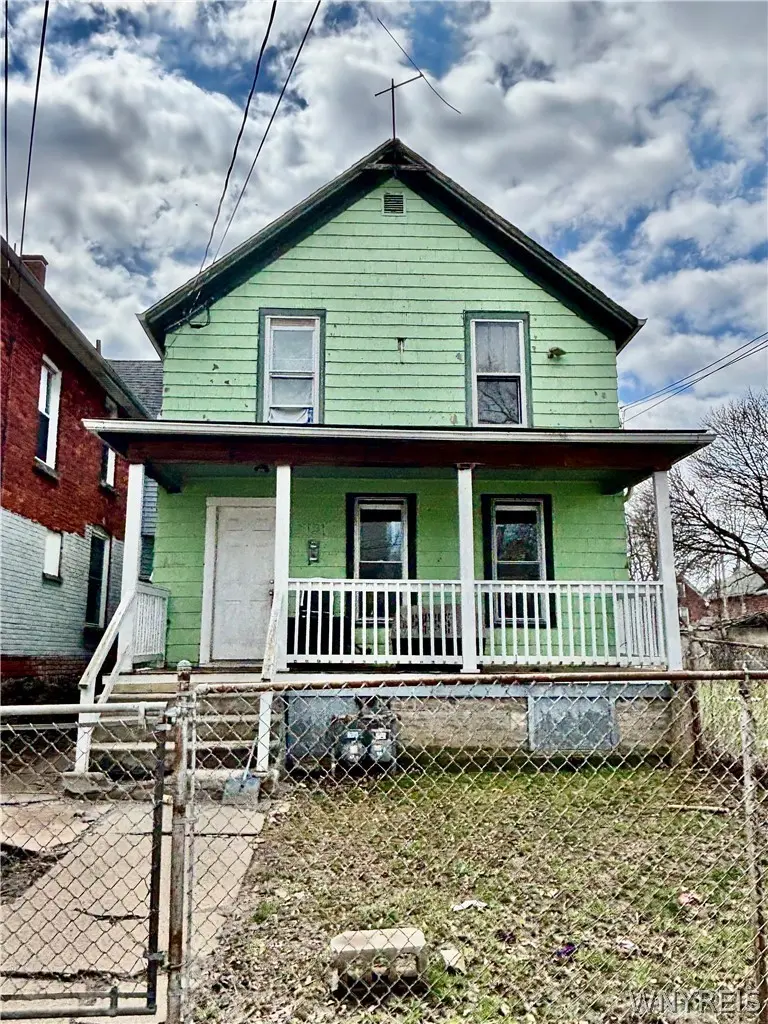
1121 Linwood Ave · Niagara Falls, NY
Flood risk 1/10 · Minimal
- FEMA flood zone
- X (unshaded)
- Chance of flooding over 30 yrs
- 0.0%
- Est. flood insurance / yr
- $473 – $860
Fire risk 2/10 · Minimal
- Est. fire insurance / yr
- $691 – $1,283
Heat risk 2/10 · Minimal
- Hot days now (above 94°F)
- 7 days/yr
- Hot days in 30 yrs
- 15 days/yr
Wind risk 1/10 · Minimal
- Chance of severe wind over 30 yrs
- —
Air-quality risk 3/10 · Minor
- Unhealthy air days now
- 2 days/yr
- Unhealthy air days in 30 yrs
- 3 days/yr
Risk factors via First Street. Map © Google.
Why this score? — see what drove the B+ grade
The composite is a weighted blend of 9 inputs, each scored 0–100. Each bar is that input's sub-score; the figure is the points it added to the 100-point composite (weight × sub-score).
- Cash flow +30.0/30.0
- ARV discount +15.0/15.0
- 1% rule +10.0/10.0
- DSCR +10.0/10.0
- Livability +3.0/5.0
- Rent growth +2.5/5.0
- Schools +2.5/10.0
- Condition / age +2.5/5.0
- Appreciation +0.0/10.0
$99,900
🖨 Deal sheet (PDF) 📄 Offer letter ✓ Due diligence
Multi-family units
County records classify this as Multi-Family (2-4 Unit). Listing-text estimate: 1 unit. estimate disagrees with records
Listing remarks
This side-by-side two-unit property offers strong potential for investors and owner-occupants alike. Each unit features both upper and lower living spaces, along with separate basements, providing flexible layouts and added storage. Ideal for a fix-and-flip project, income-producing rental, or live-in investment opportunity. Utilities are separately metered for gas and electricity, enhancing efficiency and tenant convenience. Recent updates include refreshed flooring and modern fixtures, and vinyl windows. The property also features a fully fenced yard, along with inviting front and rear porches that add character and outdoor living space. A detached garage, accessible via the rear alley, p
Key facts
- Vinyl windows
- Separate basements
- Refreshed flooring
Tags
Property features AI
Finance
- Financial info: Property contains 2 total units with separate gas and electric meters for each unit; Owner pays trash collection and water; Operating expenses may include professional management, trash and water/sewer (per seller information)
Exterior
- Parking: One-car garage plus on-street parking
- Utilities: Public water connected; Sewer connected; Electric with circuit breakers
- Home design: Two-story multi-family property; Resale condition; Shingle roof; Wood siding
- Construction: Built (existing); Block foundation
- Exterior features: Fully fenced yard; Rectangular residential lot on a city street
Interior
- Kitchen: Eat-in kitchen in each unit
- Bedrooms: Two 2-bedroom units (each unit has 2 bedrooms)
- Flooring: Carpet; Laminate; Vinyl; Varies
- Bathrooms: Two full bathrooms total (one full bathroom in each unit)
- Heating & cooling: Gas forced-air heating
- Interior features: Carpet, laminate, vinyl and varied flooring throughout; Full basement
- Laundry & utility: Washer hookup; Gas water heater
Neighborhood map
What this means for you Summary
Snapshot
- This is a 6-bed/2.0-bath multifamily listed at $100k.
Deal economics
- At list price, monthly cash flow is $1k ($15k/yr) — positive.
- The deal already cash-flows at list — no discount required.
- Meets the 1% rule at list price ($2k rent vs $100k).
- Recommended offer: $97k (3.0% below list) — sets the bar for market timing.
- Cap rate 21.6% vs local median 7.5% in Niagara Falls — top-decile yield for the area; either an underpriced asset or a hidden risk that comps aren't pricing in. Stress-test before assuming the spread holds.
Location & tenants
- Location reads 60/100 on livability (#956 in NY) — a middle-class / working-renter tenant base. Strengths: cost of living A+, housing A+; Watch: crime F, amenities F, commute F.
- Niagara Falls City School District (urban): math 26% / reading 34% proficiency, ranked #578 of 590 in NY (top 98%) — families likely to look elsewhere, expect single-tenant / working-renter base with shorter leases; 66% free/reduced lunch — lower-income household profile, screen leases tightly.
- Zoned schools: Harry F Abate Elementary School (math 16% / reading 32%, grade F, #1,909 of 2,108 statewide, top 91%, 695 students, 82% FRL); Gaskill Preparatory School (math 10% / reading 22%, grade F, #702 of 729 statewide, top 96%, 500 students, 78% FRL); Niagara Falls High School (math 75% / reading 92%, grade A, #409 of 1,100 statewide, top 39%, 2,139 students, 71% FRL).
- Market conditions: 142 active listings in the ZIP; 167 units permitted in Niagara County in 2024 (0 in 5+ unit buildings).
- At $2,463/mo this rent would consume 58% of the median local household income ($51k/yr) (locally 1095% of renters already pay >50% of income on rent) — very limited rent-growth headroom before tenants either downsize or default.
Forward outlook
- Local home prices are declining (-3.0%/yr); year-one equity from $691 of loan paydown is wiped out by about $3k of value loss. Plan a longer hold.
- Niagara County population projected at -19% by 2050 — secular population decline; favor cash flow + early exit over multi-decade hold.
- At projected returns (-3.0% appreciation + 3.0% rent growth), your $28k cash investment doubles in ~3 years — after that, you're playing with house money.
Negotiation context
- It's been on market 54 days — a 3% lower offer ($97k) is reasonable based on typical stale-listing flexibility.
- 12 sale attempts since 12y ago with the ask held roughly flat each time — persistent listings suggest the price (not the market) is what's stuck; bring a comps-based counter.
- Current owner paid $50k; list at $100k implies a 100% gain — meaningful room to come down on a strong offer.
Risks & watch-outs
- Watch-outs: built in 1902 — expect roof / HVAC / electrical / plumbing capex.
Questions for the listing agent
- It's been on market 54 days. Have you received any prior offers? Is the seller open to a 3% concession, seller financing, or rate buy-down credit?
- Built in 1902 — when were the roof, HVAC, electrical panel, plumbing, and water heater last replaced?
- Is there a deadline driving the sale (1031 exchange, divorce, estate, relocation)? That informs how much negotiation room exists.
- Schools are F-rated, which usually means shorter tenancies and higher turnover. Who's the typical renter profile here, and what's been the actual vacancy rate?
- Crime grade is F in this area — have there been break-ins, vandalism, or insurance claims at this property in the last 3 years? What carrier currently insures it and at what premium?
- What's the average days-on-market for RENTAL listings here right now (not sales)? A rising rental-DOM trend means longer vacancies and softer asking-rent achievability than the comps imply.
- What's the recent tenant-quality profile in this submarket — average credit score on applications, eviction rate, late-payment / NSF rate, and stable-employment percentage? A property-management company in the area should have these aggregated.
- How much new apartment / multifamily construction is in the pipeline within 1–3 miles? Heavy new supply (>2% of stock underway) typically softens rents 12–24 months out; light construction supports rent growth.
Investment metrics
- 1% rule
- 2.47% ✓
- Cap rate
- 21.64%
- Cash-on-cash
- 54.81%
- DSCR
- 3.44
- GRM
- 3.4
CMA / ARV
- ARV (median comp)
- $151,301
- List price
- $99,900
- Delta
- -33.97%
- Verdict
- UNDERPRICED
- Comps
- 20 within 1.0 mi
Show comp detail 9 sales within ~0.75 mi
| Address | Dist | Beds/Ba | Sqft | Sold | Price | $/sf | Match |
|---|---|---|---|---|---|---|---|
| 814 Willow Ave | 0.29mi | 5/2.0 (-1) | 2,072 (+7%) | 2mo | $140,000 | $68 | 68 |
| 1811 Weston Ave | 0.46mi | 5/3.0 (-1) | 1,998 (+3%) | 6mo | $140,000 | $70 | 59 |
| 1514 Whitney Ave | 0.28mi | 5/2.0 (-1) | 1,824 (-6%) | 19mo | $55,000 | $30 | 56 |
| 769 19th St | 0.65mi | 6/2.5 | 1,920 (-1%) | 16mo | $150,000 | $78 | 53 |
| 1335 Linwood Ave | 0.13mi | 5/2.0 (-1) | 2,212 (+14%) | 15mo | $90,000 | $41 | 52 |
| 1635 South Ave | 0.38mi | 5/2.0 (-1) | 2,208 (+14%) | 2mo | $85,000 | $38 | 52 |
| 2133 North Ave | 0.73mi | 6/2.0 | 2,048 (+6%) | 9mo | $170,000 | $83 | 48 |
| 2225 Whitney Ave | 0.68mi | 6/2.0 | 2,200 (+14%) | 3mo | $125,000 | $57 | 43 |
| 1402 Walnut Ave | 0.70mi | 6/2.0 | 2,033 (+5%) | 21mo | $135,000 | $66 | 42 |
Match score weights: distance 35% · size 25% · config 20% · recency 20%. Top-matched comps best support the ARV.
Projected returns pro-forma
-3.0% appreciation · 3.0% rent growth · sell at horizon
- IRR
- 53.0%
- Equity multiple
- 3.33×
- Total profit
- $65,213
- Equity at exit
- $14,895
- IRR
- 58.3%
- Equity multiple
- 6.78×
- Total profit
- $161,669
- Equity at exit
- $8,638
Cash invested: $27,972 (down + closing). Projections, not guarantees.
Landlord ↔ Tenant lean methodology
- Overall (STATE)
- 15 Strongly Tenant-Friendly
- State New York
- 15 Strongly Tenant-Friendly · D+10
- County
- — inherits STATE
- City
- — inherits STATE
ZIP-level market 14305
- Home prices YoY
- -10.9%
- Active inventory
- 142
- Price-to-rent
- 6.8×
Monthly cashflow live
- Estimated rent
- $2,463 high interval (Pro) →
- Mortgage (P&I)
- −$524
- Tax from tax record
- −$103 /mo · $1,231/yr
- Insurance
- −$42
- HOA
- −$0
- Vacancy / Maint / Mgmt
- −$517
- Net cashflow
- $1,278
Break-even live
Sensitivity live
| Price | -10% $1,334 | -5% $1,306 | +0% $1,278 | +5% $1,249 | +10% $1,221 |
|---|---|---|---|---|---|
| Rent | -10% $1,083 | -5% $1,180 | +0% $1,278 | +5% $1,375 | +10% $1,472 |
| Rate | -1.0pp $1,328 | -0.5pp $1,303 | base $1,278 | +0.5pp $1,252 | +1.0pp $1,225 |
2-unit breakdown (identical units grouped — click to expand)
| Units | Beds | Baths | Est. rent |
|---|---|---|---|
| 2× units | 2 | 1 | $2,464 |
| #1 | 2 | 1 | $1,232 |
| #2 | 2 | 1 | $1,232 |
| Total (2 units) | $2,463 | ||
UW: 25.0% down · 7.5% · 30yr · 1.5% tax · 5.0% vac · 8.0% maint · 8.0% mgmt
Financing live
Cash to close
- Down payment
- $24,975
- Closing costs
- $2,997
- Reserves months
- —
- Total cash needed
- —
Loan-product check · same deal, 3 products live
Conventional
25% down · 7.5% · 30yr
- Down + closing
- —
- Monthly P&I
- —
- Monthly cashflow
- —
- DSCR
- —
- Eligible?
- —
Personal DTI + credit; lowest rate.
DSCR
20% down · 8.5% · 30yr
- Down + closing
- —
- Monthly P&I
- —
- Monthly cashflow
- —
- DSCR
- —
- Eligible?
- —
No personal income docs; deal must DSCR.
Hard money
10% down · 12.0% · 12mo
- Down + closing
- —
- Monthly P&I
- —
- Monthly cashflow
- —
- DSCR
- —
- Eligible?
- —
Short-term bridge; refi at stabilization.
Listing history 50 events
-
2026-06-21days on market $99,900 Active 54 DOM
-
2026-06-18days on market $99,900 Active 51 DOM
-
2026-06-17days on market $99,900 Active 50 DOM
-
2026-06-16days on market $99,900 Active 49 DOM
-
2026-06-15days on market $99,900 Active 48 DOM
-
2026-06-13days on market $99,900 Active 46 DOM
-
2026-06-13days on market $99,900 Active 45 DOM
-
2026-06-10days on market $99,900 Active 43 DOM
-
2026-06-09days on market $99,900 Active 42 DOM
-
2026-06-08days on market $99,900 Active 41 DOM
-
2026-06-07days on market $99,900 Active 40 DOM
-
2026-06-03days on market $99,900 Active 36 DOM
-
2026-06-02days on market $99,900 Active 35 DOM
-
2026-06-01days on market $99,900 Active 34 DOM
-
2026-05-31days on market $99,900 Active 33 DOM
-
2026-04-28$99,900 Active 972-char remark
-
2023-10-13historical
-
2023-07-16$69,900 Active
-
2023-02-19historical
-
2023-01-06price $69,900
-
2022-11-19$74,900 Active
-
2022-11-17historical
-
2022-08-19$69,900 Active
-
2022-08-15historical
-
2022-06-06price $89,900
-
2022-05-17$99,900 Active
-
2021-09-24soldstatus $50,000 Closed Sale or Rented
-
2021-08-30status Under Contract- Do Not Show
-
2021-08-16price $55,000
-
2021-07-25price $60,000
-
2021-07-25$50,000 Active
-
2018-03-14soldstatus $31,000
-
2018-03-14soldstatus $38,500
-
2016-12-01soldstatus $12,500 Closed Sale or Rented
-
2016-11-17soldstatus $12,500
-
2016-10-17status Pending Sale
-
2016-10-12historical
-
2016-09-13$12,500 Active
-
2016-08-24historical
-
2016-08-02price $22,800
-
2016-07-05price $22,900
-
2016-06-28$24,700 Active
-
2016-06-03historical
-
2016-05-16price $24,700
-
2016-04-06price $24,800
-
2016-03-02$24,900 Active
-
2016-02-29historical
-
2016-02-06price $24,900
-
2016-01-12$34,900 Active
-
2014-12-11$30,000
ⓘ Source: listings_history table (triggers on properties + properties_extension) + one-shot
backfill from property_details.listing_events for pre-trigger history.
Tax reassessment forecast NY · Partial reset (capped growth)
- Current annual tax
- $1,231 · $103/mo
- Projected year-2 tax
- $1,459 · $122/mo
- Expected delta
- +$229/yr (+$19/mo · 18.6%)
ⓘ Screening estimate from a state-policy table — verify with the county assessor before closing.
Climate risk First Street
- Flood 1/10 Low FEMA zone X (unshaded) · 0% chance over 30 yrs
- Wildfire 2/10 Low
- Heat 2/10 Low 7 d/yr ≥94°F today · 15 d/yr by 30 yrs out
- Wind 1/10 Low
- Air quality 3/10 Moderate 2 unhealthy d/yr today · 3 by 30 yrs out
Nearby sold comps map
Loading sold comps map…
Walkable amenities ~0.75 mi
Loading nearby amenities…
Taxation est. · year 1
- Rental income
- $29,556
- − Mortgage interest
- −$5,596
- − Property taxes
- −$1,231
- − Insurance
- −$500
- − Repairs & maintenance
- −$2,364
- − Management
- −$2,364
- − Depreciation
- −$2,906
- Taxable income
- $14,595
- Est. tax owed @ 24.0%
- −$3,503
- After-tax cash flow
- $11,830/yr
For passive investors: Depreciation is non-cash, so a rental often shows a tax loss while cash-flowing — sheltering income. Rental losses are passive: they offset passive income freely, and up to $25,000/yr can offset ordinary (W-2) income if you actively participate and your MAGI is under $100k (phasing out to $0 by $150k); unused losses carry forward. On sale, claimed depreciation is recaptured at up to 25%, and gains may owe capital-gains tax (a 1031 exchange can defer both). Figures are a year-1 estimate at your 24.0% rate — not tax advice; consult a CPA.
Schools (NCES district)
- District
- Niagara Falls City School District
- NCES district ID
- 3620820
- Math proficiency
- 26% ▼ -10.00%
- Reading proficiency
- 34% ▲ 3.00%
- Median HH income
- $32,488
- Composite
- 24.5/100
- National rank
- #7655
- State rank
- #578 of 590 in NY
Livability — Niagara Falls
- Score
- 60/100
- State rank
- #956
- US rank
- #18749
Category grades
Schools grade is shown separately in the Schools card above.
Census & demographics
- Census place
- Niagara Falls, NY
- County
- Niagara County · 157,377 people
- City population
- 62,983
- Metro
- Buffalo-Cheektowaga, NY
- Population (ZIP)
- 16,696
- Household income
- $51,004
- Rent vs Own
- Severe rent burden
- 1095.0
Population outlook (Niagara County) Hauer SSP2
- Today (2025)
- 204,149 people
- By 2030
- 197,900 · -3.1%
- By 2040
- 182,239 · -10.7%
- By 2050
- 165,198 · -19.1%
- By 2075
- 129,416 · -36.6%
- By 2100
- 96,222 · -52.9%
Race, ethnicity, and origin ACS 2023
- Neighborhood character
- Diverse neighborhood (Simpson 0.63)
- Race & ethnicity
- White 55% Black 24% Two or more races 13% Hispanic / Latino 8% Asian 1% Native American 1%
- Hispanic origin (detail)
- Puerto Rican 4%
- Common ancestry
- Romanian 6% Slovak 2% Lithuanian 2%
- Foreign-born
- 6% · Canada, Jamaica
- Languages at home
- 93% English-only · Spanish 4% Other Indo-European 1%
Political lean MEDSL · Niagara
- 2024 margin
- R (+14.9) · D 42.5% · R 57.5%
- 2008→2024 swing
- -15.9pp toward R · 2008: 1.0pp · 2024: -14.9pp
- All cycles
- 2024: R+14.9 2020: R+9.7 2016: R+19.0 2012: D+0.6 2008: D+1.0
Not yet ingested
- Civics
- —
Market trends
- HPI YoY
- ▼ -43.08%
- Current HPI
- 350.8741
- Rent YoY
- —
- Metro
- Buffalo-Cheektowaga, NY
- State GDP YoY
- ▲ 2.60%
- F500 in state
- 92
Industry mix (Fortune 500 HQ in NY)
| Industry | F500 HQs | Revenue |
|---|---|---|
| Financial Services | 10 | $950B |
|
||
| Consumer Goods | 9 | $162B |
|
||
| Insurance | 4 | $225B |
|
||
| Telecommunications | 2 | $144B |
|
||
| Pharmaceuticals | 2 | $112B |
|
||
| Media / Entertainment | 2 | $69B |
|
||
Price history
+256.8% since first listed37 events — show timeline
- 2026-04-28 Listed $99,900 WNYREIS
- 2023-10-13 Listing Removed — WNYREIS
- 2023-07-16 Listed $69,900 WNYREIS
- 2023-02-19 Listing Removed — WNYREIS
- 2023-01-06 Price Changed $69,900 WNYREIS
- 2022-11-19 Listed $74,900 WNYREIS
- 2022-11-17 Listing Removed — WNYREIS
- 2022-08-19 Listed $69,900 WNYREIS
- 2022-08-15 Listing Removed — WNYREIS
- 2022-06-06 Price Changed $89,900 WNYREIS
- 2022-05-17 Listed $99,900 WNYREIS
- 2021-09-24 Sold (MLS) $50,000 WNYREIS
- 2021-08-30 Pending — WNYREIS
- 2021-08-16 Price Changed $55,000 WNYREIS
- 2021-07-25 Price Changed $60,000 WNYREIS
- 2021-07-25 Listed $50,000 WNYREIS
- 2018-03-14 Sold (Public Records) $38,500 Public Records
- 2018-03-14 Sold (Public Records) $31,000 Public Records
- 2016-12-01 Sold (MLS) $12,500 WNYREIS
- 2016-11-17 Sold (Public Records) $12,500 Public Records
- 2016-10-17 Pending — WNYREIS
- 2016-10-12 Listing Removed — WNYREIS
- 2016-09-13 Listed $12,500 WNYREIS
- 2016-08-24 Listing Removed — WNYREIS
- 2016-08-02 Price Changed $22,800 WNYREIS
- 2016-07-05 Price Changed $22,900 WNYREIS
- 2016-06-28 Listed $24,700 WNYREIS
- 2016-06-03 Listing Removed — WNYREIS
- 2016-05-16 Price Changed $24,700 WNYREIS
- 2016-04-06 Price Changed $24,800 WNYREIS
- 2016-03-02 Listed $24,900 WNYREIS
- 2016-02-29 Listing Removed — WNYREIS
- 2016-02-06 Price Changed $24,900 WNYREIS
- 2016-01-12 Listed $34,900 WNYREIS
- 2014-12-11 Listed $30,000 WNYREIS
- 2014-07-16 Listed $38,000 WNYREIS
- 2012-08-28 Sold (Public Records) $28,000 Public Records
Property tax history
+0.4%/yrLatest (2025): $1,231 · +40.9% YoY. Source: county tax records.
Cash-flow waterfall
monthlySold comps — $/sqft
last 12 mo · ≤1 miLoading sold comps…