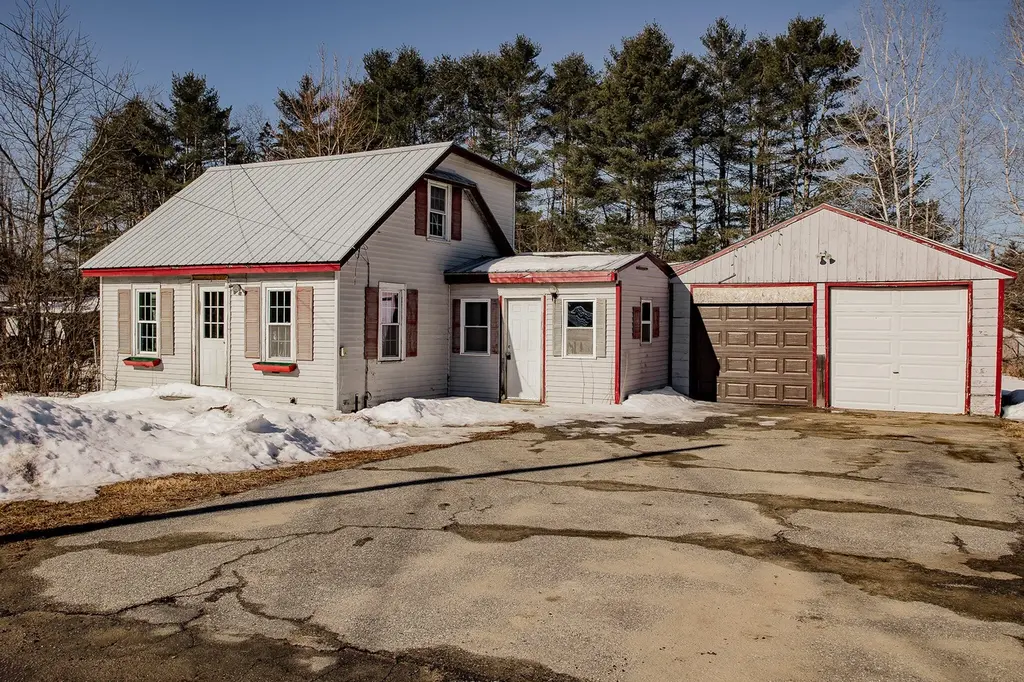
260 Weld St · Dixfield, ME
Flood risk No data
- FEMA flood zone
- —
- Chance of flooding over 30 yrs
- —
- Est. flood insurance / yr
- —
Fire risk No data
- Est. fire insurance / yr
- —
Heat risk No data
- Hot days now (above threshold)
- —
- Hot days in 30 yrs
- —
Wind risk No data
- Chance of severe wind over 30 yrs
- —
Air-quality risk No data
- Unhealthy air days now
- —
- Unhealthy air days in 30 yrs
- —
Risk factors via First Street. Map © Google.
Why this score? — see what drove the D+ grade
The composite is a weighted blend of 9 inputs, each scored 0–100. Each bar is that input's sub-score; the figure is the points it added to the 100-point composite (weight × sub-score).
- ARV discount +15.0/15.0
- Cash flow +8.6/30.0
- Appreciation +6.4/10.0
- Schools +6.4/10.0
- Livability +3.4/5.0
- 1% rule +2.7/10.0
- Rent growth +2.5/5.0
- Condition / age +2.5/5.0
- DSCR +2.4/10.0
$155,000
🖨 Deal sheet (PDF) 📄 Offer letter ✓ Due diligence
Listing remarks
Welcome to this 3 bedroom home in the heart of Dixfield offering comfort, convenience, and great value. Recent updates include fresh interior paint and new carpeting, giving this home a clean and inviting feel thought out. The main living space features a bright and sunny living room providing a place to relax and unwind, and a kitchen with a dining area to gather with family and friends, while the entry way offers a great place to store outside gear. Additional highlights include a 2 car attached garage for convenience and another attached space for more storage and entry to the back yard for gardening, play or relaxing. Located close to local shops, schools and town amenities, this would
Key facts
- Recent updates
- New carpeting
- Fresh interior paint
Tags
Property features AI
Finance
- Financial info: Annual tax amount listed (see listing for details)
Exterior
- Parking: Attached 2-car garage with direct entry to the living area; Paved parking with 5–10 spaces
- Utilities: Public water; Public sewer; Electric service with circuit breakers; Electric water heater
- Home design: Single family residence; Built in 1940
- Construction: Wood frame construction with aluminum siding; Metal roof; Full unfinished basement with interior entry
- Exterior features: Level, neighborhood lot; Paved road access
Interior
- Kitchen: Kitchen on the first floor
- Bedrooms: Primary bedroom on the first floor; Two additional bedrooms on the second floor
- Flooring: Carpet; Laminate; Vinyl
- Bathrooms: One full bathroom
- Heating & cooling: Forced air heating
- Interior features: Six total rooms; First-floor bedroom; Bathtub; Unfurnished
- Laundry & utility: Laundry located on the main level
Neighborhood map
What this means for you Summary
Snapshot
- This is a 3-bed/1.0-bath single-family listed at $155k.
Deal economics
- At list price, monthly cash flow is $-134 ($-2k/yr) — negative.
- To cash-flow at today's rent, offer at most $136k (12.5% below list).
- To meet the 1% rule (rent ≥ 1% of price), the offer needs to be $119k (23.5% below list).
- Recommended offer: $119k (23.5% below list) — sets the bar for 1% rule.
Location & tenants
- Location reads 67/100 on livability (#92 in ME) — a middle-class / working-renter tenant base. Strengths: crime A+, cost of living A+, health & safety A+; Watch: amenities F, commute F, employment F.
- RSU 56 (rural): math 74% / reading 81% proficiency, ranked #95 of 112 in ME (top 85%) — strong family-tenant draw, lease renewals of 3-5y typical.
- Zoned schools: Dirigo Elementary School (math 67% / reading 77%, grade A-, #253 of 294 statewide, top 90%, 359 students, 46% FRL); T W Kelly Dirigo Middle School (math 77% / reading 82%, grade A+, #63 of 85 statewide, top 77%, 171 students, 51% FRL); Dirigo High School (math 90% / reading 90%, grade A+, #44 of 108 statewide, top 44%, 234 students, 42% FRL) — zoned schools at 46% FRL track the district average.
- Market conditions: 28 active listings in the ZIP; 329 units permitted in Oxford County in 2024 (0 in 5+ unit buildings).
Forward outlook
- In year one you build about $6k of equity ($1k loan paydown + $4k appreciation (2.9% local appreciation)).
- Oxford County population projected at -21% by 2050 — secular population decline; favor cash flow + early exit over multi-decade hold.
- By year 7, paydown + projected appreciation supports a ~$35k cash-out refi (75% LTV) — recoverable capital for the next deal without selling this one.
Negotiation context
- It's been on market 96 days — a 9% lower offer ($141k) is reasonable based on typical stale-listing flexibility.
- 6 sale attempts since 17y ago with the ask held roughly flat each time — persistent listings suggest the price (not the market) is what's stuck; bring a comps-based counter.
Risks & watch-outs
- Watch-outs: built in 1940 — expect roof / HVAC / electrical / plumbing capex.
Questions for the listing agent
- What do current leases actually rent for vs. the listed asking? Can we see a recent rent roll and the last 12 months of T-12 income?
- It's been on market 96 days. Have you received any prior offers? Is the seller open to a 23% concession, seller financing, or rate buy-down credit?
- Built in 1940 — when were the roof, HVAC, electrical panel, plumbing, and water heater last replaced?
- Why hasn't it sold? Are there any deal-killer items the seller is aware of (foundation, flood, title, zoning, code violations)?
- Is there a deadline driving the sale (1031 exchange, divorce, estate, relocation)? That informs how much negotiation room exists.
- Schools are D-rated, which usually means shorter tenancies and higher turnover. Who's the typical renter profile here, and what's been the actual vacancy rate?
- The area grade is low — what's the realistic commute time and amenity access for the typical tenant pool here? Any planned neighborhood developments (good or bad) we should know about?
- What's the average days-on-market for RENTAL listings here right now (not sales)? A rising rental-DOM trend means longer vacancies and softer asking-rent achievability than the comps imply.
- What's the recent tenant-quality profile in this submarket — average credit score on applications, eviction rate, late-payment / NSF rate, and stable-employment percentage? A property-management company in the area should have these aggregated.
- How much new for-sale + rental construction is in the pipeline within 1–3 miles? Heavy new supply typically softens prices + rents 12–24 months out; constrained supply supports both.
Investment metrics
- 1% rule
- 0.77% ✗
- Cap rate
- 5.26%
- Cash-on-cash
- -3.70%
- DSCR
- 0.84
- GRM
- 10.9
CMA / ARV
- ARV (on-the-fly)
- $248,193
- Comps found
- 4
Show comp detail 4 sales within ~0.75 mi
| Address | Dist | Beds/Ba | Sqft | Sold | Price | $/sf | Match |
|---|---|---|---|---|---|---|---|
| 13 Dix Ave | 0.43mi | 3/1.0 | 1,099 (-8%) | 4mo | $70,000 | $64 | 63 |
| 27 Coburn Ave | 0.53mi | 3/1.5 | 1,248 (+4%) | 8mo | $243,000 | $195 | 60 |
| 65 Holt Hill Rd | 0.43mi | 3/2.0 | 1,278 (+7%) | 23mo | $265,000 | $207 | 46 |
| 12 Marble Ln | 0.58mi | 3/1.0 | 1,021 (-15%) | 12mo | $224,000 | $219 | 38 |
Match score weights: distance 35% · size 25% · config 20% · recency 20%. Top-matched comps best support the ARV.
Projected returns pro-forma
2.86% appreciation · 3.0% rent growth · sell at horizon
- IRR
- 3.6%
- Equity multiple
- 1.21×
- Total profit
- $8,996
- Equity at exit
- $68,452
- IRR
- 7.0%
- Equity multiple
- 2.05×
- Total profit
- $45,483
- Equity at exit
- $104,536
Cash invested: $43,400 (down + closing). Projections, not guarantees.
Landlord ↔ Tenant lean methodology
- Overall (STATE)
- 41 Moderately Tenant-Leaning
- State Maine
- 41 Moderately Tenant-Leaning · D+2
- County
- — inherits STATE
- City
- — inherits STATE
ZIP-level market 04224
- Home prices YoY
- 1.3%
- Active inventory
- 28
- Price-to-rent
- 10.9×
Monthly cashflow live
- Estimated rent
- $1,186 medium interval (Pro) →
- Mortgage (P&I)
- −$813
- Tax est. 1.5%
- −$194 /mo · $2,325/yr
- Insurance
- −$65
- HOA
- −$0
- Vacancy / Maint / Mgmt
- −$249
- Net cashflow
- $-134
Break-even live
Sensitivity live
| Price | -10% $-27 | -5% $-80 | +0% $-134 | +5% $-187 | +10% $-241 |
|---|---|---|---|---|---|
| Rent | -10% $-228 | -5% $-181 | +0% $-134 | +5% $-87 | +10% $-40 |
| Rate | -1.0pp $-56 | -0.5pp $-94 | base $-134 | +0.5pp $-174 | +1.0pp $-215 |
UW: 25.0% down · 7.5% · 30yr · 1.5% tax · 5.0% vac · 8.0% maint · 8.0% mgmt
Financing live
Cash to close
- Down payment
- $38,750
- Closing costs
- $4,650
- Reserves months
- —
- Total cash needed
- —
Loan-product check · same deal, 3 products live
Conventional
25% down · 7.5% · 30yr
- Down + closing
- —
- Monthly P&I
- —
- Monthly cashflow
- —
- DSCR
- —
- Eligible?
- —
Personal DTI + credit; lowest rate.
DSCR
20% down · 8.5% · 30yr
- Down + closing
- —
- Monthly P&I
- —
- Monthly cashflow
- —
- DSCR
- —
- Eligible?
- —
No personal income docs; deal must DSCR.
Hard money
10% down · 12.0% · 12mo
- Down + closing
- —
- Monthly P&I
- —
- Monthly cashflow
- —
- DSCR
- —
- Eligible?
- —
Short-term bridge; refi at stabilization.
Listing history 26 events
-
2026-06-21days on market $155,000 Active 96 DOM
-
2026-06-21days on market $155,000 Active 95 DOM
-
2026-06-18days on market $155,000 Active 93 DOM
-
2026-06-17days on market $155,000 Active 92 DOM
-
2026-06-16days on market $155,000 Active 91 DOM
-
2026-06-15days on market $155,000 Active 90 DOM
-
2026-06-13days on market $155,000 Active 88 DOM
-
2026-06-12days on market $155,000 Active 87 DOM
-
2026-06-09days on market $155,000 Active 84 DOM
-
2026-06-08days on market $155,000 Active 83 DOM
-
2026-06-07days on market $155,000 Active 82 DOM
-
2026-06-05days on market $155,000 Active 80 DOM
-
2026-06-04days on market $155,000 Active 78 DOM
-
2026-06-02days on market $155,000 Active 77 DOM
-
2026-06-01status $155,000 Active 76 DOM
-
2026-06-01days on market $155,000 Active Under Contract 76 DOM
-
2026-05-31days on market $155,000 Active Under Contract 75 DOM
-
2026-05-31days on market $155,000 Active Under Contract 74 DOM
-
2026-05-04historical Active Under Contract
-
2026-04-08status Active
-
2026-04-03status Pending
-
2026-03-12$155,000 Active
-
2014-08-21$48,900
-
2014-02-28$49,900
-
2013-07-06$49,900
-
2009-01-16$40,000
ⓘ Source: listings_history table (triggers on properties + properties_extension) + one-shot
backfill from property_details.listing_events for pre-trigger history.
Nearby sold comps map
Loading sold comps map…
Walkable amenities ~0.75 mi
Loading nearby amenities…
Taxation est. · year 1
- Rental income
- $14,238
- − Mortgage interest
- −$8,682
- − Property taxes
- −$2,325
- − Insurance
- −$775
- − Repairs & maintenance
- −$1,139
- − Management
- −$1,139
- − Depreciation
- −$4,509
- Taxable loss
- −$4,332
- Est. tax savings @ 24.0%
- +$1,040
- After-tax cash flow
- $-567/yr
For passive investors: Depreciation is non-cash, so a rental often shows a tax loss while cash-flowing — sheltering income. Rental losses are passive: they offset passive income freely, and up to $25,000/yr can offset ordinary (W-2) income if you actively participate and your MAGI is under $100k (phasing out to $0 by $150k); unused losses carry forward. On sale, claimed depreciation is recaptured at up to 25%, and gains may owe capital-gains tax (a 1031 exchange can defer both). Figures are a year-1 estimate at your 24.0% rate — not tax advice; consult a CPA.
Schools (NCES district)
- District
- RSU 56
- NCES district ID
- 2314833
- Math proficiency
- 74% ▲ 55.00%
- Reading proficiency
- 81% ▲ 37.00%
- Median HH income
- $38,091
- Composite
- 64.43/100
- National rank
- #544
- State rank
- #95 of 112 in ME
Livability — Dixfield
- Score
- 67/100
- State rank
- #92
- US rank
- #10320
Category grades
Schools grade is shown separately in the Schools card above.
Census & demographics
- Census place
- Dixfield, ME
- Population (ZIP)
- 3,077
Population outlook (Oxford County) Hauer SSP2
- Today (2025)
- 55,853 people
- By 2030
- 54,190 · -3.0%
- By 2040
- 49,484 · -11.4%
- By 2050
- 43,958 · -21.3%
- By 2075
- 32,308 · -42.2%
- By 2100
- 21,858 · -60.9%
Race, ethnicity, and origin ACS 2023
- Neighborhood character
- Predominantly White (94%)
- Race & ethnicity
- White 94% Hispanic / Latino 5% Two or more races 3%
- Common ancestry
- Lithuanian 11% Slovak 5% German 2%
- Foreign-born
- 1% · Canada
- Languages at home
- 99% English-only · French/Haitian/Cajun 1%
Political lean MEDSL · Oxford
- 2024 margin
- R (+12.9) · D 42.7% · R 55.6% · Other 1.7%
- 2008→2024 swing
- -28.9pp toward R · 2008: 16.0pp · 2024: -12.9pp
- All cycles
- 2024: R+12.9 2020: R+8.8 2016: R+13.0 2012: D+14.9 2008: D+16.0
Not yet ingested
- Civics
- —
Market trends
- HPI YoY
- ▲ 2.86%
- Current HPI
- 219.9452
- Rent YoY
- —
- Metro
- —
- State GDP YoY
- —
- F500 in state
- 0
Price history
+287.5% since first listed8 events — show timeline
- 2026-05-04 Contingent — MREIS
- 2026-04-08 Relisted — MREIS
- 2026-04-03 Pending — MREIS
- 2026-03-12 Listed $155,000 MREIS
- 2014-08-21 Listed $48,900 MREIS
- 2014-02-28 Listed $49,900 MREIS
- 2013-07-06 Listed $49,900 MREIS
- 2009-01-16 Listed $40,000 MREIS
Cash-flow waterfall
monthlySold comps — $/sqft
last 12 mo · ≤1 miLoading sold comps…