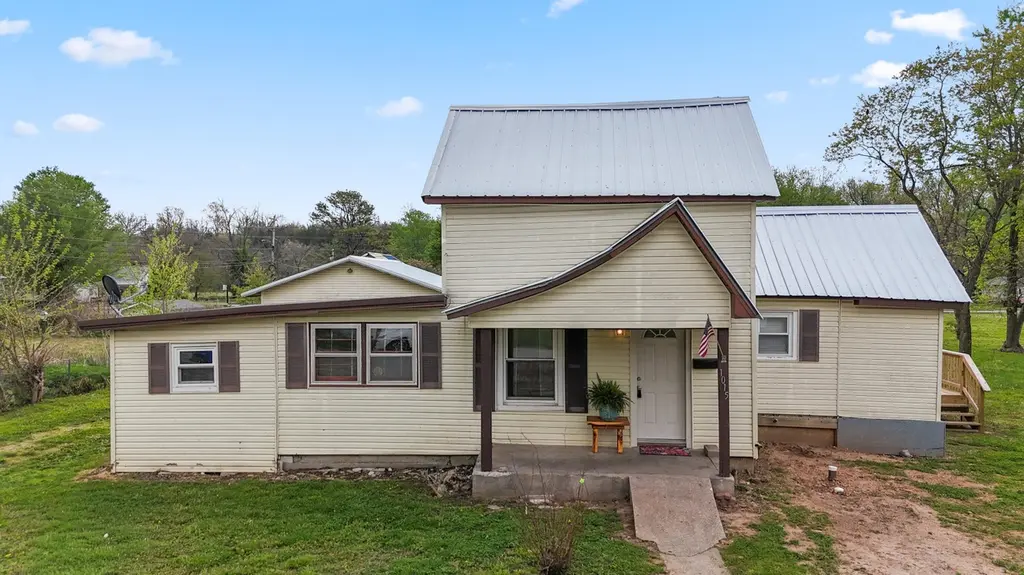
1015 Harold St · Cassville, MO
Flood risk 8/10 · Major
- FEMA flood zone
- AE
- Chance of flooding over 30 yrs
- 0.99%
- Est. flood insurance / yr
- $1,737 – $8,500
Fire risk 5/10 · Moderate
- Est. fire insurance / yr
- $1,054 – $1,958
Heat risk 5/10 · Moderate
- Hot days now (above 104°F)
- 7 days/yr
- Hot days in 30 yrs
- 21 days/yr
Wind risk 2/10 · Minimal
- Chance of severe wind over 30 yrs
- 1.0%
Air-quality risk 2/10 · Minimal
- Unhealthy air days now
- 1 days/yr
- Unhealthy air days in 30 yrs
- 1 days/yr
Risk factors via First Street. Map © Google.
Why this score? — see what drove the B- grade
The composite is a weighted blend of 9 inputs, each scored 0–100. Each bar is that input's sub-score; the figure is the points it added to the 100-point composite (weight × sub-score).
- Cash flow +26.3/30.0
- ARV discount +15.0/15.0
- DSCR +8.9/10.0
- 1% rule +5.9/10.0
- Schools +3.3/10.0
- Livability +3.3/5.0
- Rent growth +2.5/5.0
- Condition / age +2.5/5.0
- Appreciation +0.0/10.0
$119,000
🖨 Deal sheet 📄 Offer letter ✓ Due diligence
Listing remarks MLS
This freshly updated home has a lot to offer! The updates include: brand new metal roofs on both the house and the garage, new luxury vinyl waterproof floors, a new HVAC system with 95% efficiency, new doors, 100% new Pex plumbing and a nice new deck to entertain guests on. This home is on city utilities with natural gas and does have Gobec fiber internet already set up. This home also features a detached 24x24 garage with over 20 electrical plugs and its own dedicated meter loop. Possible Owner financing available.
Key facts
- New pex plumbing
- Metal roofs
- New deck
Tags
Neighborhood map
What this means for you Summary
Snapshot
- This is a 3-bed/1.0-bath single-family listed at $119k.
Deal economics
- At list price, monthly cash flow is $-119 ($-1k/yr) — negative.
- To cash-flow at today's rent, offer at most $98k (17.7% below list).
- Meets the 1% rule at list price ($1k rent vs $119k).
- Recommended offer: $98k (17.7% below list) — sets the bar for cash-flow.
- Cap rate 9.4% vs local median 2.6% in Cassville — top-decile yield for the area; either an underpriced asset or a hidden risk that comps aren't pricing in. Stress-test before assuming the spread holds.
Location & tenants
- Location reads 66/100 on livability (#243 in MO) — a middle-class / working-renter tenant base. Strengths: cost of living A+, housing A-, crime B; Watch: schools C-, health & safety C-, amenities F.
- Cassville R-IV (town): math 33% / reading 47% proficiency, ranked #157 of 324 in MO (top 48%) — families likely to look elsewhere, expect single-tenant / working-renter base with shorter leases.
- Market conditions: 90 active listings in the ZIP; 57 units permitted in Barry County in 2024 (0 in 5+ unit buildings).
Forward outlook
- Local home prices are declining (-3.0%/yr); year-one equity from $823 of loan paydown is wiped out by about $4k of value loss. Plan a longer hold.
- Barry County population projected at -13% by 2050 — secular population decline; favor cash flow + early exit over multi-decade hold.
Negotiation context
- It's been on market 125 days — a 12% lower offer ($105k) is reasonable based on typical stale-listing flexibility.
- 2 sale attempts since 2y ago; this cycle's ask has dropped $26k (18%) from the opening price — seller is motivated, your offer sets the floor, not the list.
Risks & watch-outs
- Watch-outs: flood insurance adds $427/mo; built in 1920 — expect roof / HVAC / electrical / plumbing capex.
- Climate carrying-cost: in FEMA flood zone AE (mandatory federal flood insurance); moderate wildfire risk; extreme-heat days projected 7→21/yr by 2055 (HVAC capex compounding) — expect insurance premiums to compound above CPI over the hold.
Questions for the listing agent
- What do current leases actually rent for vs. the listed asking? Can we see a recent rent roll and the last 12 months of T-12 income?
- It's been on market 125 days. Have you received any prior offers? Is the seller open to a 18% concession, seller financing, or rate buy-down credit?
- Built in 1920 — when were the roof, HVAC, electrical panel, plumbing, and water heater last replaced?
- What's the actual annual flood-insurance premium (NFIP or private), and is the property in a SFHA with mandatory coverage?
- Why hasn't it sold? Are there any deal-killer items the seller is aware of (foundation, flood, title, zoning, code violations)?
- Is there a deadline driving the sale (1031 exchange, divorce, estate, relocation)? That informs how much negotiation room exists.
- What's the average days-on-market for RENTAL listings here right now (not sales)? A rising rental-DOM trend means longer vacancies and softer asking-rent achievability than the comps imply.
- What's the recent tenant-quality profile in this submarket — average credit score on applications, eviction rate, late-payment / NSF rate, and stable-employment percentage? A property-management company in the area should have these aggregated.
- How much new for-sale + rental construction is in the pipeline within 1–3 miles? Heavy new supply typically softens prices + rents 12–24 months out; constrained supply supports both.
Investment metrics
- 1% rule
- 1.09% ✓
- Cap rate
- 9.39%
- Cash-on-cash
- 11.08%
- DSCR
- 1.49
- GRM
- 7.6
CMA / ARV
- ARV (median comp)
- $165,518
- List price
- $119,000
- Delta
- -28.10%
- Verdict
- UNDERPRICED
- Comps
- 20 within 1.0 mi
Show comp detail 6 sales within ~0.75 mi
| Address | Dist | Beds/Ba | Sqft | Sold | Price | $/sf | Match |
|---|---|---|---|---|---|---|---|
| 1205 Harold St | 0.15mi | 3/1.0 | 1,684 (+10%) | 10mo | $160,000 | $95 | 69 |
| 300 Crystal View Dr | 0.45mi | 3/2.0 | 1,446 (-6%) | 1mo | $149,500 | $103 | 65 |
| 902 Wildwood Dr | 0.56mi | 3/2.0 | 1,527 (-0%) | 9mo | $220,000 | $144 | 62 |
| 1101 Presley Dr | 0.43mi | 3/1.0 | 1,624 (+6%) | 10mo | $159,900 | $98 | 62 |
| 601 7th St | 0.41mi | 3/2.0 | 1,416 (-8%) | 17mo | $139,000 | $98 | 50 |
| 146 Sunset Hts | 0.62mi | 3/2.0 | 1,346 (-12%) | 15mo | $160,000 | $119 | 34 |
Match score weights: distance 35% · size 25% · config 20% · recency 20%. Top-matched comps best support the ARV.
Projected returns pro-forma
-3.0% appreciation · 3.0% rent growth · sell at horizon
- IRR
- -23.3%
- Equity multiple
- 0.20×
- Total profit
- $-26,640
- Equity at exit
- $17,743
- IRR
- -17.3%
- Equity multiple
- 0.04×
- Total profit
- $-32,063
- Equity at exit
- $10,289
Cash invested: $33,320 (down + closing). Projections, not guarantees.
Landlord ↔ Tenant lean methodology
- Overall (STATE)
- 81 Strongly Landlord-Friendly
- State Missouri
- 81 Strongly Landlord-Friendly · R+10
- County
- — inherits STATE
- City
- — inherits STATE
ZIP-level market 65625
- Home prices YoY
- -6.8%
- Active inventory
- 90
- Price-to-rent
- 7.6×
Monthly cashflow live
- Estimated rent
- $1,302 medium interval (Pro) →
- Mortgage (P&I)
- −$624
- Tax from tax record
- −$47 /mo · $564/yr
- Insurance
- −$50
- Flood insurance flood zone
- −$427 /mo · $5,118/yr
- HOA
- −$0
- Vacancy / Maint / Mgmt
- −$273
- Net cashflow
- $-119
Break-even live
UW: 25.0% down · 7.5% · 30yr · 1.5% tax · 5.0% vac · 8.0% maint · 8.0% mgmt
Financing live
Cash to close
- Down payment
- $29,750
- Closing costs
- $3,570
- Reserves months
- —
- Total cash needed
- —
Loan-product check · same deal, 3 products live
Conventional
25% down · 7.5% · 30yr
- Down + closing
- —
- Monthly P&I
- —
- Monthly cashflow
- —
- DSCR
- —
- Eligible?
- —
Personal DTI + credit; lowest rate.
DSCR
20% down · 8.5% · 30yr
- Down + closing
- —
- Monthly P&I
- —
- Monthly cashflow
- —
- DSCR
- —
- Eligible?
- —
No personal income docs; deal must DSCR.
Hard money
10% down · 12.0% · 12mo
- Down + closing
- —
- Monthly P&I
- —
- Monthly cashflow
- —
- DSCR
- —
- Eligible?
- —
Short-term bridge; refi at stabilization.
Listing history 23 events
-
2026-06-18status $119,000 Pending 125 DOM
-
2026-06-18days on market $119,000 Active 125 DOM
-
2026-06-17days on market $119,000 Active 124 DOM
-
2026-06-16days on market $119,000 Active 123 DOM
-
2026-06-15days on market $119,000 Active 122 DOM
-
2026-06-13days on market $119,000 Active 120 DOM
-
2026-06-12days on market $119,000 Active 119 DOM
-
2026-06-09days on market $119,000 Active 116 DOM
-
2026-06-08days on market $119,000 Active 115 DOM
-
2026-06-07days on market $119,000 Active 114 DOM
-
2026-06-07days on market $119,000 Active 113 DOM
-
2026-06-04days on market $119,000 Active 110 DOM
-
2026-06-02days on market $119,000 Active 109 DOM
-
2026-06-01days on market $119,000 Active 108 DOM
-
2026-05-31days on market $119,000 Active 107 DOM
-
2026-04-30price $119,000 524-char remark
Show marketing remark (524 chars)
This freshly updated home has a lot to offer! The updates include: brand new metal roofs on both the house and the garage, new luxury vinyl waterproof floors, a new HVAC system with 95% efficiency, new doors, 100% new Pex plumbing and a nice new deck to entertain guests on. This home is on city utilities with natural gas and does have Gobec fiber internet already set up. This home also features a detached 24x24 garage with over 20 electrical plugs and its own dedicated meter loop. Possible Owner financing available.
-
2026-04-13price $139,900 524-char remark
Show marketing remark (524 chars)
This freshly updated home has a lot to offer! The updates include: brand new metal roofs on both the house and the garage, new luxury vinyl waterproof floors, a new HVAC system with 95% efficiency, new doors, 100% new Pex plumbing and a nice new deck to entertain guests on. This home is on city utilities with natural gas and does have Gobec fiber internet already set up. This home also features a detached 24x24 garage with over 20 electrical plugs and its own dedicated meter loop. Possible Owner financing available.
-
2026-02-13$144,900 Active 524-char remark
Show marketing remark (524 chars)
This freshly updated home has a lot to offer! The updates include: brand new metal roofs on both the house and the garage, new luxury vinyl waterproof floors, a new HVAC system with 95% efficiency, new doors, 100% new Pex plumbing and a nice new deck to entertain guests on. This home is on city utilities with natural gas and does have Gobec fiber internet already set up. This home also features a detached 24x24 garage with over 20 electrical plugs and its own dedicated meter loop. Possible Owner financing available.
-
2024-04-11soldstatus Closed 231-char remark
Show marketing remark (231 chars)
Are you looking for a fixer upper or investment property? This one is for you! Tons of opportunity to make this a great rental or your next home! 4 bed, 1 bath with almost 1800 sq ft! Calling all investors! Come check this one out!
-
2024-04-11soldstatus
Show marketing remark (231 chars)
Are you looking for a fixer upper or investment property? This one is for you! Tons of opportunity to make this a great rental or your next home! 4 bed, 1 bath with almost 1800 sq ft! Calling all investors! Come check this one out!
-
2024-03-29status Pending 231-char remark
Show marketing remark (231 chars)
Are you looking for a fixer upper or investment property? This one is for you! Tons of opportunity to make this a great rental or your next home! 4 bed, 1 bath with almost 1800 sq ft! Calling all investors! Come check this one out!
-
2024-03-28$45,900 Active 231-char remark
Show marketing remark (231 chars)
Are you looking for a fixer upper or investment property? This one is for you! Tons of opportunity to make this a great rental or your next home! 4 bed, 1 bath with almost 1800 sq ft! Calling all investors! Come check this one out!
-
2021-02-16soldstatus
ⓘ Source: listings_history table (triggers on properties + properties_extension) + one-shot
backfill from property_details.listing_events for pre-trigger history.
Tax reassessment forecast MO · Resets to sale price
- Current annual tax
- $564 · $47/mo
- Projected year-2 tax
- $1,154 · $96/mo
- Expected delta
- +$590/yr (+$49/mo · 104.7%)
ⓘ Screening estimate from a state-policy table — verify with the county assessor before closing.
Climate risk First Street
- Flood 8/10 Severe FEMA zone AE · 99% chance over 30 yrs
- Wildfire 5/10 Major
- Heat 5/10 Major 7 d/yr ≥104°F today · 21 d/yr by 30 yrs out
- Wind 2/10 Low 100% chance of damaging wind over 30 yrs
- Air quality 2/10 Low 1 unhealthy d/yr today · 1 by 30 yrs out
Nearby sold comps map
Loading sold comps map…
Walkable amenities ~0.75 mi
Loading nearby amenities…
Taxation est. · year 1
- Rental income
- $15,618
- − Mortgage interest
- −$6,666
- − Property taxes
- −$564
- − Insurance
- −$5,714
- − Repairs & maintenance
- −$1,249
- − Management
- −$1,249
- − Depreciation
- −$3,462
- Taxable loss
- −$3,286
- Est. tax savings @ 24.0%
- +$789
- After-tax cash flow
- $-639/yr
For passive investors: Depreciation is non-cash, so a rental often shows a tax loss while cash-flowing — sheltering income. Rental losses are passive: they offset passive income freely, and up to $25,000/yr can offset ordinary (W-2) income if you actively participate and your MAGI is under $100k (phasing out to $0 by $150k); unused losses carry forward. On sale, claimed depreciation is recaptured at up to 25%, and gains may owe capital-gains tax (a 1031 exchange can defer both). Figures are a year-1 estimate at your 24.0% rate — not tax advice; consult a CPA.
Schools (NCES district)
- District
- Cassville R-IV
- NCES district ID
- 2908170
- Math proficiency
- 33% ▬ 0.00%
- Reading proficiency
- 47% ▲ 1.00%
- Median HH income
- $38,738
- Composite
- 33.36/100
- National rank
- #5484
- State rank
- #157 of 324 in MO
Livability — Cassville
- Score
- 66/100
- State rank
- #243
- US rank
- #11916
Category grades
Schools grade is shown separately in the Schools card above.
Census & demographics
- Census place
- Cassville, MO
- Population (ZIP)
- 7,186
Population outlook (Barry County) Hauer SSP2
- Today (2025)
- 35,207 people
- By 2030
- 34,460 · -2.1%
- By 2040
- 32,643 · -7.3%
- By 2050
- 30,688 · -12.8%
- By 2075
- 26,898 · -23.6%
- By 2100
- 22,000 · -37.5%
Race, ethnicity, and origin ACS 2023
- Neighborhood character
- Predominantly White (90%)
- Race & ethnicity
- White 90% Hispanic / Latino 5% Two or more races 4%
- Common ancestry
- Italian 6% Lithuanian 3% Slovak 2%
- Foreign-born
- 2% · Canada, Philippines
- Languages at home
- 96% English-only · Spanish 3% German/W. Germanic 1%
Political lean MEDSL · Barry
- 2024 margin
- Solid R (+63.5) · D 17.8% · R 81.3%
- 2008→2024 swing
- -28.5pp toward R · 2008: -35.0pp · 2024: -63.5pp
- All cycles
- 2024: R+63.5 2020: R+60.8 2016: R+59.7 2012: R+44.7 2008: R+35.0
Not yet ingested
- Civics
- —
Market trends
- HPI YoY
- ▼ -16.59%
- Current HPI
- 225.8478
- Rent YoY
- —
- Metro
- —
- State GDP YoY
- ▲ 1.84%
- F500 in state
- 20
Industry mix (Fortune 500 HQ in MO)
| Industry | F500 HQs | Revenue |
|---|---|---|
| Healthcare | 1 | $163B |
|
||
| Insurance | 1 | $21B |
|
||
| Industrial Technology | 1 | $17B |
|
||
| Retail | 1 | $16B |
|
||
| Industrial Distribution | 1 | $10B |
|
||
| Utilities | 1 | $9B |
|
||
Price history
+159.3% since first listed8 events — show timeline
- 2026-04-30 Price Changed $119,000 SOMO
- 2026-04-13 Price Changed $139,900 SOMO
- 2026-02-13 Listed $144,900 SOMO
- 2024-04-11 Sold (Public Records) — Public Records
- 2024-04-11 Sold (MLS) — SOMO
- 2024-03-29 Pending — SOMO
- 2024-03-28 Listed $45,900 SOMO
- 2021-02-16 Sold (Public Records) — Public Records
Property tax history
+2.4%/yrLatest (2025): $564 · +8.6% YoY. Source: county tax records.
Cash-flow waterfall
monthlySold comps — $/sqft
last 12 mo · ≤1 miLoading sold comps…