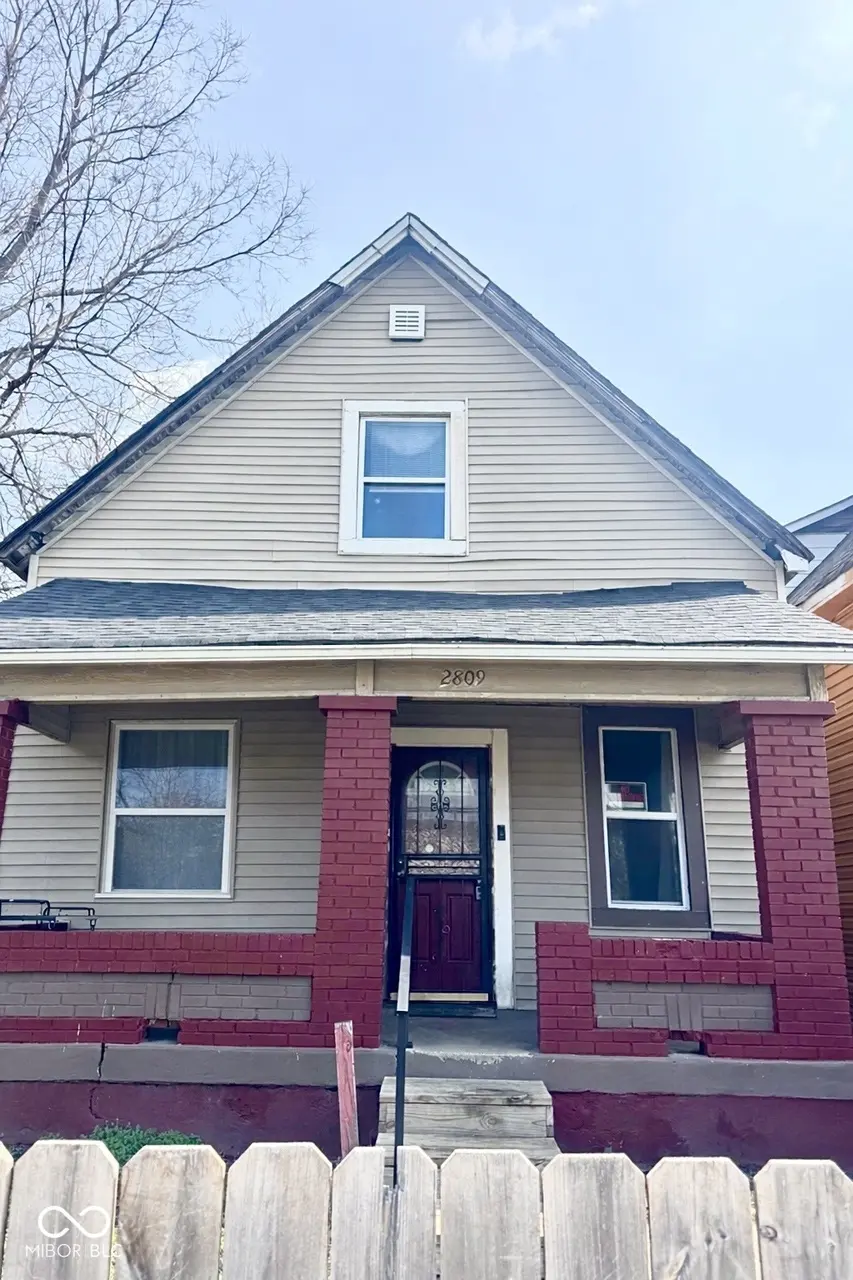
2809 Shriver Ave · Indianapolis city (balance), IN
Flood risk 6/10 · Moderate
- FEMA flood zone
- X (unshaded)
- Chance of flooding over 30 yrs
- 0.75%
- Est. flood insurance / yr
- $473 – $860
Fire risk 1/10 · Minimal
- Est. fire insurance / yr
- $717 – $1,331
Heat risk 4/10 · Minor
- Hot days now (above 101°F)
- 7 days/yr
- Hot days in 30 yrs
- 19 days/yr
Wind risk 2/10 · Minimal
- Chance of severe wind over 30 yrs
- 0.0%
Air-quality risk 4/10 · Minor
- Unhealthy air days now
- 5 days/yr
- Unhealthy air days in 30 yrs
- 7 days/yr
Risk factors via First Street. Map © Google.
Why this score? — see what drove the B- grade
The composite is a weighted blend of 9 inputs, each scored 0–100. Each bar is that input's sub-score; the figure is the points it added to the 100-point composite (weight × sub-score).
- Cash flow +30.0/30.0
- 1% rule +10.0/10.0
- DSCR +10.0/10.0
- ARV discount +7.5/15.0
- Rent growth +4.1/5.0
- Livability +2.5/5.0
- Condition / age +2.5/5.0
- Schools +1.4/10.0
- Appreciation +0.0/10.0
$70,000
🖨 Deal sheet 📄 Offer letter ✓ Due diligence
Listing remarks MLS
A rare opportunity in a prime location with exceptional potential and long-term value. Ideally situated just minutes from the Children's Museum, local universities, and downtown Indianapolis, this home offers both convenience and strong market positioning. This 2-bedroom home includes a versatile upper level, ideal for a potential third bedroom or an additional living area. Surrounded by comparable properties supporting continued growth and strong resale value, this home is well-positioned for those seeking to personalize a residence, build equity, or explore rental or resale potential. A unique blend of location, flexibility, and opportunity, ready for its next chapter. Schedule your showing today and begin your next chapter here!
Key facts
- 3,398 sq ft lot
- Built 1925
- Listed 59 days
Neighborhood map
What this means for you Summary
Snapshot
- This is a 2-bed/1.5-bath single-family listed at $70k.
Deal economics
- At list price, monthly cash flow is $646 ($8k/yr) — positive.
- The deal already cash-flows at list — no discount required.
- Meets the 1% rule at list price ($1k rent vs $70k).
- Recommended offer: $68k (3.0% below list) — sets the bar for market timing.
- Cap rate 17.4% vs local median 4.4% in Indianapolis city (balance) — top-decile yield for the area; either an underpriced asset or a hidden risk that comps aren't pricing in. Stress-test before assuming the spread holds.
Location & tenants
- Location reads: area grade B — affects rentability + tenant quality, not the cash-flow math above.
- Indianapolis Public Schools (urban): math 14% / reading 20% proficiency, ranked #286 of 301 in IN (top 95%) — low school quality limits family demand, transient renter base, plan for 1-2y turnover; 77% free/reduced lunch — lower-income household profile, screen leases tightly.
- Market conditions: Rents rising fast (+6.4%/yr); 279 active listings in the ZIP; 40 comparable units currently listed for rent nearby; rentals at typical pace (median 24d on market — plan ~3-4 weeks tenant-placement turnaround); 42% of comp listings sitting > 30 days — soft ceiling on asking rent; 1,906 units permitted in Marion County in 2024 (621 in 5+ unit buildings).
Forward outlook
- Local home prices are declining (-3.0%/yr); year-one equity from $484 of loan paydown is wiped out by about $2k of value loss. Plan a longer hold.
- Marion County population projected at +18% by 2050 — long-run rental-demand tailwind backs the buy-and-hold thesis.
- At projected returns (-3.0% appreciation + 6.4% rent growth), your $20k cash investment doubles in ~3 years — after that, you're playing with house money.
Negotiation context
- It's been on market 59 days — a 3% lower offer ($68k) is reasonable based on typical stale-listing flexibility.
Risks & watch-outs
- Watch-outs: built in 1925 — expect roof / HVAC / electrical / plumbing capex.
- Climate carrying-cost: major flood risk — expect insurance premiums to compound above CPI over the hold.
Questions for the listing agent
- It's been on market 59 days. Have you received any prior offers? Is the seller open to a 3% concession, seller financing, or rate buy-down credit?
- Built in 1925 — when were the roof, HVAC, electrical panel, plumbing, and water heater last replaced?
- Is there a deadline driving the sale (1031 exchange, divorce, estate, relocation)? That informs how much negotiation room exists.
- What's the average days-on-market for RENTAL listings here right now (not sales)? A rising rental-DOM trend means longer vacancies and softer asking-rent achievability than the comps imply.
- What's the recent tenant-quality profile in this submarket — average credit score on applications, eviction rate, late-payment / NSF rate, and stable-employment percentage? A property-management company in the area should have these aggregated.
- How much new for-sale + rental construction is in the pipeline within 1–3 miles? Heavy new supply typically softens prices + rents 12–24 months out; constrained supply supports both.
Investment metrics
- 1% rule
- 2.04% ✓
- Cap rate
- 17.36%
- Cash-on-cash
- 39.54%
- DSCR
- 2.76
- GRM
- 4.1
CMA / ARV
- ARV (median comp)
- $213,586
- List price
- $70,000
- Delta
- -67.23%
- Verdict
- UNDERPRICED
- Comps
- 20 within 1.0 mi
Show comp detail 12 sales within ~0.75 mi
| Address | Dist | Beds/Ba | Sqft | Sold | Price | $/sf | Match |
|---|---|---|---|---|---|---|---|
| 2420 N Capitol Ave | 0.43mi | 3/2.5 (+1) | 1,414 (-1%) | 1mo | $194,000 | $137 | 69 |
| 2422 N Capitol Ave | 0.43mi | 3/2.5 (+1) | 1,408 (-1%) | 1mo | $194,000 | $138 | 68 |
| 451 W 26th St | 0.21mi | 3/2.0 (+1) | 1,320 (-7%) | 4mo | $85,000 | $64 | 67 |
| 713 W 32nd St | 0.58mi | 3/2.0 (+1) | 1,417 (-1%) | 1mo | $147,000 | $104 | 64 |
| 2709 Shriver Ave | 0.08mi | 3/2.0 (+1) | 1,212 (-15%) | 6mo | $123,016 | $101 | 59 |
| 2434 N Pennsylvania St | 0.61mi | 3/2.5 (+1) | 1,440 (+1%) | 4mo | $299,900 | $208 | 57 |
| 851 W 25th St | 0.58mi | 3/1.5 (+1) | 1,334 (-6%) | 4mo | $90,000 | $67 | 54 |
| 2442 Ethel Ave | 0.38mi | 2/1.0 | 1,214 (-15%) | 3mo | $150,000 | $124 | 53 |
| 2280 Indianapolis Ave | 0.56mi | 3/2.5 (+1) | 1,288 (-10%) | 0mo | $136,000 | $106 | 49 |
| 3224 N Capitol Ave | 0.56mi | 3/2.5 (+1) | 1,542 (+8%) | 3mo | $249,900 | $162 | 49 |
| 811 W 25th St | 0.53mi | 3/2.0 (+1) | 1,292 (-9%) | 9mo | $56,000 | $43 | 45 |
| 3310 N Capitol Ave | 0.65mi | 1/10.0 (-1) | 1,278 (-10%) | 6mo | $65,000 | $51 | 28 |
Match score weights: distance 35% · size 25% · config 20% · recency 20%. Top-matched comps best support the ARV.
Projected returns pro-forma
-3.0% appreciation · 6.43% rent growth · sell at horizon
- IRR
- 39.7%
- Equity multiple
- 2.78×
- Total profit
- $34,899
- Equity at exit
- $10,437
- IRR
- 47.7%
- Equity multiple
- 6.40×
- Total profit
- $105,854
- Equity at exit
- $6,052
Cash invested: $19,600 (down + closing). Projections, not guarantees.
Landlord ↔ Tenant lean methodology
- Overall (STATE)
- 90 Strongly Landlord-Friendly
- State Indiana
- 90 Strongly Landlord-Friendly · R+11
- County
- — inherits STATE
- City
- — inherits STATE
ZIP-level market 46208
- Rents YoY
- 6.4%
- Active inventory
- 279
- Price-to-rent
- 4.1×
Monthly cashflow live
- Estimated rent
- $1,426 high interval (Pro) →
- Mortgage (P&I)
- −$367
- Tax from tax record
- −$85 /mo · $1,018/yr
- Insurance
- −$29
- HOA
- −$0
- Vacancy / Maint / Mgmt
- −$300
- Net cashflow
- $646
Break-even live
UW: 25.0% down · 7.5% · 30yr · 1.5% tax · 5.0% vac · 8.0% maint · 8.0% mgmt
Financing live
Cash to close
- Down payment
- $17,500
- Closing costs
- $2,100
- Reserves months
- —
- Total cash needed
- —
Loan-product check · same deal, 3 products live
Conventional
25% down · 7.5% · 30yr
- Down + closing
- —
- Monthly P&I
- —
- Monthly cashflow
- —
- DSCR
- —
- Eligible?
- —
Personal DTI + credit; lowest rate.
DSCR
20% down · 8.5% · 30yr
- Down + closing
- —
- Monthly P&I
- —
- Monthly cashflow
- —
- DSCR
- —
- Eligible?
- —
No personal income docs; deal must DSCR.
Hard money
10% down · 12.0% · 12mo
- Down + closing
- —
- Monthly P&I
- —
- Monthly cashflow
- —
- DSCR
- —
- Eligible?
- —
Short-term bridge; refi at stabilization.
Rent comps 40 comps
| Address | Beds | Baths | Sqft | Rent | $/sqft | DOM | Units | Dist |
|---|---|---|---|---|---|---|---|---|
| 2808 N Capitol Ave Indianapolis, IN | 2.0 | 1.0 | 900 | $975 | $1.08 | 23d | 1 | 0.18mi |
| 516 W 28th St Indianapolis, IN | 2.0 | 1.0 | 1005 | $1,100 | $1.09 | 23d | 1 | 0.19mi |
| 538 W 29th St Indianapolis, IN | 3.0 | 1.0 | 1132 | $1,349 | $1.19 | 23d | 1 | 0.26mi |
| 560 Udell St Indianapolis, IN | 3.0 | 1.5 | 1176 | $1,190 | $1.01 | 23d | 1 | 0.28mi |
| 3031 Boulevard Pl Indianapolis, IN | 3.0 | 1.5 | 1395 | $1,450 | $1.04 | 17d | 1 | 0.29mi |
| 3017 Ethel Ave Indianapolis, IN | 3.0 | 1.5 | 1079 | $1,400 | $1.30 | 23d | 1 | 0.32mi |
| 648 W 30th St Indianapolis, IN | 3.0 | 2.0 | 1300 | $1,500 | $1.15 | 23d | 1 | 0.44mi |
| 824 W 29th St Indianapolis, IN | 3.0 | 2.0 | 1200 | $1,595 | $1.33 | 43d | 1 | 0.48mi |
| 55 W Fall Creek Parkway South Dr Unit C Indianapolis, IN | 2.0 | 1.0 | 1000 | $1,035 | $1.03 | 43d | 1 | 0.48mi |
| 826 W 29th St Indianapolis, IN | 3.0 | 2.0 | 1200 | $1,595 | $1.33 | 43d | 1 | 0.49mi |
| 2625 N Meridian St Indianapolis, IN | 1.0–2.0 | 1.0–2.0 | 850 | $2,150 | $2.53 | 7d | 8 | 0.52mi |
| 2318 N Capitol Ave Indianapolis, IN | 3.0 | 1.0 | 1440 | $1,050 | $0.73 | 43d | 1 | 0.54mi |
| 2801 N Talbott St Unit A Indianapolis, IN | 3.0 | 2.0 | 1296 | $1,850 | $1.43 | 43d | 1 | 0.59mi |
| 2813 N Talbott St Indianapolis, IN | 3.0 | 2.0 | 1297 | $1,800 | $1.39 | 43d | 1 | 0.59mi |
| 2809 N Talbott St Indianapolis, IN | 3.0 | 2.0 | 1250 | $1,750 | $1.40 | 43d | 1 | 0.59mi |
| 2805 N Talbott St Indianapolis, IN | 3.0 | 2.0 | 1296 | $1,800 | $1.39 | 43d | 1 | 0.59mi |
| 2901 N Talbott St Indianapolis, IN | 3.0 | 1.5 | 1388 | $1,400 | $1.01 | 43d | 1 | 0.59mi |
| 3103 N Meridian St Indianapolis, IN | 3.0 | 2.0 | 1280 | $1,775 | $1.39 | 23d | 1 | 0.60mi |
| 118 W 23rd St Indianapolis, IN | 3.0 | 1.5 | 1456 | $1,300 | $0.89 | 10d | 1 | 0.61mi |
| 2437 N Pennsylvania St Indianapolis, IN | 3.0 | 2.0 | 1400 | $1,650 | $1.18 | 23d | 1 | 0.61mi |
| 2235 Doctor Martin Luther King Junior St Indianapolis, IN | 3.0 | 1.5 | 948 | $1,700 | $1.79 | 43d | 1 | 0.62mi |
| 2925 N Delaware St Indianapolis, IN | 3.0 | 1.5 | 1322 | $1,275 | $0.96 | 23d | 1 | 0.65mi |
| 3004 N Delaware St Indianapolis, IN | 3.0 | 1.5 | 1600 | $1,599 | $1.00 | 7d | 1 | 0.66mi |
| 2955 N Delaware St Indianapolis, IN | 3.0 | 1.5 | 1400 | $1,600 | $1.14 | 43d | 1 | 0.67mi |
| 2224 N Kenwood Ave Indianapolis, IN | 3.0 | 3.0 | 1735 | $1,950 | $1.12 | 7d | 1 | 0.67mi |
| 908 Burdsal Pkwy Marion, IN | 2.0 | 1.0 | 936 | $1,300 | $1.39 | 23d | 1 | 0.71mi |
| 906 Burdsal Pkwy Indianapolis, IN | 2.0 | 1.0 | 936 | $1,295 | $1.38 | 23d | 1 | 0.71mi |
| 926 W 32nd St Indianapolis, IN | 3.0 | 2.0 | 1050 | $1,295 | $1.23 | 7d | 1 | 0.75mi |
| 3413 N Capitol Ave Indianapolis, IN | 3.0 | 1.0 | 1176 | $1,249 | $1.06 | 10d | 1 | 0.77mi |
| 3415 N Capitol Ave Indianapolis, IN | 3.0 | 1.0 | 1176 | $1,249 | $1.06 | 23d | 1 | 0.77mi |
| 321 E 31st St Indianapolis, IN | 3.0 | 1.0 | 1390 | $1,400 | $1.01 | 43d | 1 | 0.80mi |
| 2161 N Meridian St Indianapolis, IN | 3.0 | 2.0 | 1592 | $1,800 | $1.13 | 43d | 1 | 0.82mi |
| 3217 Rader St Indianapolis, IN | 3.0 | 1.0 | 1200 | $1,299 | $1.08 | 43d | 1 | 0.83mi |
| 1054 W 31st St Unit A Indianapolis, IN | 2.0 | 1.0 | 1200 | $1,500 | $1.25 | 43d | 1 | 0.85mi |
| 2131 N Meridian St Indianapolis, IN | 2.0 | 1.0 | 994 | $1,455 | $1.46 | 43d | 1 | 0.85mi |
| 3469 Graceland Ave Indianapolis, IN | 2.0 | 1.0 | 1000 | $1,200 | $1.20 | 43d | 1 | 0.86mi |
| 143 W 35th St Indianapolis, IN | 3.0 | 1.0 | 1235 | $1,175 | $0.95 | 7d | 1 | 0.87mi |
| 2920 Ruckle St Indianapolis, IN | 3.0 | 1.5 | 1272 | $1,700 | $1.34 | 7d | 1 | 0.88mi |
| 3457 N Illinois St Indianapolis, IN | 3.0 | 2.0 | 1230 | $1,145 | $0.93 | 23d | 1 | 0.88mi |
| 2141 N Talbott St Indianapolis, IN | 2.0 | 2.5 | 1556 | $2,600 | $1.67 | 12d | 1 | 0.89mi |
Listing history 17 events
-
2026-06-18days on market $70,000 Active 59 DOM
-
2026-06-17days on market $70,000 Active 58 DOM
-
2026-06-16days on market $70,000 Active 57 DOM
-
2026-06-15days on market $70,000 Active 56 DOM
-
2026-06-13days on market $70,000 Active 54 DOM
-
2026-06-13days on market $70,000 Active 53 DOM
-
2026-06-09days on market $70,000 Active 50 DOM
-
2026-06-08days on market $70,000 Active 49 DOM
-
2026-06-07days on market $70,000 Active 48 DOM
-
2026-06-03days on market $70,000 Active 44 DOM
-
2026-06-02days on market $70,000 Active 43 DOM
-
2026-06-01days on market $70,000 Active 42 DOM
-
2026-05-31days on market $70,000 Active 41 DOM
-
2026-05-11status Pending 741-char remark
Show marketing remark (741 chars)
A rare opportunity in a prime location with exceptional potential and long-term value. Ideally situated just minutes from the Children's Museum, local universities, and downtown Indianapolis, this home offers both convenience and strong market positioning. This 2-bedroom home includes a versatile upper level, ideal for a potential third bedroom or an additional living area. Surrounded by comparable properties supporting continued growth and strong resale value, this home is well-positioned for those seeking to personalize a residence, build equity, or explore rental or resale potential. A unique blend of location, flexibility, and opportunity, ready for its next chapter. Schedule your showing today and begin your next chapter here!
-
2026-05-04price $70,000 741-char remark
Show marketing remark (741 chars)
A rare opportunity in a prime location with exceptional potential and long-term value. Ideally situated just minutes from the Children's Museum, local universities, and downtown Indianapolis, this home offers both convenience and strong market positioning. This 2-bedroom home includes a versatile upper level, ideal for a potential third bedroom or an additional living area. Surrounded by comparable properties supporting continued growth and strong resale value, this home is well-positioned for those seeking to personalize a residence, build equity, or explore rental or resale potential. A unique blend of location, flexibility, and opportunity, ready for its next chapter. Schedule your showing today and begin your next chapter here!
-
2026-04-20price $80,000 741-char remark
Show marketing remark (741 chars)
A rare opportunity in a prime location with exceptional potential and long-term value. Ideally situated just minutes from the Children's Museum, local universities, and downtown Indianapolis, this home offers both convenience and strong market positioning. This 2-bedroom home includes a versatile upper level, ideal for a potential third bedroom or an additional living area. Surrounded by comparable properties supporting continued growth and strong resale value, this home is well-positioned for those seeking to personalize a residence, build equity, or explore rental or resale potential. A unique blend of location, flexibility, and opportunity, ready for its next chapter. Schedule your showing today and begin your next chapter here!
-
2026-04-02$90,000 Active 741-char remark
Show marketing remark (741 chars)
A rare opportunity in a prime location with exceptional potential and long-term value. Ideally situated just minutes from the Children's Museum, local universities, and downtown Indianapolis, this home offers both convenience and strong market positioning. This 2-bedroom home includes a versatile upper level, ideal for a potential third bedroom or an additional living area. Surrounded by comparable properties supporting continued growth and strong resale value, this home is well-positioned for those seeking to personalize a residence, build equity, or explore rental or resale potential. A unique blend of location, flexibility, and opportunity, ready for its next chapter. Schedule your showing today and begin your next chapter here!
ⓘ Source: listings_history table (triggers on properties + properties_extension) + one-shot
backfill from property_details.listing_events for pre-trigger history.
Tax reassessment forecast IN · Partial reset (capped growth)
- Current annual tax
- $1,018 · $85/mo
- Projected year-2 tax
- $1,018 · $85/mo
- Expected delta
- $0/yr ($0/mo · 0.0%)
ⓘ Screening estimate from a state-policy table — verify with the county assessor before closing.
Climate risk First Street
- Flood 6/10 Major FEMA zone X (unshaded) · 75% chance over 30 yrs
- Wildfire 1/10 Low
- Heat 4/10 Moderate 7 d/yr ≥101°F today · 19 d/yr by 30 yrs out
- Wind 2/10 Low 0% chance of damaging wind over 30 yrs
- Air quality 4/10 Moderate 5 unhealthy d/yr today · 7 by 30 yrs out
Nearby sold comps map
Loading sold comps map…
Walkable amenities ~0.75 mi
Loading nearby amenities…
Taxation est. · year 1
- Rental income
- $17,117
- − Mortgage interest
- −$3,921
- − Property taxes
- −$1,018
- − Insurance
- −$350
- − Repairs & maintenance
- −$1,369
- − Management
- −$1,369
- − Depreciation
- −$2,036
- Taxable income
- $7,053
- Est. tax owed @ 24.0%
- −$1,693
- After-tax cash flow
- $6,057/yr
For passive investors: Depreciation is non-cash, so a rental often shows a tax loss while cash-flowing — sheltering income. Rental losses are passive: they offset passive income freely, and up to $25,000/yr can offset ordinary (W-2) income if you actively participate and your MAGI is under $100k (phasing out to $0 by $150k); unused losses carry forward. On sale, claimed depreciation is recaptured at up to 25%, and gains may owe capital-gains tax (a 1031 exchange can defer both). Figures are a year-1 estimate at your 24.0% rate — not tax advice; consult a CPA.
Schools (NCES district)
- District
- Indianapolis Public Schools
- NCES district ID
- 1804770
- Math proficiency
- 14% ▼ -7.00%
- Reading proficiency
- 20% ▼ -3.00%
- Median HH income
- $32,034
- Composite
- 13.69/100
- National rank
- #9499
- State rank
- #286 of 301 in IN
Livability — Indianapolis city (balance)
No livability data for this city. (Only ~50 U.S. cities are tracked.)
Census & demographics
- Census place
- Indianapolis city (balance), IN
- County
- Marion County · 998,460 people
- City population
- 881,119
- Metro
- Indianapolis-Carmel-Anderson, IN
- Population (ZIP)
- 22,379
- Household income
- $60,062
- Rent vs Own
- Severe rent burden
- 978.0
Population outlook (Marion County) Hauer SSP2
- Today (2025)
- 1,025,572 people
- By 2030
- 1,065,727 · +3.9%
- By 2040
- 1,141,577 · +11.3%
- By 2050
- 1,208,920 · +17.9%
- By 2075
- 1,367,288 · +33.3%
- By 2100
- 1,438,201 · +40.2%
Race, ethnicity, and origin ACS 2023
- Neighborhood character
- Diverse neighborhood (Simpson 0.62)
- Race & ethnicity
- White 46% Black 40% Hispanic / Latino 8% Two or more races 6% Asian 2%
- Hispanic origin (detail)
- Mexican 4%
- Common ancestry
- Romanian 2% Slovak 2% Italian 1%
- Foreign-born
- 4% · Canada
- Languages at home
- 93% English-only · Spanish 5% French/Haitian/Cajun 1% Other Indo-European 1%
Political lean MEDSL · Marion
- 2024 margin
- Strong D (+27.7) · D 63.0% · R 35.3% · Other 1.7%
- 2008→2024 swing
- -0.7pp no change · 2008: 28.4pp · 2024: 27.7pp
- All cycles
- 2024: D+27.7 2020: D+29.1 2016: D+22.8 2012: D+22.2 2008: D+28.4
Not yet ingested
- Civics
- —
Market trends
- HPI YoY
- ▼ -324.63%
- Current HPI
- 319.7725
- Rent YoY
- ▲ 6.43%
- Metro
- Indianapolis-Carmel-Anderson, IN
- State GDP YoY
- ▲ 2.90%
- F500 in state
- 18
Industry mix (Fortune 500 HQ in IN)
| Industry | F500 HQs | Revenue |
|---|---|---|
| Industrial Machinery | 2 | $37B |
|
||
| Healthcare | 1 | $177B |
|
||
| Pharmaceuticals | 1 | $45B |
|
||
| Metals / Steel | 1 | $18B |
|
||
| Agriculture | 1 | $17B |
|
||
| Packaging | 1 | $12B |
|
||
Price history
-22.2% since first listed4 events — show timeline
- 2026-05-11 Pending — MIBOR as Distributed by MLS Grid
- 2026-05-04 Price Changed $70,000 MIBOR as Distributed by MLS Grid
- 2026-04-20 Price Changed $80,000 MIBOR as Distributed by MLS Grid
- 2026-04-02 Listed $90,000 MIBOR as Distributed by MLS Grid
Property tax history
-0.1%/yrLatest (2025): $1,018 · +12.0% YoY. Source: county tax records.
Cash-flow waterfall
monthlySold comps — $/sqft
last 12 mo · ≤1 miLoading sold comps…