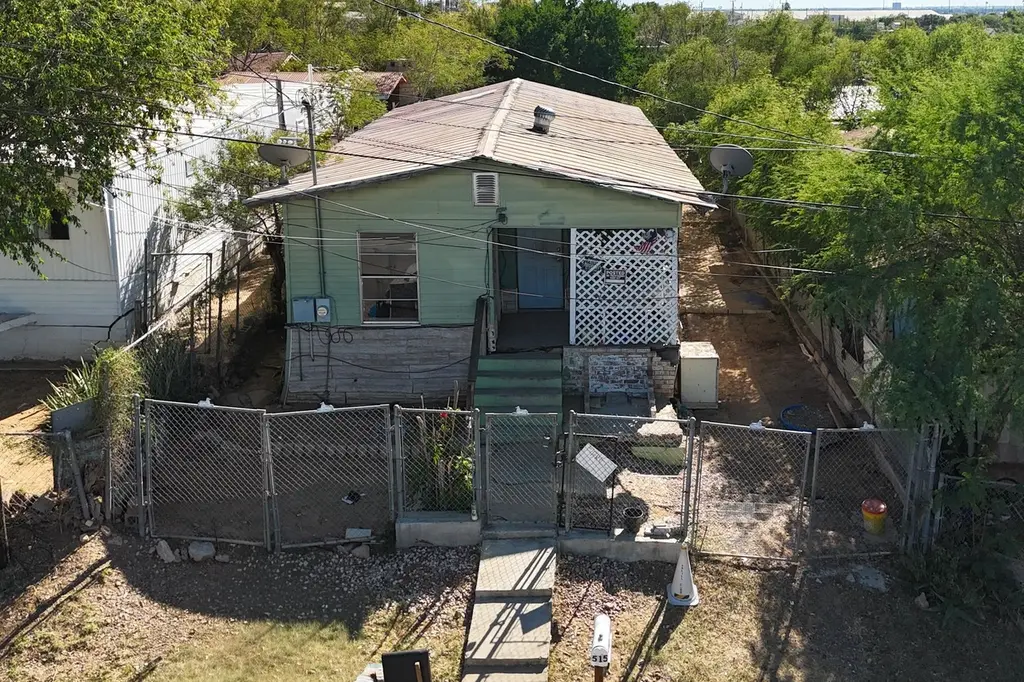
515 E Kearney St · Laredo, TX
Flood risk 1/10 · Minimal
- FEMA flood zone
- X (unshaded)
- Chance of flooding over 30 yrs
- 0.0%
- Est. flood insurance / yr
- $507 – $1,088
Fire risk 2/10 · Minimal
- Est. fire insurance / yr
- $1,222 – $2,270
Heat risk 8/10 · Major
- Hot days now (above 110°F)
- 7 days/yr
- Hot days in 30 yrs
- 23 days/yr
Wind risk 8/10 · Major
- Chance of severe wind over 30 yrs
- 80.0%
Air-quality risk 1/10 · Minimal
- Unhealthy air days now
- 0 days/yr
- Unhealthy air days in 30 yrs
- 0 days/yr
Risk factors via First Street. Map © Google.
Why this score? — see what drove the A- grade
The composite is a weighted blend of 9 inputs, each scored 0–100. Each bar is that input's sub-score; the figure is the points it added to the 100-point composite (weight × sub-score).
- Cash flow +30.0/30.0
- ARV discount +15.0/15.0
- 1% rule +10.0/10.0
- DSCR +10.0/10.0
- Appreciation +7.5/10.0
- Livability +3.7/5.0
- Rent growth +2.5/5.0
- Condition / age +2.5/5.0
- Schools +2.0/10.0
$55,000
🖨 Deal sheet (PDF) 📄 Offer letter ✓ Due diligence
Listing remarks
This property stands out as an ideal project for investors eager to capitalize on a home with great bones. The combination of a desirable location, flexible interior features, and the potential for significant returns makes this a must-see for those ready to take on a rewarding renovation.
Key facts
- 4,895 sq ft lot
- Built 1957
- Listed 3 days
Property features AI
Exterior
- Utilities: Public water
- Home design: Single-family residence; One story; Frame construction with wood siding
- Construction: Built with frame and wood siding
- Exterior features: Front porch; Chain link fencing; Level lot
Interior
- Flooring: Vinyl flooring; Wood flooring
- Bathrooms: 2 full bathrooms; 1 half bathroom
- Heating & cooling: No central heating
- Interior features: Electric water heater
Neighborhood map
What this means for you Summary
Snapshot
- This is a 2-bed/2.5-bath single-family listed at $55k.
Deal economics
- At list price, monthly cash flow is $328 ($4k/yr) — positive.
- The deal already cash-flows at list — no discount required.
- Meets the 1% rule at list price ($963 rent vs $55k).
- Cap rate 13.5% vs local median 4.1% in Laredo — top-decile yield for the area; either an underpriced asset or a hidden risk that comps aren't pricing in. Stress-test before assuming the spread holds.
Location & tenants
- Location reads 73/100 on livability (#227 in TX) — a middle-class / working-renter tenant base. Strengths: cost of living A+, housing A+, health & safety A+; Watch: crime C-, employment D+, amenities F.
- Laredo ISD (urban): math 21% / reading 29% proficiency, ranked #739 of 826 in TX (top 90%) — low school quality limits family demand, transient renter base, plan for 1-2y turnover; 82% free/reduced lunch — lower-income household profile, screen leases tightly.
- Zoned schools: Don Jose Gallego (math 12% / reading 22%, grade F, #3,836 of 4,322 statewide, top 91%, 607 students, 98% FRL); Memorial Middle (math 19% / reading 26%, grade F, #1,341 of 1,662 statewide, top 82%, 668 students, 98% FRL); Nixon H S (math 26% / reading 34%, grade F, #1,096 of 1,632 statewide, top 68%, 2,218 students, 96% FRL).
- Market conditions: 68 active listings in the ZIP; 12 comparable units currently listed for rent nearby; rentals lingering (median 46d on market — plan ~5-8 weeks vacancy on turnover, expect pricing pressure); 100% of comp listings sitting > 30 days — soft ceiling on asking rent; 1,448 units permitted in Webb County in 2024 (245 in 5+ unit buildings).
Forward outlook
- In year one you build about $3k of equity ($380 loan paydown + $3k appreciation (4.9% local appreciation)).
- Webb County population projected at +23% by 2050 — long-run rental-demand tailwind backs the buy-and-hold thesis.
- At projected returns (4.9% appreciation + 3.0% rent growth), your $15k cash investment doubles in ~3 years — after that, you're playing with house money.
- By year 10, paydown + projected appreciation supports a ~$31k cash-out refi (75% LTV) — recoverable capital for the next deal without selling this one.
Negotiation context
- Only 4 days on market — expect competitive offers; lowballing is unlikely to land.
- 2 sale attempts with the ask held roughly flat each time — persistent listings suggest the price (not the market) is what's stuck; bring a comps-based counter.
Risks & watch-outs
- Watch-outs: property tax is 2.7% of price; built in 1957 — expect roof / HVAC / electrical / plumbing capex.
- Climate carrying-cost: severe wind risk, 80% chance of damaging wind over 30y; extreme-heat days projected 7→23/yr by 2055 (HVAC capex compounding) — expect insurance premiums to compound above CPI over the hold.
Questions for the listing agent
- Built in 1957 — when were the roof, HVAC, electrical panel, plumbing, and water heater last replaced?
- Property tax is high relative to price — has the assessment been appealed recently, and will the sale trigger a re-assessment?
- Is there a deadline driving the sale (1031 exchange, divorce, estate, relocation)? That informs how much negotiation room exists.
- What's the average days-on-market for RENTAL listings here right now (not sales)? A rising rental-DOM trend means longer vacancies and softer asking-rent achievability than the comps imply.
- What's the recent tenant-quality profile in this submarket — average credit score on applications, eviction rate, late-payment / NSF rate, and stable-employment percentage? A property-management company in the area should have these aggregated.
- How much new for-sale + rental construction is in the pipeline within 1–3 miles? Heavy new supply typically softens prices + rents 12–24 months out; constrained supply supports both.
Investment metrics
- 1% rule
- 1.75% ✓
- Cap rate
- 13.45%
- Cash-on-cash
- 25.57%
- DSCR
- 2.14
- GRM
- 4.8
CMA / ARV
- ARV (median comp)
- $85,000
- List price
- $55,000
- Delta
- -17.65%
- Verdict
- UNDERPRICED
- Comps
- 1 within 2.0 mi
Projected returns pro-forma
4.93% appreciation · 3.0% rent growth · sell at horizon
- IRR
- 35.1%
- Equity multiple
- 3.17×
- Total profit
- $33,397
- Equity at exit
- $30,928
- IRR
- 33.5%
- Equity multiple
- 6.40×
- Total profit
- $83,099
- Equity at exit
- $53,181
Cash invested: $15,400 (down + closing). Projections, not guarantees.
Landlord ↔ Tenant lean methodology
- Overall (STATE)
- 87 Strongly Landlord-Friendly
- State Texas
- 87 Strongly Landlord-Friendly · R+5
- County
- — inherits STATE
- City
- — inherits STATE
ZIP-level market 78040
- Home prices YoY
- 3.9%
- Active inventory
- 68
- Price-to-rent
- 4.8×
Monthly cashflow live
- Estimated rent
- $963 high interval (Pro) →
- Mortgage (P&I)
- −$288
- Tax from tax record
- −$122 /mo · $1,459/yr
- Insurance
- −$23
- HOA
- −$0
- Vacancy / Maint / Mgmt
- −$202
- Net cashflow
- $328
Break-even live
Sensitivity live
| Price | -10% $359 | -5% $344 | +0% $328 | +5% $313 | +10% $297 |
|---|---|---|---|---|---|
| Rent | -10% $252 | -5% $290 | +0% $328 | +5% $366 | +10% $404 |
| Rate | -1.0pp $356 | -0.5pp $342 | base $328 | +0.5pp $314 | +1.0pp $299 |
UW: 25.0% down · 7.5% · 30yr · 1.5% tax · 5.0% vac · 8.0% maint · 8.0% mgmt
Financing live
Cash to close
- Down payment
- $13,750
- Closing costs
- $1,650
- Reserves months
- —
- Total cash needed
- —
Loan-product check · same deal, 3 products live
Conventional
25% down · 7.5% · 30yr
- Down + closing
- —
- Monthly P&I
- —
- Monthly cashflow
- —
- DSCR
- —
- Eligible?
- —
Personal DTI + credit; lowest rate.
DSCR
20% down · 8.5% · 30yr
- Down + closing
- —
- Monthly P&I
- —
- Monthly cashflow
- —
- DSCR
- —
- Eligible?
- —
No personal income docs; deal must DSCR.
Hard money
10% down · 12.0% · 12mo
- Down + closing
- —
- Monthly P&I
- —
- Monthly cashflow
- —
- DSCR
- —
- Eligible?
- —
Short-term bridge; refi at stabilization.
Rent comps 12 comps
| Address | Beds | Baths | Sqft | Rent | $/sqft | DOM | Units | Dist |
|---|---|---|---|---|---|---|---|---|
| 2605 Springfield Ave Unit 4 Laredo, TX | 2.0 | 1.0 | 728 | $850 | $1.17 | 45d | 1 | 0.11mi |
| 3509 Springfield Ave Laredo, TX | 3.0 | 2.0 | 1394 | $1,250 | $0.90 | 45d | 1 | 0.50mi |
| 1402 Corpus Christi St Unit F Laredo, TX | 1.0 | 1.0 | 700 | $800 | $1.14 | 45d | 1 | 1.01mi |
| 1502 E San Pedro St Laredo, TX | 2.0 | 1.0 | 793 | $900 | $1.13 | 45d | 1 | 1.01mi |
| 1502 E San Pedro St Unit 11 Laredo, TX | 2.0 | 1.0 | 793 | $900 | $1.13 | 45d | 1 | 1.01mi |
| 419 W Eistetter St Unit 7 Laredo, TX | 2.0 | 1.0 | 756 | $980 | $1.30 | 45d | 1 | 1.09mi |
| 4505 Springfield Ave Laredo, TX | 1.0–3.0 | 1.0–2.0 | 740 | $875 | $1.18 | 45d | 3 | 1.09mi |
| 2320 E Stewart St Laredo, TX | 2.0 | 1.0 | 888 | $1,000 | $1.13 | 45d | 2 | 1.14mi |
| 1319 Stone Ave Laredo, TX | 2.0 | 1.0 | 918 | $1,250 | $1.36 | 45d | 1 | 1.35mi |
| 2704 E Kearney St Unit 2 Laredo, TX | 2.0 | 1.0 | 750 | $750 | $1.00 | 45d | 1 | 1.37mi |
| 2016 Rosario St Laredo, TX | 3.0 | 1.0 | 1293 | $1,350 | $1.04 | 45d | 1 | 1.45mi |
| 3315 N Arkansas Ave Unit 3 Laredo, TX | 2.0 | 1.0 | 815 | $1,125 | $1.38 | 45d | 1 | 1.48mi |
Listing history 7 events
-
2026-06-16days on market $55,000 Active 4 DOM
-
2026-06-15days on market $55,000 Active 3 DOM
-
2026-06-12pricedays on market $55,000 Active 1 DOM
-
2026-05-31days on market $70,000 Active 206 DOM
-
2026-04-03price $70,000 290-char remark
-
2026-01-27price $80,000 290-char remark
-
2025-11-06$87,000 Active 290-char remark
ⓘ Source: listings_history table (triggers on properties + properties_extension) + one-shot
backfill from property_details.listing_events for pre-trigger history.
Tax reassessment forecast TX · Resets to sale price
- Current annual tax
- $1,459 · $122/mo
- Projected year-2 tax
- $1,459 · $122/mo
- Expected delta
- $0/yr ($0/mo · 0.0%)
ⓘ Screening estimate from a state-policy table — verify with the county assessor before closing.
Climate risk First Street
- Flood 1/10 Low FEMA zone X (unshaded) · 0% chance over 30 yrs
- Wildfire 2/10 Low
- Heat 8/10 Severe 7 d/yr ≥110°F today · 23 d/yr by 30 yrs out
- Wind 8/10 Severe 80% chance of damaging wind over 30 yrs
- Air quality 1/10 Low 0 unhealthy d/yr today · 0 by 30 yrs out
Nearby sold comps map
Loading sold comps map…
Walkable amenities ~0.75 mi
Loading nearby amenities…
Taxation est. · year 1
- Rental income
- $11,561
- − Mortgage interest
- −$3,081
- − Property taxes
- −$1,459
- − Insurance
- −$275
- − Repairs & maintenance
- −$925
- − Management
- −$925
- − Depreciation
- −$1,600
- Taxable income
- $3,296
- Est. tax owed @ 24.0%
- −$791
- After-tax cash flow
- $3,147/yr
For passive investors: Depreciation is non-cash, so a rental often shows a tax loss while cash-flowing — sheltering income. Rental losses are passive: they offset passive income freely, and up to $25,000/yr can offset ordinary (W-2) income if you actively participate and your MAGI is under $100k (phasing out to $0 by $150k); unused losses carry forward. On sale, claimed depreciation is recaptured at up to 25%, and gains may owe capital-gains tax (a 1031 exchange can defer both). Figures are a year-1 estimate at your 24.0% rate — not tax advice; consult a CPA.
Schools (NCES district)
- District
- Laredo ISD
- NCES district ID
- 4826790
- Math proficiency
- 21% ▼ -34.00%
- Reading proficiency
- 29% ▼ -13.00%
- Median HH income
- $25,655
- Composite
- 19.7/100
- National rank
- #8724
- State rank
- #739 of 826 in TX
Livability — Laredo
- Score
- 73/100
- State rank
- #227
- US rank
- #5399
Category grades
Schools grade is shown separately in the Schools card above.
Census & demographics
- Census place
- Laredo, TX
- City population
- 67,333
- Population (ZIP)
- 36,115
Population outlook (Webb County) Hauer SSP2
- Today (2025)
- 301,387 people
- By 2030
- 316,307 · +5.0%
- By 2040
- 345,636 · +14.7%
- By 2050
- 370,647 · +23.0%
- By 2075
- 413,907 · +37.3%
- By 2100
- 416,458 · +38.2%
Race, ethnicity, and origin ACS 2023
- Neighborhood character
- Predominantly Hispanic (97%)
- Race & ethnicity
- Hispanic / Latino 97% Two or more races 56% White 3%
- Hispanic origin (detail)
- Mexican 95%
- Foreign-born
- 32% · Canada
- Languages at home
- 7% English-only · Spanish 93%
Political lean MEDSL · Webb
- 2024 margin
- Toss-up / Even · D 48.5% · R 50.7%
- 2008→2024 swing
- -45.6pp toward R · 2008: 43.4pp · 2024: -2.2pp
- All cycles
- 2024: R+2.2 2020: D+23.3 2016: D+51.6 2012: D+54.0 2008: D+43.4
Not yet ingested
- Civics
- —
Market trends
- HPI YoY
- ▲ 4.93%
- Current HPI
- 133.0457
- Rent YoY
- —
- Metro
- —
- State GDP YoY
- ▲ 3.95%
- F500 in state
- 110
Industry mix (Fortune 500 HQ in TX)
| Industry | F500 HQs | Revenue |
|---|---|---|
| Energy | 16 | $1,198B |
|
||
| Technology | 5 | $198B |
|
||
| Engineering / Construction | 4 | $72B |
|
||
| Energy Services | 3 | $60B |
|
||
| Utilities | 3 | $41B |
|
||
| Healthcare | 2 | $330B |
|
||
Price history
-36.8% since first listed4 events — show timeline
- 2026-06-12 Listed $55,000 LAOR
- 2026-04-03 Price Changed $70,000 LAOR
- 2026-01-27 Price Changed $80,000 LAOR
- 2025-11-06 Listed $87,000 LAOR
Property tax history
+2.7%/yrLatest (2025): $1,459 · -2.8% YoY. Source: county tax records.
Cash-flow waterfall
monthlySold comps — $/sqft
last 12 mo · ≤1 miLoading sold comps…