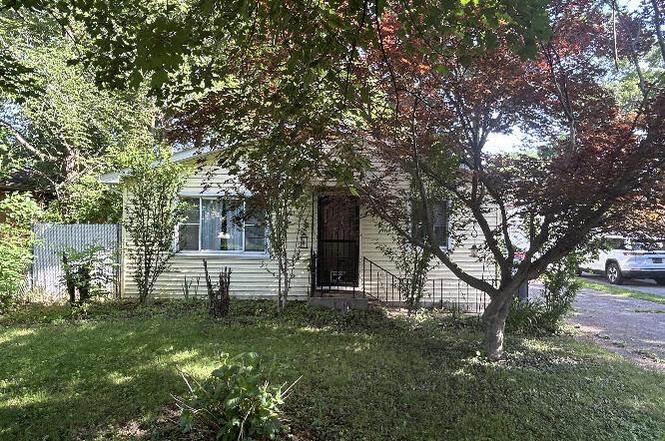
6090 Mulberry Ave · Portage, IN
Flood risk 1/10 · Minimal
- FEMA flood zone
- X (unshaded)
- Chance of flooding over 30 yrs
- 0.0%
- Est. flood insurance / yr
- $507 – $1,088
Fire risk 1/10 · Minimal
- Est. fire insurance / yr
- $717 – $1,331
Heat risk 2/10 · Minimal
- Hot days now (above 101°F)
- 7 days/yr
- Hot days in 30 yrs
- 15 days/yr
Wind risk 2/10 · Minimal
- Chance of severe wind over 30 yrs
- —
Air-quality risk 4/10 · Minor
- Unhealthy air days now
- 5 days/yr
- Unhealthy air days in 30 yrs
- 6 days/yr
Risk factors via First Street. Map © Google.
Why this score? — see what drove the B- grade
The composite is a weighted blend of 9 inputs, each scored 0–100. Each bar is that input's sub-score; the figure is the points it added to the 100-point composite (weight × sub-score).
- Cash flow +24.0/30.0
- ARV discount +15.0/15.0
- DSCR +7.7/10.0
- 1% rule +6.2/10.0
- Rent growth +3.6/5.0
- Livability +3.6/5.0
- Schools +2.7/10.0
- Condition / age +2.5/5.0
- Appreciation +0.0/10.0
$159,900
🖨 Deal sheet (PDF) 📄 Offer letter ✓ Due diligence
Listing remarks
Wow! Check out this 3 bed 1 bath ranch located in the heart of Portage. Bring your ideas to update this hidden gem. Newer roof and siding on this beauty. Spacious room with a large backyard. This is a great home for the 1st time home owner or investor. Schedule your showing today!!!
Key facts
- Newer roof
- Large backyard
- Newer siding
Tags
Property features AI
Exterior
- Parking: Driveway; On-street parking available; Garage faces front; Approximately 2.5 garage spaces
- Utilities: Public water; Public sewer
- Home design: Single-story home; Built in 1968
- Construction: Built in 1968
- Exterior features: Fenced yard; City view
Interior
- Kitchen: Built-in gas range; Refrigerator
- Bedrooms: Primary bedroom; Bedroom 2; Bedroom 3
- Flooring: Carpet; Laminate
- Bathrooms: 1 full bathroom
- Heating & cooling: Forced air heating; Central air conditioning
- Interior features: No notable built-in interior features reported; City view from the property
- Laundry & utility: Main-level laundry with gas dryer hookup; Gas water heater
Neighborhood map
What this means for you Summary
Snapshot
- This is a 3-bed/1.0-bath single-family listed at $160k.
Deal economics
- At list price, monthly cash flow is $312 ($4k/yr) — positive.
- The deal already cash-flows at list — no discount required.
- Meets the 1% rule at list price ($2k rent vs $160k).
- Cap rate 8.6% vs local median 4.0% in Portage — top-decile yield for the area; either an underpriced asset or a hidden risk that comps aren't pricing in. Stress-test before assuming the spread holds.
Location & tenants
- Location reads 72/100 on livability (#111 in IN) — a middle-class / working-renter tenant base. Strengths: cost of living A+, housing A+, health & safety A; Watch: schools D, amenities F, commute F.
- Portage Township Schools (suburban): math 26% / reading 36% proficiency, ranked #221 of 301 in IN (top 73%) — families likely to look elsewhere, expect single-tenant / working-renter base with shorter leases.
- Market conditions: Rents rising fast (+4.3%/yr); 311 active listings in the ZIP; 8 comparable units currently listed for rent nearby; rentals at typical pace (median 25d on market — plan ~3-4 weeks tenant-placement turnaround); solid renter incomes; 542 units permitted in Porter County in 2024 (0 in 5+ unit buildings).
Forward outlook
- Local home prices are declining (-3.0%/yr); year-one equity from $1k of loan paydown is wiped out by about $5k of value loss. Plan a longer hold.
- Porter County population projected at +6% by 2050 — modest demand growth; plan on rents tracking national, not racing it.
Negotiation context
- Only 5 days on market — expect competitive offers; lowballing is unlikely to land.
- 3 sale attempts since 27y ago with the ask held roughly flat each time — persistent listings suggest the price (not the market) is what's stuck; bring a comps-based counter.
Questions for the listing agent
- Built in 1968 — when were the roof, HVAC, electrical panel, plumbing, and water heater last replaced?
- Is there a deadline driving the sale (1031 exchange, divorce, estate, relocation)? That informs how much negotiation room exists.
- Schools are D-rated, which usually means shorter tenancies and higher turnover. Who's the typical renter profile here, and what's been the actual vacancy rate?
- What's the average days-on-market for RENTAL listings here right now (not sales)? A rising rental-DOM trend means longer vacancies and softer asking-rent achievability than the comps imply.
- What's the recent tenant-quality profile in this submarket — average credit score on applications, eviction rate, late-payment / NSF rate, and stable-employment percentage? A property-management company in the area should have these aggregated.
- How much new for-sale + rental construction is in the pipeline within 1–3 miles? Heavy new supply typically softens prices + rents 12–24 months out; constrained supply supports both.
Investment metrics
- 1% rule
- 1.12% ✓
- Cap rate
- 8.64%
- Cash-on-cash
- 8.37%
- DSCR
- 1.37
- GRM
- 7.4
CMA / ARV
- ARV (on-the-fly)
- $247,296
- Comps found
- 12
Show comp detail 12 sales within ~0.75 mi
| Address | Dist | Beds/Ba | Sqft | Sold | Price | $/sf | Match |
|---|---|---|---|---|---|---|---|
| 2792 Irving St | 0.13mi | 3/1.0 | 1,274 (-1%) | 4mo | $245,000 | $192 | 89 |
| 2712 Eleanor St | 0.08mi | 3/1.5 | 1,323 (+3%) | 6mo | $234,900 | $178 | 84 |
| 2709 Teresa St | 0.15mi | 3/1.5 | 1,279 (-1%) | 11mo | $285,000 | $223 | 80 |
| 2856 Irving St | 0.23mi | 3/1.0 | 1,274 (-1%) | 11mo | $224,900 | $177 | 78 |
| 2661 Walnut St | 0.33mi | 3/1.0 | 1,328 (+3%) | 6mo | $249,500 | $188 | 74 |
| 6088 Mulberry Ave | 0.01mi | 3/1.0 | 1,100 (-15%) | 13mo | $189,900 | $173 | 64 |
| 2738 Tecumseh St | 0.35mi | 4/1.5 (+1) | 1,456 (+13%) | 4mo | $230,000 | $158 | 52 |
| 2819 Hamstrom Rd | 0.60mi | 3/2.0 | 1,362 (+6%) | 9mo | $245,000 | $180 | 51 |
| 6168 Brie Ave | 0.48mi | 3/2.0 | 1,120 (-13%) | 1mo | $260,000 | $232 | 50 |
| 3010 Angelina St | 0.57mi | 3/2.0 | 1,400 (+9%) | 10mo | $300,000 | $214 | 47 |
| 6198 Robbins Rd | 0.57mi | 3/2.0 | 1,416 (+10%) | 9mo | $295,900 | $209 | 45 |
| 3044 Angelina St | 0.64mi | 3/2.0 | 1,162 (-10%) | 9mo | $291,000 | $250 | 42 |
Match score weights: distance 35% · size 25% · config 20% · recency 20%. Top-matched comps best support the ARV.
Projected returns pro-forma
-3.0% appreciation · 4.29% rent growth · sell at horizon
- IRR
- -2.1%
- Equity multiple
- 0.92×
- Total profit
- $-3,640
- Equity at exit
- $23,842
- IRR
- 8.9%
- Equity multiple
- 1.73×
- Total profit
- $32,486
- Equity at exit
- $13,825
Cash invested: $44,772 (down + closing). Projections, not guarantees.
Landlord ↔ Tenant lean methodology
- Overall (STATE)
- 90 Strongly Landlord-Friendly
- State Indiana
- 90 Strongly Landlord-Friendly · R+11
- County
- — inherits STATE
- City
- — inherits STATE
ZIP-level market 46368
- Rents YoY
- 4.3%
- Active inventory
- 311
- Price-to-rent
- 7.4×
Monthly cashflow live
- Estimated rent
- $1,795 high interval (Pro) →
- Mortgage (P&I)
- −$839
- Tax from tax record
- −$201 /mo · $2,410/yr
- Insurance
- −$67
- HOA
- −$0
- Vacancy / Maint / Mgmt
- −$377
- Net cashflow
- $312
Break-even live
Sensitivity live
| Price | -10% $403 | -5% $357 | +0% $312 | +5% $267 | +10% $222 |
|---|---|---|---|---|---|
| Rent | -10% $170 | -5% $241 | +0% $312 | +5% $383 | +10% $454 |
| Rate | -1.0pp $393 | -0.5pp $353 | base $312 | +0.5pp $271 | +1.0pp $229 |
UW: 25.0% down · 7.5% · 30yr · 1.5% tax · 5.0% vac · 8.0% maint · 8.0% mgmt
Financing live
Cash to close
- Down payment
- $39,975
- Closing costs
- $4,797
- Reserves months
- —
- Total cash needed
- —
Loan-product check · same deal, 3 products live
Conventional
25% down · 7.5% · 30yr
- Down + closing
- —
- Monthly P&I
- —
- Monthly cashflow
- —
- DSCR
- —
- Eligible?
- —
Personal DTI + credit; lowest rate.
DSCR
20% down · 8.5% · 30yr
- Down + closing
- —
- Monthly P&I
- —
- Monthly cashflow
- —
- DSCR
- —
- Eligible?
- —
No personal income docs; deal must DSCR.
Hard money
10% down · 12.0% · 12mo
- Down + closing
- —
- Monthly P&I
- —
- Monthly cashflow
- —
- DSCR
- —
- Eligible?
- —
Short-term bridge; refi at stabilization.
Rent comps 8 comps
| Address | Beds | Baths | Sqft | Rent | $/sqft | DOM | Units | Dist |
|---|---|---|---|---|---|---|---|---|
| 6021 Canden Ave Portage, IN | 2.0 | 1.0 | 1000 | $1,350 | $1.35 | 25d | 1 | 0.51mi |
| 6021 Canden Ave Portage, IN | 2.0 | 1.0 | 1000 | $1,250 | $1.25 | 13d | 1 | 0.51mi |
| 6055 Canden Ave Portage, IN | 1.0–2.0 | 1.0–2.0 | 975 | $1,400 | $1.44 | 2d | 5 | 0.51mi |
| 2540 Promenade Way Portage, IN | 3.0 | 2.0 | 1558 | $2,488 | $1.60 | 4d | 1 | 0.60mi |
| 2540 Promenade Way Portage, IN | 2.0 | 2.0 | 1329 | $2,299 | $1.73 | 44d | 1 | 0.60mi |
| 3300 Denise Dr Portage, IN | 1.0–2.0 | 1.0 | 810 | $1,185 | $1.46 | 2d | 3 | 1.06mi |
| 5750 Blossom Ave Portage, IN | 3.0 | 2.0 | 1232 | $2,500 | $2.03 | 25d | 1 | 1.32mi |
| 5946 Fiesta Ave Portage, IN | 2.0 | 2.0 | 912 | $1,350 | $1.48 | 44d | 1 | 1.36mi |
Listing history 5 events
-
2026-06-15status $159,900 Pending 5 DOM
-
2026-06-15days on market $159,900 Active 5 DOM
-
2026-06-13days on market $159,900 Active 3 DOM
-
2026-06-13remarks 283-char remark
-
2026-06-13$159,900 Active 2 DOM
ⓘ Source: listings_history table (triggers on properties + properties_extension) + one-shot
backfill from property_details.listing_events for pre-trigger history.
Tax reassessment forecast IN · Partial reset (capped growth)
- Current annual tax
- $2,410 · $201/mo
- Projected year-2 tax
- $2,410 · $201/mo
- Expected delta
- $0/yr ($0/mo · 0.0%)
ⓘ Screening estimate from a state-policy table — verify with the county assessor before closing.
Climate risk First Street
- Flood 1/10 Low FEMA zone X (unshaded) · 0% chance over 30 yrs
- Wildfire 1/10 Low
- Heat 2/10 Low 7 d/yr ≥101°F today · 15 d/yr by 30 yrs out
- Wind 2/10 Low
- Air quality 4/10 Moderate 5 unhealthy d/yr today · 6 by 30 yrs out
Nearby sold comps map
Loading sold comps map…
Walkable amenities ~0.75 mi
Loading nearby amenities…
Taxation est. · year 1
- Rental income
- $21,542
- − Mortgage interest
- −$8,957
- − Property taxes
- −$2,410
- − Insurance
- −$800
- − Repairs & maintenance
- −$1,723
- − Management
- −$1,723
- − Depreciation
- −$4,652
- Taxable income
- $1,277
- Est. tax owed @ 24.0%
- −$307
- After-tax cash flow
- $3,440/yr
For passive investors: Depreciation is non-cash, so a rental often shows a tax loss while cash-flowing — sheltering income. Rental losses are passive: they offset passive income freely, and up to $25,000/yr can offset ordinary (W-2) income if you actively participate and your MAGI is under $100k (phasing out to $0 by $150k); unused losses carry forward. On sale, claimed depreciation is recaptured at up to 25%, and gains may owe capital-gains tax (a 1031 exchange can defer both). Figures are a year-1 estimate at your 24.0% rate — not tax advice; consult a CPA.
Schools (NCES district)
- District
- Portage Township Schools
- NCES district ID
- 1809150
- Math proficiency
- 26% ▼ -15.00%
- Reading proficiency
- 36% ▼ -10.00%
- Median HH income
- $53,880
- Composite
- 27.37/100
- National rank
- #6978
- State rank
- #221 of 301 in IN
Livability — Portage
- Score
- 72/100
- State rank
- #111
- US rank
- #5725
Category grades
Schools grade is shown separately in the Schools card above.
Census & demographics
- Census place
- Portage, IN
- County
- Porter County · 151,647 people
- City population
- 40,301
- Metro
- Chicago-Naperville-Elgin, IL-IN-WI
- Population (ZIP)
- 40,301
- Household income
- $76,368
- Rent vs Own
- Severe rent burden
- 856.0
Population outlook (Porter County) Hauer SSP2
- Today (2025)
- 177,804 people
- By 2030
- 181,552 · +2.1%
- By 2040
- 185,830 · +4.5%
- By 2050
- 187,498 · +5.5%
- By 2075
- 189,585 · +6.6%
- By 2100
- 183,722 · +3.3%
Race, ethnicity, and origin ACS 2023
- Neighborhood character
- Predominantly White (67%)
- Race & ethnicity
- White 67% Hispanic / Latino 18% Two or more races 10% Black 10% Asian 1%
- Hispanic origin (detail)
- Mexican 13% Puerto Rican 4%
- Common ancestry
- Romanian 6% Slovak 2% Iranian 1%
- Foreign-born
- 3% · Canada
- Languages at home
- 92% English-only · Spanish 6%
Political lean MEDSL · Porter
- 2024 margin
- R (+10.5) · D 43.8% · R 54.3% · Other 1.8%
- 2008→2024 swing
- -17.7pp toward R · 2008: 7.2pp · 2024: -10.5pp
- All cycles
- 2024: R+10.5 2020: R+6.1 2016: R+6.8 2012: D+3.8 2008: D+7.2
Not yet ingested
- Civics
- —
Market trends
- HPI YoY
- ▼ -195.94%
- Current HPI
- 181.3254
- Rent YoY
- ▲ 4.29%
- Metro
- Chicago-Naperville-Elgin, IL-IN-WI
- State GDP YoY
- ▲ 2.90%
- F500 in state
- 18
Industry mix (Fortune 500 HQ in IN)
| Industry | F500 HQs | Revenue |
|---|---|---|
| Industrial Machinery | 2 | $37B |
|
||
| Healthcare | 1 | $177B |
|
||
| Pharmaceuticals | 1 | $45B |
|
||
| Metals / Steel | 1 | $18B |
|
||
| Agriculture | 1 | $17B |
|
||
| Packaging | 1 | $12B |
|
||
Price history
+74.8% since first listed5 events — show timeline
- 2026-06-10 Listed $159,900 NIRA MLS as Distributed by MLS Grid
- 2000-05-03 Listing Removed — NIRA MLS as Distributed by MLS Grid
- 2000-02-24 Listed $83,000 NIRA MLS as Distributed by MLS Grid
- 2000-02-09 Listing Removed — NIRA MLS as Distributed by MLS Grid
- 1999-09-09 Listed $91,500 NIRA MLS as Distributed by MLS Grid
Property tax history
+6.0%/yrLatest (2024): $2,410 · +1.0% YoY. Source: county tax records.
Cash-flow waterfall
monthlySold comps — $/sqft
last 12 mo · ≤1 miLoading sold comps…