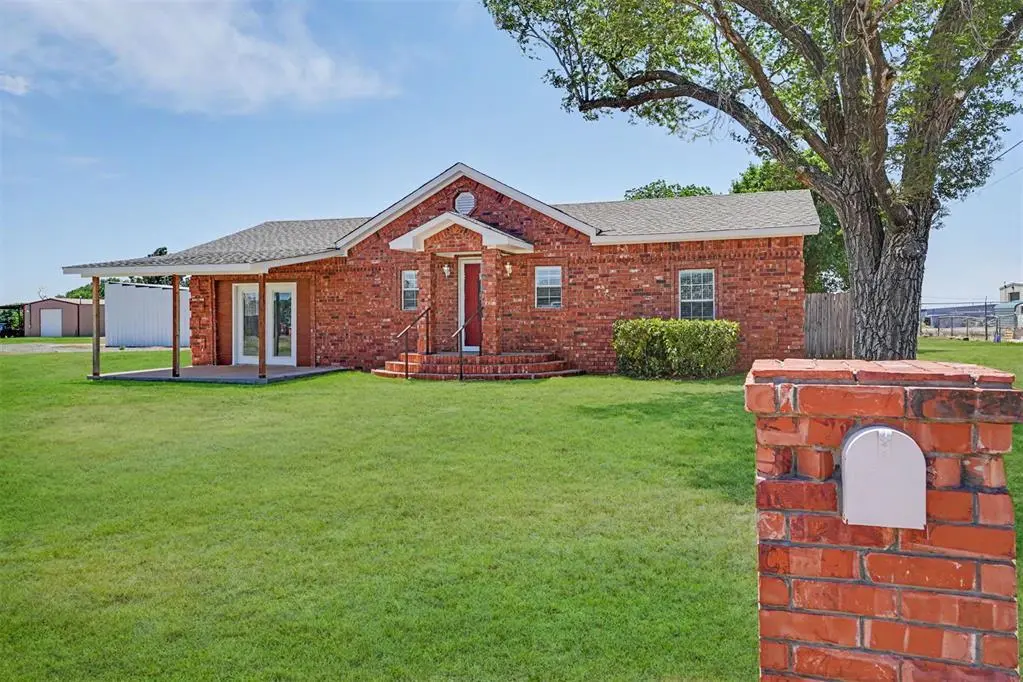
112 S Bryan Ave · East Duke, OK
Flood risk 1/10 · Minimal
- FEMA flood zone
- X (unshaded)
- Chance of flooding over 30 yrs
- 0.0%
- Est. flood insurance / yr
- $507 – $1,088
Fire risk 1/10 · Minimal
- Est. fire insurance / yr
- $2,463 – $4,575
Heat risk 7/10 · Major
- Hot days now (above 108°F)
- 7 days/yr
- Hot days in 30 yrs
- 19 days/yr
Wind risk 2/10 · Minimal
- Chance of severe wind over 30 yrs
- 4.0%
Air-quality risk 1/10 · Minimal
- Unhealthy air days now
- 0 days/yr
- Unhealthy air days in 30 yrs
- 0 days/yr
Risk factors via First Street. Map © Google.
Why this score? — see what drove the D- grade
The composite is a weighted blend of 9 inputs, each scored 0–100. Each bar is that input's sub-score; the figure is the points it added to the 100-point composite (weight × sub-score).
- Cash flow +11.1/30.0
- ARV discount +7.5/15.0
- Appreciation +5.0/10.0
- DSCR +3.2/10.0
- Livability +3.1/5.0
- Rent growth +2.5/5.0
- Condition / age +2.5/5.0
- Schools +2.4/10.0
- 1% rule +2.1/10.0
$130,000
🖨 Deal sheet 📄 Offer letter ✓ Due diligence
Listing remarks
From the fireplace to the backyard access, this place just feels like home the minute you walk up. This 2-bedroom, 1 bathroom, 2 living area brick home sits on a corner lot in Duke, OK and has so many extras packed into it. You’ve got a living room plus a den with a fireplace and access to both the front and back covered patios. One bedroom even has its own private door to the backyard. The kitchen includes the refrigerator, electric stove, dishwasher, and a new microwave/range hood. The home also has can lighting, full LED lighting throughout, newer windows, surround sound, wired outdoor patio speakers, and is all electric. Laundry area also included! Outside you’ll find a priv
Key facts
- Backyard access
- Refrigerator
- Electric stove
Tags
Property features AI
Finance
- Other: Existing property; No storm shelter; Located on a corner lot with directions: From Main Street, turn South on Bryan Avenue. Property is on the West side of the road.
- Financial info: Loan qualification possible; Not assumable
- HOA & community: No mandatory association dues
Exterior
- Utilities: Electricity available; Homestead exemption claimed
- Home design: Single family residence; One-level home; Residential property; Duke Original addition
- Construction: Brick and frame construction; Composition roof (new in 2026); Post-tension foundation
- Exterior features: Covered patio; Covered porch; Outbuildings; Wood fencing; Corner lot
Interior
- Bedrooms: 2 bedrooms
- Bathrooms: 1 full bathroom
- Heating & cooling: Electric heating
- Interior features: Two living areas; One electric fireplace
Neighborhood map
What this means for you Summary
Snapshot
- This is a 1-bed/1.0-bath single-family listed at $130k.
Deal economics
- At list price, monthly cash flow is $-52 ($-620/yr) — negative.
- To cash-flow at today's rent, offer at most $121k (7.0% below list).
- To meet the 1% rule (rent ≥ 1% of price), the offer needs to be $92k (29.2% below list).
- Recommended offer: $92k (29.2% below list) — sets the bar for 1% rule.
Location & tenants
- Location reads 61/100 on livability (#273 in OK) — a middle-class / working-renter tenant base. Strengths: cost of living A+, housing A+, employment B; Watch: crime D-, amenities F, commute F.
- Duke (rural): math 25% / reading 25% proficiency, ranked #336 of 513 in OK (top 66%) — low school quality limits family demand, transient renter base, plan for 1-2y turnover.
- Zoned schools: Duke Es (math 12% / reading 22%, grade F, #540 of 845 statewide, top 68%, 97 students, 0% FRL); Duke Hs (math 24% / reading 24%, grade F, #150 of 447 statewide, top 48%, 53 students, 0% FRL) — zoned schools average 0% FRL vs 39% district-wide (39 pts lower); this property's tenant base skews higher-income than the district average.
- Market conditions: 6 active listings in the ZIP; 8 units permitted in Jackson County in 2024 (0 in 5+ unit buildings).
Forward outlook
- In year one you build about $5k of equity ($899 loan paydown + $4k appreciation (3.0% local appreciation)).
- Jackson County population projected to shrink 6% by 2050 — rents likely to lag national; underwrite the cash flow, not the appreciation.
- At projected returns (3.0% appreciation + 3.0% rent growth), your $36k cash investment doubles in ~7 years — after that, you're playing with house money.
- By year 7, paydown + projected appreciation supports a ~$30k cash-out refi (75% LTV) — recoverable capital for the next deal without selling this one.
Negotiation context
- It's been on market 34 days — a 3% lower offer ($126k) is reasonable based on typical stale-listing flexibility.
- Current owner paid $45k; list at $130k implies a 189% gain — meaningful room to come down on a strong offer.
Risks & watch-outs
- Climate carrying-cost: extreme-heat days projected 7→19/yr by 2055 (HVAC capex compounding) — expect insurance premiums to compound above CPI over the hold.
Questions for the listing agent
- What do current leases actually rent for vs. the listed asking? Can we see a recent rent roll and the last 12 months of T-12 income?
- It's been on market 34 days. Have you received any prior offers? Is the seller open to a 29% concession, seller financing, or rate buy-down credit?
- Built in 1970 — when were the roof, HVAC, electrical panel, plumbing, and water heater last replaced?
- Is there a deadline driving the sale (1031 exchange, divorce, estate, relocation)? That informs how much negotiation room exists.
- Schools are D-rated, which usually means shorter tenancies and higher turnover. Who's the typical renter profile here, and what's been the actual vacancy rate?
- Crime grade is D in this area — have there been break-ins, vandalism, or insurance claims at this property in the last 3 years? What carrier currently insures it and at what premium?
- The area grade is low — what's the realistic commute time and amenity access for the typical tenant pool here? Any planned neighborhood developments (good or bad) we should know about?
- What's the average days-on-market for RENTAL listings here right now (not sales)? A rising rental-DOM trend means longer vacancies and softer asking-rent achievability than the comps imply.
- What's the recent tenant-quality profile in this submarket — average credit score on applications, eviction rate, late-payment / NSF rate, and stable-employment percentage? A property-management company in the area should have these aggregated.
- How much new for-sale + rental construction is in the pipeline within 1–3 miles? Heavy new supply typically softens prices + rents 12–24 months out; constrained supply supports both.
Investment metrics
- 1% rule
- 0.71% ✗
- Cap rate
- 5.82%
- Cash-on-cash
- -1.70%
- DSCR
- 0.92
- GRM
- 11.8
CMA / ARV
- ARV (on-the-fly)
- $54,496
- Comps found
- 1
Show comp detail 1 sale within ~0.75 mi
| Address | Dist | Beds/Ba | Sqft | Sold | Price | $/sf | Match |
|---|---|---|---|---|---|---|---|
| 221 N Chicksaw Ave | 0.36mi | 2/1.0 (+1) | 1,002 (-4%) | 23mo | $52,500 | $52 | 52 |
Match score weights: distance 35% · size 25% · config 20% · recency 20%. Top-matched comps best support the ARV.
Projected returns pro-forma
3.0% appreciation · 3.0% rent growth · sell at horizon
- IRR
- 5.9%
- Equity multiple
- 1.34×
- Total profit
- $12,310
- Equity at exit
- $58,454
- IRR
- 8.8%
- Equity multiple
- 2.33×
- Total profit
- $48,371
- Equity at exit
- $90,084
Cash invested: $36,400 (down + closing). Projections, not guarantees.
Landlord ↔ Tenant lean methodology
- Overall (STATE)
- 83 Strongly Landlord-Friendly
- State Oklahoma
- 83 Strongly Landlord-Friendly · R+20
- County
- — inherits STATE
- City
- — inherits STATE
ZIP-level market 73532
- Active inventory
- 6
- Price-to-rent
- 11.8×
Monthly cashflow live
- Estimated rent
- $920 medium interval (Pro) →
- Mortgage (P&I)
- −$682
- Tax from tax record
- −$43 /mo · $512/yr
- Insurance
- −$54
- HOA
- −$0
- Vacancy / Maint / Mgmt
- −$193
- Net cashflow
- $-52
Break-even live
UW: 25.0% down · 7.5% · 30yr · 1.5% tax · 5.0% vac · 8.0% maint · 8.0% mgmt
Financing live
Cash to close
- Down payment
- $32,500
- Closing costs
- $3,900
- Reserves months
- —
- Total cash needed
- —
Loan-product check · same deal, 3 products live
Conventional
25% down · 7.5% · 30yr
- Down + closing
- —
- Monthly P&I
- —
- Monthly cashflow
- —
- DSCR
- —
- Eligible?
- —
Personal DTI + credit; lowest rate.
DSCR
20% down · 8.5% · 30yr
- Down + closing
- —
- Monthly P&I
- —
- Monthly cashflow
- —
- DSCR
- —
- Eligible?
- —
No personal income docs; deal must DSCR.
Hard money
10% down · 12.0% · 12mo
- Down + closing
- —
- Monthly P&I
- —
- Monthly cashflow
- —
- DSCR
- —
- Eligible?
- —
Short-term bridge; refi at stabilization.
Listing history 16 events
-
2026-06-18days on market $130,000 Active 34 DOM
-
2026-06-17days on market $130,000 Active 33 DOM
-
2026-06-16days on market $130,000 Active 32 DOM
-
2026-06-15days on market $130,000 Active 31 DOM
-
2026-06-13days on market $130,000 Active 29 DOM
-
2026-06-12days on market $130,000 Active 28 DOM
-
2026-06-09days on market $130,000 Active 25 DOM
-
2026-06-08days on market $130,000 Active 24 DOM
-
2026-06-08days on market $130,000 Active 23 DOM
-
2026-06-05days on market $130,000 Active 21 DOM
-
2026-06-04days on market $130,000 Active 19 DOM
-
2026-06-02days on market $130,000 Active 18 DOM
-
2026-06-01days on market $130,000 Active 17 DOM
-
2026-05-31days on market $130,000 Active 16 DOM
-
2026-05-15$130,000 Active
-
2009-01-15soldstatus $45,000
ⓘ Source: listings_history table (triggers on properties + properties_extension) + one-shot
backfill from property_details.listing_events for pre-trigger history.
Tax reassessment forecast OK · Resets to sale price
- Current annual tax
- $512 · $43/mo
- Projected year-2 tax
- $1,170 · $98/mo
- Expected delta
- +$658/yr (+$55/mo · 128.5%)
ⓘ Screening estimate from a state-policy table — verify with the county assessor before closing.
Climate risk First Street
- Flood 1/10 Low FEMA zone X (unshaded) · 0% chance over 30 yrs
- Wildfire 1/10 Low
- Heat 7/10 Severe 7 d/yr ≥108°F today · 19 d/yr by 30 yrs out
- Wind 2/10 Low 4% chance of damaging wind over 30 yrs
- Air quality 1/10 Low 0 unhealthy d/yr today · 0 by 30 yrs out
Nearby sold comps map
Loading sold comps map…
Walkable amenities ~0.75 mi
Loading nearby amenities…
Taxation est. · year 1
- Rental income
- $11,041
- − Mortgage interest
- −$7,282
- − Property taxes
- −$512
- − Insurance
- −$650
- − Repairs & maintenance
- −$883
- − Management
- −$883
- − Depreciation
- −$3,782
- Taxable loss
- −$2,951
- Est. tax savings @ 24.0%
- +$708
- After-tax cash flow
- $88/yr
For passive investors: Depreciation is non-cash, so a rental often shows a tax loss while cash-flowing — sheltering income. Rental losses are passive: they offset passive income freely, and up to $25,000/yr can offset ordinary (W-2) income if you actively participate and your MAGI is under $100k (phasing out to $0 by $150k); unused losses carry forward. On sale, claimed depreciation is recaptured at up to 25%, and gains may owe capital-gains tax (a 1031 exchange can defer both). Figures are a year-1 estimate at your 24.0% rate — not tax advice; consult a CPA.
Schools (NCES district)
- District
- Duke
- NCES district ID
- 4010260
- Math proficiency
- 25% ▲ 5.00%
- Reading proficiency
- 25% ▼ -10.00%
- Median HH income
- $43,457
- Composite
- 24.47/100
- National rank
- #13083
- State rank
- #336 of 513 in OK
Livability — East Duke
- Score
- 61/100
- State rank
- #273
- US rank
- #17340
Category grades
Schools grade is shown separately in the Schools card above.
Census & demographics
- Census place
- East Duke, OK
- Population (ZIP)
- 421
Population outlook (Jackson County) Hauer SSP2
- Today (2025)
- 24,084 people
- By 2030
- 23,476 · -2.5%
- By 2040
- 22,731 · -5.6%
- By 2050
- 22,586 · -6.2%
- By 2075
- 25,413 · +5.5%
- By 2100
- 31,069 · +29.0%
Race, ethnicity, and origin ACS 2023
- Neighborhood character
- Predominantly White (85%)
- Race & ethnicity
- White 85% Hispanic / Latino 7% Two or more races 6% Native American 3%
- Hispanic origin (detail)
- Mexican 6%
- Common ancestry
- Italian 3% Lithuanian 1% Scottish 1%
- Foreign-born
- 1%
- Languages at home
- 97% English-only · Spanish 1% German/W. Germanic 1%
Political lean MEDSL · Jackson
- 2024 margin
- Solid R (+58.3) · D 19.9% · R 78.2% · Other 1.9%
- 2008→2024 swing
- -8.7pp toward R · 2008: -49.6pp · 2024: -58.3pp
- All cycles
- 2024: R+58.3 2020: R+57.7 2016: R+57.6 2012: R+50.7 2008: R+49.6
Not yet ingested
- Civics
- —
Market trends
- HPI YoY
- —
- Current HPI
- —
- Rent YoY
- —
- Metro
- —
- State GDP YoY
- ▲ 1.55%
- F500 in state
- 6
Industry mix (Fortune 500 HQ in OK)
| Industry | F500 HQs | Revenue |
|---|---|---|
| Energy | 3 | $48B |
|
||
Price history
+188.9% since first listed2 events — show timeline
- 2026-05-15 Listed $130,000 MLSOK
- 2009-01-15 Sold (Public Records) $45,000 Public Records
Property tax history
+2.4%/yrLatest (2025): $512 · +9.9% YoY. Source: county tax records.
Cash-flow waterfall
monthlySold comps — $/sqft
last 12 mo · ≤1 miLoading sold comps…