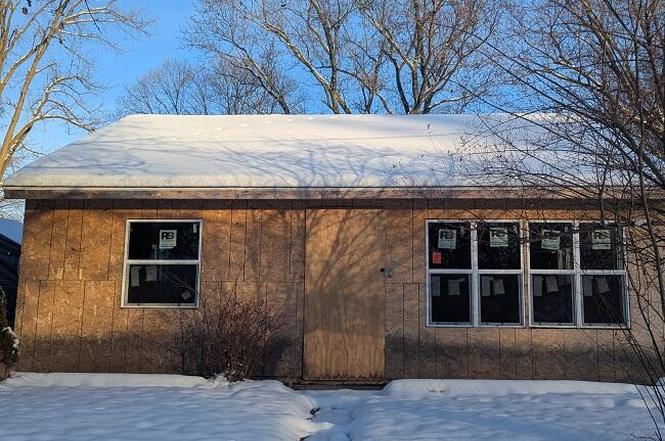
1706 Robertson Ave · Lansing, MI
Flood risk 1/10 · Minimal
- FEMA flood zone
- X (unshaded)
- Chance of flooding over 30 yrs
- 0.0%
- Est. flood insurance / yr
- $507 – $1,088
Fire risk 1/10 · Minimal
- Est. fire insurance / yr
- $784 – $1,456
Heat risk 2/10 · Minimal
- Hot days now (above 97°F)
- 7 days/yr
- Hot days in 30 yrs
- 16 days/yr
Wind risk 2/10 · Minimal
- Chance of severe wind over 30 yrs
- —
Air-quality risk 2/10 · Minimal
- Unhealthy air days now
- 1 days/yr
- Unhealthy air days in 30 yrs
- 2 days/yr
Risk factors via First Street. Map © Google.
Why this score? — see what drove the B- grade
The composite is a weighted blend of 9 inputs, each scored 0–100. Each bar is that input's sub-score; the figure is the points it added to the 100-point composite (weight × sub-score).
- Cash flow +30.0/30.0
- 1% rule +10.0/10.0
- DSCR +10.0/10.0
- ARV discount +7.5/15.0
- Livability +4.0/5.0
- Rent growth +2.5/5.0
- Condition / age +2.5/5.0
- Schools +1.9/10.0
- Appreciation +0.0/10.0
$29,900
🖨 Deal sheet (PDF) 📄 Offer letter ✓ Due diligence
Listing remarks MLS
Property is in need of full interior rehabbing. Property has potential. Large fenced in backyard.
Key facts
- 6,098 sq ft lot
- Built 1949
- Listed 70 days
Tags
Neighborhood map
What this means for you Summary
Snapshot
- This is a 2-bed/1.0-bath single-family listed at $30k.
Deal economics
- At list price, monthly cash flow is $731 ($9k/yr) — positive.
- The deal already cash-flows at list — no discount required.
- Meets the 1% rule at list price ($1k rent vs $30k).
- Recommended offer: $28k (6.0% below list) — sets the bar for market timing.
- Cap rate 35.6% vs local median 6.0% in Lansing — top-decile yield for the area; either an underpriced asset or a hidden risk that comps aren't pricing in. Stress-test before assuming the spread holds.
Location & tenants
- Location reads 79/100 on livability (#94 in MI, #2,182 nationally) — a middle-class / working-renter tenant base. Strengths: amenities A+, commute A+, cost of living A+; Watch: employment D, crime F.
- Lansing Public School District (urban): math 14% / reading 23% proficiency, ranked #650 of 760 in MI (top 86%) — low school quality limits family demand, transient renter base, plan for 1-2y turnover; 68% free/reduced lunch — lower-income household profile, screen leases tightly.
- Zoned schools: Pattengill School (600 students, 88% FRL) — zoned schools average 88% FRL vs 68% district-wide (21 pts higher); higher-poverty schools than district average — tighter screening recommended.
- Market conditions: 67 active listings in the ZIP; 9 comparable units currently listed for rent nearby; rentals lingering (median 46d on market — plan ~5-8 weeks vacancy on turnover, expect pricing pressure); 56% of comp listings sitting > 30 days — soft ceiling on asking rent; 350 units permitted in Ingham County in 2024 (186 in 5+ unit buildings).
Forward outlook
- Local home prices are declining (-3.0%/yr); year-one equity from $207 of loan paydown is wiped out by about $897 of value loss. Plan a longer hold.
- Ingham County population projected at +11% by 2050 — modest demand growth; plan on rents tracking national, not racing it.
- At projected returns (-3.0% appreciation + 3.0% rent growth), your $8k cash investment doubles in ~2 years — after that, you're playing with house money.
Negotiation context
- It's been on market 70 days — a 6% lower offer ($28k) is reasonable based on typical stale-listing flexibility.
- 6 sale attempts since 12y ago; this cycle's ask has dropped $10k (25%) from the opening price — seller is motivated, your offer sets the floor, not the list.
- Current owner paid $7k; list at $30k implies a 327% gain — meaningful room to come down on a strong offer.
Risks & watch-outs
- Watch-outs: built in 1949 — expect roof / HVAC / electrical / plumbing capex.
Questions for the listing agent
- It's been on market 70 days. Have you received any prior offers? Is the seller open to a 6% concession, seller financing, or rate buy-down credit?
- Built in 1949 — when were the roof, HVAC, electrical panel, plumbing, and water heater last replaced?
- Why hasn't it sold? Are there any deal-killer items the seller is aware of (foundation, flood, title, zoning, code violations)?
- Is there a deadline driving the sale (1031 exchange, divorce, estate, relocation)? That informs how much negotiation room exists.
- Schools are F-rated, which usually means shorter tenancies and higher turnover. Who's the typical renter profile here, and what's been the actual vacancy rate?
- Crime grade is F in this area — have there been break-ins, vandalism, or insurance claims at this property in the last 3 years? What carrier currently insures it and at what premium?
- What's the average days-on-market for RENTAL listings here right now (not sales)? A rising rental-DOM trend means longer vacancies and softer asking-rent achievability than the comps imply.
- What's the recent tenant-quality profile in this submarket — average credit score on applications, eviction rate, late-payment / NSF rate, and stable-employment percentage? A property-management company in the area should have these aggregated.
- How much new for-sale + rental construction is in the pipeline within 1–3 miles? Heavy new supply typically softens prices + rents 12–24 months out; constrained supply supports both.
Investment metrics
- 1% rule
- 3.97% ✓
- Cap rate
- 35.65%
- Cash-on-cash
- 104.84%
- DSCR
- 5.66
- GRM
- 2.1
CMA / ARV
- ARV (on-the-fly)
- $159,210
- Comps found
- 12
Show comp detail 12 sales within ~0.75 mi
| Address | Dist | Beds/Ba | Sqft | Sold | Price | $/sf | Match |
|---|---|---|---|---|---|---|---|
| 508 Filley St | 0.69mi | 2/1.0 | 1,312 (+0%) | 4mo | $160,000 | $122 | 63 |
| 1043 Ontario St | 0.31mi | 3/1.0 (+1) | 1,152 (-12%) | 2mo | $54,900 | $48 | 59 |
| 1900 Kaplan St | 0.58mi | 2/1.5 | 1,211 (-7%) | 4mo | $175,000 | $145 | 56 |
| 1145 N Martin Luther King Junior Blvd | 0.49mi | 3/2.0 (+1) | 1,235 (-5%) | 7mo | $160,000 | $130 | 54 |
| 908 Clyde St | 0.71mi | 2/1.0 | 1,222 (-6%) | 3mo | $138,000 | $113 | 53 |
| 1320 Glenrose Ave | 0.38mi | 3/1.0 (+1) | 1,144 (-12%) | 6mo | $23,000 | $20 | 52 |
| 920 Clyde St | 0.69mi | 3/1.5 (+1) | 1,204 (-8%) | 2mo | $170,000 | $141 | 47 |
| 1515 Biltmore Blvd | 0.73mi | 3/1.5 (+1) | 1,165 (-11%) | 2mo | $175,000 | $150 | 39 |
| 419 Filley St | 0.72mi | 3/1.5 (+1) | 1,152 (-12%) | 3mo | $156,000 | $135 | 37 |
| 1840 W Maple St | 0.70mi | 3/1.0 (+1) | 1,463 (+12%) | 7mo | $175,000 | $120 | 36 |
| 919 Princeton Ave | 0.71mi | 3/1.5 (+1) | 1,119 (-14%) | 2mo | $60,000 | $54 | 35 |
| 624 Brook St | 0.74mi | 3/1.5 (+1) | 1,144 (-12%) | 6mo | $120,000 | $105 | 33 |
Match score weights: distance 35% · size 25% · config 20% · recency 20%. Top-matched comps best support the ARV.
Projected returns pro-forma
-3.0% appreciation · 3.0% rent growth · sell at horizon
- IRR
- —
- Equity multiple
- 5.99×
- Total profit
- $41,756
- Equity at exit
- $4,458
- IRR
- —
- Equity multiple
- 12.52×
- Total profit
- $96,417
- Equity at exit
- $2,585
Cash invested: $8,372 (down + closing). Projections, not guarantees.
Landlord ↔ Tenant lean methodology
- Overall (STATE)
- 62 Landlord-Friendly
- State Michigan
- 62 Landlord-Friendly · EVEN
- County
- — inherits STATE
- City
- — inherits STATE
ZIP-level market 48915
- Active inventory
- 67
- Price-to-rent
- 2.1×
Monthly cashflow live
- Estimated rent
- $1,187 high interval (Pro) →
- Mortgage (P&I)
- −$157
- Tax est. 1.5%
- −$37 /mo · $448/yr
- Insurance
- −$12
- HOA
- −$0
- Vacancy / Maint / Mgmt
- −$249
- Net cashflow
- $731
Break-even live
Sensitivity live
| Price | -10% $752 | -5% $742 | +0% $731 | +5% $721 | +10% $711 |
|---|---|---|---|---|---|
| Rent | -10% $638 | -5% $685 | +0% $731 | +5% $778 | +10% $825 |
| Rate | -1.0pp $746 | -0.5pp $739 | base $731 | +0.5pp $724 | +1.0pp $716 |
UW: 25.0% down · 7.5% · 30yr · 1.5% tax · 5.0% vac · 8.0% maint · 8.0% mgmt
Financing live
Cash to close
- Down payment
- $7,475
- Closing costs
- $897
- Reserves months
- —
- Total cash needed
- —
Loan-product check · same deal, 3 products live
Conventional
25% down · 7.5% · 30yr
- Down + closing
- —
- Monthly P&I
- —
- Monthly cashflow
- —
- DSCR
- —
- Eligible?
- —
Personal DTI + credit; lowest rate.
DSCR
20% down · 8.5% · 30yr
- Down + closing
- —
- Monthly P&I
- —
- Monthly cashflow
- —
- DSCR
- —
- Eligible?
- —
No personal income docs; deal must DSCR.
Hard money
10% down · 12.0% · 12mo
- Down + closing
- —
- Monthly P&I
- —
- Monthly cashflow
- —
- DSCR
- —
- Eligible?
- —
Short-term bridge; refi at stabilization.
Rent comps 9 comps
| Address | Beds | Baths | Sqft | Rent | $/sqft | DOM | Units | Dist |
|---|---|---|---|---|---|---|---|---|
| 919 Princeton Ave Lansing, MI | 3.0 | 1.5 | 1119 | $1,475 | $1.32 | 23d | 1 | 0.69mi |
| 731 N Sycamore St Unit 1 Lansing, MI | 2.0 | 1.0 | 950 | $945 | $0.99 | 45d | 1 | 0.91mi |
| 712 N Sycamore St Lansing, MI | 3.0 | 1.0 | 1100 | $1,650 | $1.50 | 23d | 1 | 0.95mi |
| 610 N Sycamore St Unit 1 Lansing, MI | 1.0 | 1.0 | 900 | $875 | $0.97 | 15d | 1 | 1.02mi |
| 323 W Saginaw St Unit 1 Lansing, MI | 1.0 | 1.0 | 1000 | $1,000 | $1.00 | 45d | 1 | 1.12mi |
| 524 N Walnut St Lansing, MI | 2.0 | 1.0 | 1000 | $1,150 | $1.15 | 45d | 1 | 1.18mi |
| 433 Seymour Ave Unit 3 Lansing, MI | 3.0 | 1.0 | 1250 | $1,395 | $1.12 | 45d | 1 | 1.27mi |
| 832 N Larch St Apt 3 Lansing, MI | 2.0 | 1.0 | 890 | $1,095 | $1.23 | 45d | 1 | 1.46mi |
| 4515 N Grand River Ave Lansing, MI | 1.0–2.0 | 1.0 | 712 | $1,095 | $1.54 | 15d | 1 | 1.46mi |
Listing history 16 events
-
2026-03-05status Pending 97-char remark
Show marketing remark (97 chars)
Property is in need of full interior rehabbing. Property has potential. Large fenced in backyard.
-
2026-03-05status Pending 97-char remark
Show marketing remark (97 chars)
Property is in need of full interior rehabbing. Property has potential. Large fenced in backyard.
-
2026-03-05status Pending
Show marketing remark (97 chars)
Property is in need of full interior rehabbing. Property has potential. Large fenced in backyard.
-
2026-02-09price $29,900 97-char remark
Show marketing remark (97 chars)
Property is in need of full interior rehabbing. Property has potential. Large fenced in backyard.
-
2026-02-09price $29,900 97-char remark
Show marketing remark (97 chars)
Property is in need of full interior rehabbing. Property has potential. Large fenced in backyard.
-
2026-02-09price $29,900
Show marketing remark (97 chars)
Property is in need of full interior rehabbing. Property has potential. Large fenced in backyard.
-
2025-12-23$39,900 Active 97-char remark
Show marketing remark (97 chars)
Property is in need of full interior rehabbing. Property has potential. Large fenced in backyard.
-
2025-12-23$39,900 Active 97-char remark
Show marketing remark (97 chars)
Property is in need of full interior rehabbing. Property has potential. Large fenced in backyard.
-
2025-12-23$39,900 Active
Show marketing remark (97 chars)
Property is in need of full interior rehabbing. Property has potential. Large fenced in backyard.
-
2018-08-22historical
-
2018-08-22historical
-
2018-07-11$55,000
-
2018-07-11$55,000
-
2014-07-08soldstatus $7,000
-
2014-05-14$9,900
-
2003-07-28soldstatus $81,885
ⓘ Source: listings_history table (triggers on properties + properties_extension) + one-shot
backfill from property_details.listing_events for pre-trigger history.
Climate risk First Street
- Flood 1/10 Low FEMA zone X (unshaded) · 0% chance over 30 yrs
- Wildfire 1/10 Low
- Heat 2/10 Low 7 d/yr ≥97°F today · 16 d/yr by 30 yrs out
- Wind 2/10 Low
- Air quality 2/10 Low 1 unhealthy d/yr today · 2 by 30 yrs out
Nearby sold comps map
Loading sold comps map…
Walkable amenities ~0.75 mi
Loading nearby amenities…
Taxation est. · year 1
- Rental income
- $14,249
- − Mortgage interest
- −$1,675
- − Property taxes
- −$448
- − Insurance
- −$150
- − Repairs & maintenance
- −$1,140
- − Management
- −$1,140
- − Depreciation
- −$870
- Taxable income
- $8,826
- Est. tax owed @ 24.0%
- −$2,118
- After-tax cash flow
- $6,659/yr
For passive investors: Depreciation is non-cash, so a rental often shows a tax loss while cash-flowing — sheltering income. Rental losses are passive: they offset passive income freely, and up to $25,000/yr can offset ordinary (W-2) income if you actively participate and your MAGI is under $100k (phasing out to $0 by $150k); unused losses carry forward. On sale, claimed depreciation is recaptured at up to 25%, and gains may owe capital-gains tax (a 1031 exchange can defer both). Figures are a year-1 estimate at your 24.0% rate — not tax advice; consult a CPA.
Schools (NCES district)
- District
- Lansing Public School District
- NCES district ID
- 2621150
- Math proficiency
- 14% ▲ 1.00%
- Reading proficiency
- 23% ▲ 3.00%
- Median HH income
- $37,453
- Composite
- 18.76/100
- National rank
- #14002
- State rank
- #650 of 760 in MI
Livability — Lansing
- Score
- 79/100
- State rank
- #94
- US rank
- #2182
Category grades
Schools grade is shown separately in the Schools card above.
Census & demographics
- Census place
- Lansing, MI
- County
- Ingham County · 237,052 people
- City population
- 161,269
- Metro
- Lansing-East Lansing, MI
- Population (ZIP)
- 9,428
- Household income
- $54,465
- Rent vs Own
- Severe rent burden
- 307.0
Population outlook (Ingham County) Hauer SSP2
- Today (2025)
- 300,362 people
- By 2030
- 307,808 · +2.5%
- By 2040
- 320,492 · +6.7%
- By 2050
- 333,223 · +10.9%
- By 2075
- 373,693 · +24.4%
- By 2100
- 392,021 · +30.5%
Race, ethnicity, and origin ACS 2023
- Neighborhood character
- Diverse neighborhood (Simpson 0.64)
- Race & ethnicity
- White 54% Black 24% Two or more races 13% Hispanic / Latino 13%
- Hispanic origin (detail)
- Mexican 10%
- Common ancestry
- Romanian 7% Lithuanian 2% Iranian 2%
- Foreign-born
- 5% · Canada, Philippines
- Languages at home
- 90% English-only · Spanish 7% Other Asian/Pacific 1% German/W. Germanic 1%
Political lean MEDSL · Ingham
- 2024 margin
- Strong D (+29.7) · D 63.9% · R 34.2% · Other 2.0%
- 2008→2024 swing
- -3.6pp toward R · 2008: 33.3pp · 2024: 29.7pp
- All cycles
- 2024: D+29.7 2020: D+32.2 2016: D+27.6 2012: D+27.9 2008: D+33.3
Not yet ingested
- Civics
- —
Market trends
- HPI YoY
- ▼ -129.90%
- Current HPI
- 177.0906
- Rent YoY
- —
- Metro
- Lansing-East Lansing, MI
- State GDP YoY
- ▲ 1.37%
- F500 in state
- 28
Industry mix (Fortune 500 HQ in MI)
| Industry | F500 HQs | Revenue |
|---|---|---|
| Automotive Parts | 3 | $48B |
|
||
| Automotive | 2 | $372B |
|
||
| Chemicals | 1 | $45B |
|
||
| Automotive Retail | 1 | $29B |
|
||
| Healthcare / Medical Devices | 1 | $23B |
|
||
| Automotive Technology | 1 | $20B |
|
||
Price history
-63.5% since first listed16 events — show timeline
- 2026-03-05 Pending — REALCOMP
- 2026-03-05 Pending — MiRealSource-MiMLS
- 2026-03-05 Pending — SW Michigan MLS
- 2026-02-09 Price Changed $29,900 MiRealSource-MiMLS
- 2026-02-09 Price Changed $29,900 REALCOMP
- 2026-02-09 Price Changed $29,900 SW Michigan MLS
- 2025-12-23 Listed $39,900 SW Michigan MLS
- 2025-12-23 Listed $39,900 MiRealSource-MiMLS
- 2025-12-23 Listed $39,900 REALCOMP
- 2018-08-22 Listing Removed — REALCOMP
- 2018-08-22 Listing Removed — Greater Lansing AoR
- 2018-07-11 Listed $55,000 REALCOMP
- 2018-07-11 Listed $55,000 Greater Lansing AoR
- 2014-07-08 Sold (MLS) $7,000 Greater Lansing AoR
- 2014-05-14 Listed $9,900 Greater Lansing AoR
- 2003-07-28 Sold (Public Records) $81,885 Public Records
Property tax history
+3.9%/yrLatest (2025): $2,705 · -59.4% YoY. Source: county tax records.
Cash-flow waterfall
monthlySold comps — $/sqft
last 12 mo · ≤1 miLoading sold comps…