18995 Cr-1102 · Noonday, TX
Flood risk 1/10 · Minimal
- FEMA flood zone
- X (unshaded)
- Chance of flooding over 30 yrs
- 0.0%
- Est. flood insurance / yr
- $507 – $1,088
Fire risk 5/10 · Moderate
- Est. fire insurance / yr
- $1,222 – $2,270
Heat risk 7/10 · Major
- Hot days now (above 109°F)
- 7 days/yr
- Hot days in 30 yrs
- 26 days/yr
Wind risk 6/10 · Moderate
- Chance of severe wind over 30 yrs
- 62.0%
Air-quality risk 1/10 · Minimal
- Unhealthy air days now
- 0 days/yr
- Unhealthy air days in 30 yrs
- 0 days/yr
Risk factors via First Street. Map © Google.
Why this score? — see what drove the B- grade
The composite is a weighted blend of 9 inputs, each scored 0–100. Each bar is that input's sub-score; the figure is the points it added to the 100-point composite (weight × sub-score).
- Cash flow +30.0/30.0
- 1% rule +10.0/10.0
- DSCR +10.0/10.0
- ARV discount +7.5/15.0
- Schools +3.3/10.0
- Livability +3.1/5.0
- Rent growth +2.5/5.0
- Condition / age +2.5/5.0
- Appreciation +0.0/10.0
$95,000
🖨 Deal sheet (PDF) 📄 Offer letter ✓ Due diligence
Listing remarks
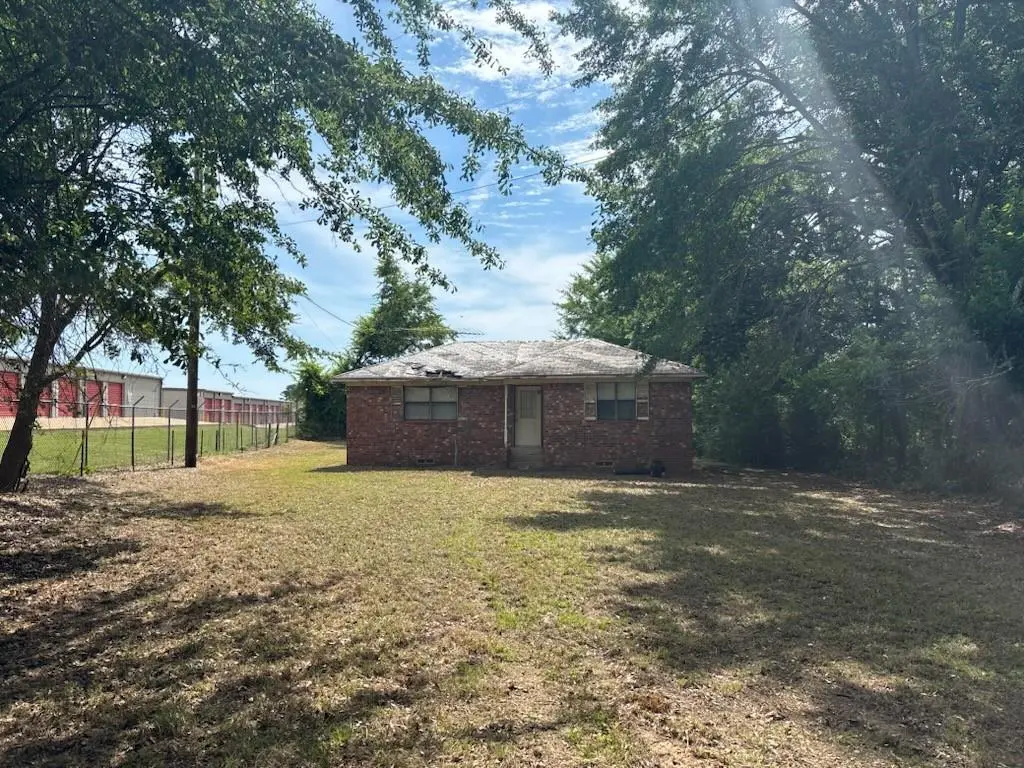
This property at 18995 County Road 1102 provides an opportunity for a new residential build in the Flint area. The site features a 0.5-acre lot, offering sufficient space for a custom home and outdoor improvements. Located within Smith County and the Tyler Independent School District, the parcel is situated near established residences and acreage properties. The sale includes the existing 837-square-foot structure and is being sold strictly as-is with no repairs or improvements provided by the seller. This location is well-suited for investors or builders looking to develop a new property from the ground up in an area with steady residential interest. Buyers are encouraged to verify utility
Key facts
- Existing structure
- Custom home
- 0.5-acre lot
Tags
Property features AI
Finance
- Other: Listing is active and offered For Sale; Possession at closing/funding; Listing agent: Lucian Galloway, White Line Realty LLC
- Financial info: Listing terms include Cash and Conventional; Treated as clear loan type; No second mortgage indicated
- HOA & community: No homeowners association
Exterior
- Parking: Driveway
- Utilities: Electricity available; Septic system; Well water; No municipal utility district
- Home design: Single-family residence; Residential property; Built in 1987; One story
- Construction: Year built 1987
- Exterior features: Approximately 0.91-acre lot; Lot will not be subdivided; Directions: Drive south from Tyler on State Hwy 155 S toward Flint; continue about 13.1 miles to County Road 1102
Interior
- Kitchen: No appliances included
- Bedrooms: Primary bedroom (10 x 12)
- Bathrooms: 1 full bathroom
- Interior features: One-level layout; Living area with one living area and one dining area; Other interior features
- Laundry & utility: No specific laundry appliances listed
Neighborhood map
What this means for you Summary
Snapshot
- This is a 3-bed/1.0-bath single-family listed at $95k.
Deal economics
- At list price, monthly cash flow is $645 ($8k/yr) — positive.
- The deal already cash-flows at list — no discount required.
- Meets the 1% rule at list price ($2k rent vs $95k).
- Recommended offer: $94k (1.5% below list) — sets the bar for market timing.
- Cap rate 14.4% vs local median 2.1% in Noonday — top-decile yield for the area; either an underpriced asset or a hidden risk that comps aren't pricing in. Stress-test before assuming the spread holds.
Location & tenants
- Location reads 62/100 on livability (#938 in TX) — a middle-class / working-renter tenant base. Strengths: cost of living A+, housing A; Watch: employment D+, amenities F, commute F.
- Tyler ISD (urban): math 39% / reading 38% proficiency, ranked #449 of 826 in TX (top 54%) — families likely to look elsewhere, expect single-tenant / working-renter base with shorter leases; 66% free/reduced lunch — lower-income household profile, screen leases tightly.
- Zoned schools: Owens El (math 49% / reading 58%, grade C, #686 of 4,322 statewide, top 16%, 665 students, 49% FRL) — zoned schools average 49% FRL vs 66% district-wide (17 pts lower); this property's tenant base skews higher-income than the district average.
- Zoned-school proficiency averages 54% at this address vs 38% district-wide (+15 pts) — the actual schools serving this property are materially stronger than the Tyler ISD average implies; a family-tenant draw the district grade alone would hide.
- Market conditions: 354 active listings in the ZIP; solid renter incomes; 595 units permitted in Smith County in 2024 (45 in 5+ unit buildings).
Forward outlook
- Local home prices are declining (-3.0%/yr); year-one equity from $657 of loan paydown is wiped out by about $3k of value loss. Plan a longer hold.
- Smith County population projected at +24% by 2050 — long-run rental-demand tailwind backs the buy-and-hold thesis.
- At projected returns (-3.0% appreciation + 3.0% rent growth), your $27k cash investment doubles in ~5 years — after that, you're playing with house money.
Negotiation context
- It's been on market 15 days — a 2% lower offer ($94k) is reasonable based on typical stale-listing flexibility.
Risks & watch-outs
- Climate carrying-cost: major wind risk, 62% chance of damaging wind over 30y; moderate wildfire risk; extreme-heat days projected 7→26/yr by 2055 (HVAC capex compounding) — expect insurance premiums to compound above CPI over the hold.
Questions for the listing agent
- Is there a deadline driving the sale (1031 exchange, divorce, estate, relocation)? That informs how much negotiation room exists.
- Schools are F-rated, which usually means shorter tenancies and higher turnover. Who's the typical renter profile here, and what's been the actual vacancy rate?
- What's the average days-on-market for RENTAL listings here right now (not sales)? A rising rental-DOM trend means longer vacancies and softer asking-rent achievability than the comps imply.
- What's the recent tenant-quality profile in this submarket — average credit score on applications, eviction rate, late-payment / NSF rate, and stable-employment percentage? A property-management company in the area should have these aggregated.
- How much new for-sale + rental construction is in the pipeline within 1–3 miles? Heavy new supply typically softens prices + rents 12–24 months out; constrained supply supports both.
Investment metrics
- 1% rule
- 1.74% ✓
- Cap rate
- 14.44%
- Cash-on-cash
- 29.10%
- DSCR
- 2.29
- GRM
- 4.8
CMA / ARV
No comps found within radius.
Projected returns pro-forma
-3.0% appreciation · 3.0% rent growth · sell at horizon
- IRR
- 23.5%
- Equity multiple
- 1.97×
- Total profit
- $25,721
- Equity at exit
- $14,165
- IRR
- 31.4%
- Equity multiple
- 3.84×
- Total profit
- $75,418
- Equity at exit
- $8,214
Cash invested: $26,600 (down + closing). Projections, not guarantees.
Landlord ↔ Tenant lean methodology
- Overall (STATE)
- 87 Strongly Landlord-Friendly
- State Texas
- 87 Strongly Landlord-Friendly · R+5
- County
- — inherits STATE
- City
- — inherits STATE
ZIP-level market 75762
- Home prices YoY
- -28.4%
- Active inventory
- 354
- Price-to-rent
- 4.8×
Monthly cashflow live
- Estimated rent
- $1,654 medium interval (Pro) →
- Mortgage (P&I)
- −$498
- Tax from tax record
- −$124 /mo · $1,489/yr
- Insurance
- −$40
- HOA
- −$0
- Vacancy / Maint / Mgmt
- −$347
- Net cashflow
- $645
Break-even live
Sensitivity live
| Price | -10% $699 | -5% $672 | +0% $645 | +5% $618 | +10% $591 |
|---|---|---|---|---|---|
| Rent | -10% $514 | -5% $580 | +0% $645 | +5% $710 | +10% $776 |
| Rate | -1.0pp $693 | -0.5pp $669 | base $645 | +0.5pp $620 | +1.0pp $595 |
UW: 25.0% down · 7.5% · 30yr · 1.5% tax · 5.0% vac · 8.0% maint · 8.0% mgmt
Financing live
Cash to close
- Down payment
- $23,750
- Closing costs
- $2,850
- Reserves months
- —
- Total cash needed
- —
Loan-product check · same deal, 3 products live
Conventional
25% down · 7.5% · 30yr
- Down + closing
- —
- Monthly P&I
- —
- Monthly cashflow
- —
- DSCR
- —
- Eligible?
- —
Personal DTI + credit; lowest rate.
DSCR
20% down · 8.5% · 30yr
- Down + closing
- —
- Monthly P&I
- —
- Monthly cashflow
- —
- DSCR
- —
- Eligible?
- —
No personal income docs; deal must DSCR.
Hard money
10% down · 12.0% · 12mo
- Down + closing
- —
- Monthly P&I
- —
- Monthly cashflow
- —
- DSCR
- —
- Eligible?
- —
Short-term bridge; refi at stabilization.
Listing history 13 events
-
2026-06-19days on market $95,000 Active 15 DOM
-
2026-06-18days on market $95,000 Active 14 DOM
-
2026-06-17days on market $95,000 Active 13 DOM
-
2026-06-16days on market $95,000 Active 12 DOM
-
2026-06-15days on market $95,000 Active 11 DOM
-
2026-06-14days on market $95,000 Active 9 DOM
-
2026-06-13days on market $95,000 Active 8 DOM
-
2026-06-10days on market $95,000 Active 6 DOM
-
2026-06-09days on market $95,000 Active 5 DOM
-
2026-06-08days on market $95,000 Active 4 DOM
-
2026-06-07days on market $95,000 Active 3 DOM
-
2026-06-05remarks 699-char remark
-
2026-06-05$95,000 Active 1 DOM
ⓘ Source: listings_history table (triggers on properties + properties_extension) + one-shot
backfill from property_details.listing_events for pre-trigger history.
Tax reassessment forecast TX · Resets to sale price
- Current annual tax
- $1,489 · $124/mo
- Projected year-2 tax
- $1,738 · $145/mo
- Expected delta
- +$250/yr (+$21/mo · 16.8%)
ⓘ Screening estimate from a state-policy table — verify with the county assessor before closing.
Climate risk First Street
- Flood 1/10 Low FEMA zone X (unshaded) · 0% chance over 30 yrs
- Wildfire 5/10 Major
- Heat 7/10 Severe 7 d/yr ≥109°F today · 26 d/yr by 30 yrs out
- Wind 6/10 Major 62% chance of damaging wind over 30 yrs
- Air quality 1/10 Low 0 unhealthy d/yr today · 0 by 30 yrs out
Nearby sold comps map
Loading sold comps map…
Walkable amenities ~0.75 mi
Loading nearby amenities…
Taxation est. · year 1
- Rental income
- $19,852
- − Mortgage interest
- −$5,321
- − Property taxes
- −$1,489
- − Insurance
- −$475
- − Repairs & maintenance
- −$1,588
- − Management
- −$1,588
- − Depreciation
- −$2,764
- Taxable income
- $6,627
- Est. tax owed @ 24.0%
- −$1,590
- After-tax cash flow
- $6,151/yr
For passive investors: Depreciation is non-cash, so a rental often shows a tax loss while cash-flowing — sheltering income. Rental losses are passive: they offset passive income freely, and up to $25,000/yr can offset ordinary (W-2) income if you actively participate and your MAGI is under $100k (phasing out to $0 by $150k); unused losses carry forward. On sale, claimed depreciation is recaptured at up to 25%, and gains may owe capital-gains tax (a 1031 exchange can defer both). Figures are a year-1 estimate at your 24.0% rate — not tax advice; consult a CPA.
Schools (NCES district)
- District
- Tyler ISD
- NCES district ID
- 4843470
- Math proficiency
- 39% ▼ -4.00%
- Reading proficiency
- 38% ▼ -1.00%
- Median HH income
- $44,090
- Composite
- 32.69/100
- National rank
- #5650
- State rank
- #449 of 826 in TX
Livability — Noonday
- Score
- 62/100
- State rank
- #938
- US rank
- #16671
Category grades
Schools grade is shown separately in the Schools card above.
Census & demographics
- County
- Smith County · 180,570 people
- Metro
- Tyler, TX
- Population (ZIP)
- 15,704
- Household income
- $90,057
- Rent vs Own
- Severe rent burden
- 98.0
Population outlook (Smith County) Hauer SSP2
- Today (2025)
- 248,890 people
- By 2030
- 261,665 · +5.1%
- By 2040
- 286,114 · +15.0%
- By 2050
- 308,006 · +23.8%
- By 2075
- 354,171 · +42.3%
- By 2100
- 372,828 · +49.8%
Race, ethnicity, and origin ACS 2023
- Neighborhood character
- Predominantly White (71%)
- Race & ethnicity
- White 71% Hispanic / Latino 16% Two or more races 13% Black 11%
- Hispanic origin (detail)
- Mexican 12%
- Common ancestry
- Iranian 2% Serbian 2% Portuguese 1%
- Foreign-born
- 5% · Canada
- Languages at home
- 85% English-only · Spanish 13%
Political lean MEDSL · Smith
- 2024 margin
- Solid R (+45.1) · D 27.0% · R 72.1%
- 2008→2024 swing
- -5.6pp toward R · 2008: -39.5pp · 2024: -45.1pp
- All cycles
- 2024: R+45.1 2020: R+39.4 2016: R+43.9 2012: R+46.9 2008: R+39.5
Not yet ingested
- Civics
- —
Market trends
- HPI YoY
- ▼ -78.39%
- Current HPI
- 197.2375
- Rent YoY
- —
- Metro
- Tyler, TX
- State GDP YoY
- ▲ 3.95%
- F500 in state
- 110
Industry mix (Fortune 500 HQ in TX)
| Industry | F500 HQs | Revenue |
|---|---|---|
| Energy | 16 | $1,198B |
|
||
| Technology | 5 | $198B |
|
||
| Engineering / Construction | 4 | $72B |
|
||
| Energy Services | 3 | $60B |
|
||
| Utilities | 3 | $41B |
|
||
| Healthcare | 2 | $330B |
|
||
Price history
6 events — show timeline
- 2026-06-04 Listed $95,000 NTREIS
- 2026-04-21 Sold (Public Records) — Public Records
- 2026-04-21 Sold (Public Records) — Public Records
- 2022-01-19 Sold (Public Records) — Public Records
- 2010-10-20 Sold (Public Records) — Public Records
- 1986-07-24 Sold (Public Records) — Public Records
Property tax history
+5.1%/yrLatest (2024): $1,489 · +12.9% YoY. Source: county tax records.
Cash-flow waterfall
monthlySold comps — $/sqft
last 12 mo · ≤1 miLoading sold comps…