 Triplex
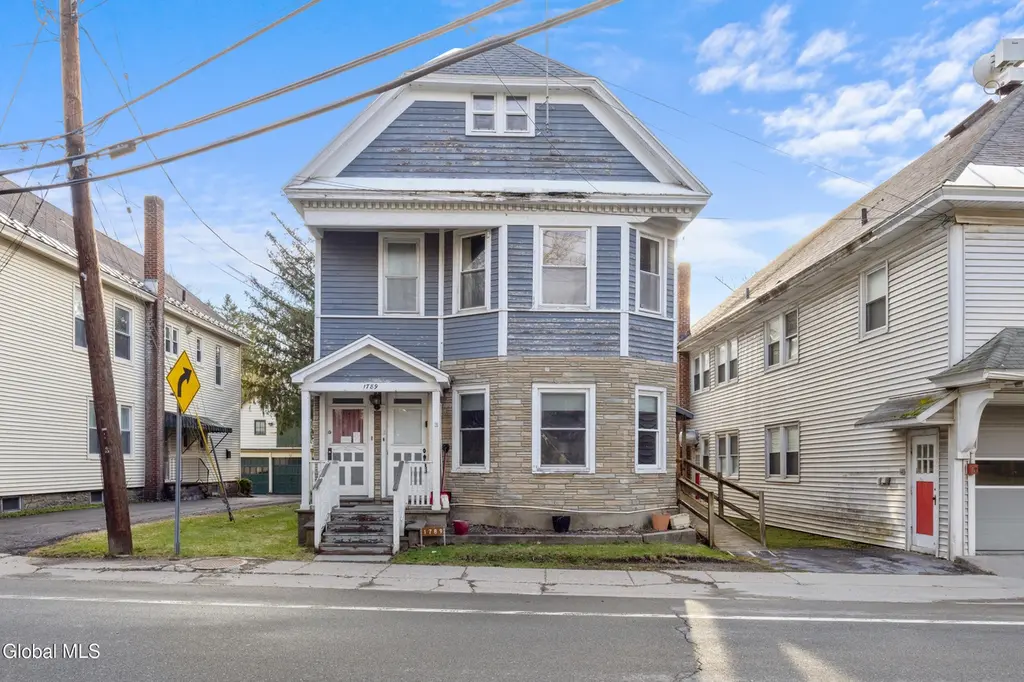
1789 Main St · Delanson, NY
Flood risk 9/10 · Severe
- FEMA flood zone
- A
- Chance of flooding over 30 yrs
- 0.99%
- Est. flood insurance / yr
- $946 – $6,584
Fire risk 3/10 · Minor
- Est. fire insurance / yr
- $691 – $1,283
Heat risk 3/10 · Minor
- Hot days now (above 93°F)
- 8 days/yr
- Hot days in 30 yrs
- 18 days/yr
Wind risk 2/10 · Minimal
- Chance of severe wind over 30 yrs
- 4.0%
Air-quality risk 1/10 · Minimal
- Unhealthy air days now
- 0 days/yr
- Unhealthy air days in 30 yrs
- 0 days/yr
Risk factors via First Street. Map © Google.
Why this score? — see what drove the B+ grade
The composite is a weighted blend of 9 inputs, each scored 0–100. Each bar is that input's sub-score; the figure is the points it added to the 100-point composite (weight × sub-score).
- Cash flow +28.0/30.0
- DSCR +10.0/10.0
- Appreciation +10.0/10.0
- 1% rule +7.7/10.0
- ARV discount +7.5/15.0
- Schools +5.6/10.0
- Livability +3.4/5.0
- Rent growth +2.5/5.0
- Condition / age +2.2/5.0
$235,000
🖨 Deal sheet 📄 Offer letter ✓ Due diligence
Multi-family units
County records classify this as Multi-Family (2-4 Unit). Listing-text estimate: 3 units. confirmed
Listing remarks MLS
-- Very Good Condition
Key facts
- Off street parking
- Village water
- Separately metered
Tags
Property features AI
Finance
- Other: Fuel tank(s) present
- Financial info: Property configured as a 3-unit multifamily; Maintenance expense listed; Tenants pay trash collection, hot water, heat, and electricity; Owner pays trash collection, sewer, snow removal, water, and grounds care
Exterior
- Parking: Off-street parking for 4 vehicles; Stone parking surface
- Security: Smoke detector(s); Carbon monoxide detector(s)
- Utilities: Public water; Public sewer; 100 amp electric service with circuit breakers
- Home design: Triplex; Facing direction not specified; Entry level details not specified
- Construction: Clapboard and shingle siding with drywall interior; Asphalt roof; Pillar/post/pier and stone foundation; Year built not specified
- Exterior features: Covered rear porch; Porch; Level, cleared lot with road frontage
Interior
- Kitchen: Each unit includes a kitchen
- Bedrooms: Unit 1: 1 bedroom on the 1st floor; Unit 2: 2 bedrooms; Unit 3: 2 bedrooms on the 1st floor
- Flooring: Hardwood; Vinyl; Carpet
- Bathrooms: 3 full bathrooms total; Full baths located on 1st and 2nd floors
- Heating & cooling: Forced air heating; Propane fuel
- Interior features: Built-in features; Double-pane windows; Bay window(s)
- Laundry & utility: Washer hookup; Electric dryer hookup; Main level and upper level laundry access
Neighborhood map
What this means for you Summary
Snapshot
- This is a 1×1bd/1ba + 2×2bd/1ba units multifamily listed at $235k. Condition is rated fair.
Deal economics
- At list price, monthly cash flow is $420 ($5k/yr) — positive. Per door: $140/mo.
- The deal already cash-flows at list — no discount required.
- Meets the 1% rule at list price ($3k rent vs $235k).
- Recommended offer: $228k (3.0% below list) — sets the bar for market timing.
Location & tenants
- Location reads 67/100 on livability (#601 in NY) — a middle-class / working-renter tenant base. Strengths: employment A+, housing A+, schools A-; Watch: crime D-, amenities F, commute F.
- Duanesburg Central School District (rural): math 54% / reading 71% proficiency, ranked #176 of 590 in NY (top 30%) — acceptable for families but not a draw, mixed tenant base, ~2y average lease.
- Market conditions: 49 active listings in the ZIP; 154 units permitted in Schenectady County in 2024 (54 in 5+ unit buildings).
Forward outlook
- In year one you build about $25k of equity ($2k loan paydown + $24k appreciation (10.0% local appreciation)).
- Schenectady County population projected to shrink 4% by 2050 — rents likely to lag national; underwrite the cash flow, not the appreciation.
- At projected returns (10.0% appreciation + 3.0% rent growth), your $66k cash investment doubles in ~3 years — after that, you're playing with house money.
- By year 2, paydown + projected appreciation supports a ~$40k cash-out refi (75% LTV) — recoverable capital for the next deal without selling this one.
Negotiation context
- It's been on market 31 days — a 3% lower offer ($228k) is reasonable based on typical stale-listing flexibility.
- 2 sale attempts since 23y ago with the ask held roughly flat each time — persistent listings suggest the price (not the market) is what's stuck; bring a comps-based counter.
- Current owner paid $122k; list at $235k implies a 93% gain — meaningful room to come down on a strong offer.
Risks & watch-outs
- Watch-outs: flood insurance adds $314/mo; built in 1920 — expect roof / HVAC / electrical / plumbing capex.
- Climate carrying-cost: in FEMA flood zone A (mandatory federal flood insurance) — expect insurance premiums to compound above CPI over the hold.
Questions for the listing agent
- It's been on market 31 days. Have you received any prior offers? Is the seller open to a 3% concession, seller financing, or rate buy-down credit?
- Can we see the unit-by-unit rent roll, current vacancy, and any below-market leases? What's the average tenancy length?
- What capital expenditures (roof, boiler, parking lot, exteriors) have been made in the last 5 years, and what's planned in the next 2?
- Have any recent inspections been done? Can we get a copy of the seller's disclosures and any deferred-maintenance estimates?
- Built in 1920 — when were the roof, HVAC, electrical panel, plumbing, and water heater last replaced?
- What's the actual annual flood-insurance premium (NFIP or private), and is the property in a SFHA with mandatory coverage?
- Is there a deadline driving the sale (1031 exchange, divorce, estate, relocation)? That informs how much negotiation room exists.
- Schools are A-rated — typically a magnet for longer-tenancy family renters. What's the average tenant stay here, and is there a school-zone premium baked into asking?
- Crime grade is D in this area — have there been break-ins, vandalism, or insurance claims at this property in the last 3 years? What carrier currently insures it and at what premium?
- What's the average days-on-market for RENTAL listings here right now (not sales)? A rising rental-DOM trend means longer vacancies and softer asking-rent achievability than the comps imply.
- What's the recent tenant-quality profile in this submarket — average credit score on applications, eviction rate, late-payment / NSF rate, and stable-employment percentage? A property-management company in the area should have these aggregated.
- How much new apartment / multifamily construction is in the pipeline within 1–3 miles? Heavy new supply (>2% of stock underway) typically softens rents 12–24 months out; light construction supports rent growth.
Investment metrics
- 1% rule
- 1.27% ✓
- Cap rate
- 10.04%
- Cash-on-cash
- 13.37%
- DSCR
- 1.60
- GRM
- 6.6
CMA / ARV
No comps found within radius.
Projected returns pro-forma
10.0% appreciation · 3.0% rent growth · sell at horizon
- IRR
- 29.9%
- Equity multiple
- 3.35×
- Total profit
- $154,948
- Equity at exit
- $211,707
- IRR
- 25.9%
- Equity multiple
- 7.62×
- Total profit
- $435,755
- Equity at exit
- $456,553
Cash invested: $65,800 (down + closing). Projections, not guarantees.
Landlord ↔ Tenant lean methodology
- Overall (STATE)
- 15 Strongly Tenant-Friendly
- State New York
- 15 Strongly Tenant-Friendly · D+10
- County
- — inherits STATE
- City
- — inherits STATE
ZIP-level market 12053
- Home prices YoY
- 7.1%
- Active inventory
- 49
- Price-to-rent
- 21.3×
Monthly cashflow live
- Estimated rent
- $2,984 medium interval (Pro) →
- Mortgage (P&I)
- −$1,232
- Tax est. 1.5%
- −$294 /mo · $3,525/yr
- Insurance
- −$98
- Flood insurance flood zone
- −$314 /mo · $3,765/yr
- HOA
- −$0
- Vacancy / Maint / Mgmt
- −$627
- Net cashflow
- $420
Break-even live
3-unit breakdown (identical units grouped — click to expand)
| Units | Beds | Baths | Est. rent |
|---|---|---|---|
| 1× unit | 1 | 1 | $918 |
| 2× units | 2 | 1 | $2,066 |
| #2 | 2 | 1 | $1,033 |
| #3 | 2 | 1 | $1,033 |
| Total (3 units) | $2,984 | ||
UW: 25.0% down · 7.5% · 30yr · 1.5% tax · 5.0% vac · 8.0% maint · 8.0% mgmt
Financing live
Cash to close
- Down payment
- $58,750
- Closing costs
- $7,050
- Reserves months
- —
- Total cash needed
- —
Loan-product check · same deal, 3 products live
Conventional
25% down · 7.5% · 30yr
- Down + closing
- —
- Monthly P&I
- —
- Monthly cashflow
- —
- DSCR
- —
- Eligible?
- —
Personal DTI + credit; lowest rate.
DSCR
20% down · 8.5% · 30yr
- Down + closing
- —
- Monthly P&I
- —
- Monthly cashflow
- —
- DSCR
- —
- Eligible?
- —
No personal income docs; deal must DSCR.
Hard money
10% down · 12.0% · 12mo
- Down + closing
- —
- Monthly P&I
- —
- Monthly cashflow
- —
- DSCR
- —
- Eligible?
- —
Short-term bridge; refi at stabilization.
Listing history 20 events
-
2026-06-18days on market $235,000 Active 31 DOM
-
2026-06-17days on market $235,000 Active 30 DOM
-
2026-06-16days on market $235,000 Active 29 DOM
-
2026-06-15days on market $235,000 Active 28 DOM
-
2026-06-14days on market $235,000 Active 26 DOM
-
2026-06-13days on market $235,000 Active 25 DOM
-
2026-06-10days on market $235,000 Active 23 DOM
-
2026-06-09days on market $235,000 Active 22 DOM
-
2026-06-08days on market $235,000 Active 21 DOM
-
2026-06-07remarks 592-char remark
-
2026-06-07pricedays on market $235,000 Active 20 DOM
-
2026-06-03days on market $239,000 Active 16 DOM
-
2026-06-02days on market $239,000 Active 15 DOM
-
2026-06-01days on market $239,000 Active 14 DOM
-
2026-05-31days on market $239,000 Active 13 DOM
-
2026-05-31days on market $239,000 Active 12 DOM
-
2026-04-30status Pending
-
2026-04-21$239,000 Active
-
2003-09-29soldstatus $122,000 22-char remark
Show marketing remark (22 chars)
-- Very Good Condition
-
2003-06-13$119,000 22-char remark
Show marketing remark (22 chars)
-- Very Good Condition
ⓘ Source: listings_history table (triggers on properties + properties_extension) + one-shot
backfill from property_details.listing_events for pre-trigger history.
Climate risk First Street
- Flood 9/10 Extreme FEMA zone A · 99% chance over 30 yrs
- Wildfire 3/10 Moderate
- Heat 3/10 Moderate 8 d/yr ≥93°F today · 18 d/yr by 30 yrs out
- Wind 2/10 Low 4% chance of damaging wind over 30 yrs
- Air quality 1/10 Low 0 unhealthy d/yr today · 0 by 30 yrs out
Nearby sold comps map
Loading sold comps map…
Walkable amenities ~0.75 mi
Loading nearby amenities…
Taxation est. · year 1
- Rental income
- $35,808
- − Mortgage interest
- −$13,164
- − Property taxes
- −$3,525
- − Insurance
- −$4,940
- − Repairs & maintenance
- −$2,865
- − Management
- −$2,865
- − Depreciation
- −$6,836
- Taxable income
- $1,614
- Est. tax owed @ 24.0%
- −$387
- After-tax cash flow
- $4,648/yr
For passive investors: Depreciation is non-cash, so a rental often shows a tax loss while cash-flowing — sheltering income. Rental losses are passive: they offset passive income freely, and up to $25,000/yr can offset ordinary (W-2) income if you actively participate and your MAGI is under $100k (phasing out to $0 by $150k); unused losses carry forward. On sale, claimed depreciation is recaptured at up to 25%, and gains may owe capital-gains tax (a 1031 exchange can defer both). Figures are a year-1 estimate at your 24.0% rate — not tax advice; consult a CPA.
Condition & rehab AI · 12 photos
This 3-family dwelling requires moderate renovations to improve its condition and increase its value.
Repairs flagged
- Major Exterior siding — Weathered and peeling
- Major Kitchen — No photos of kitchen
- Moderate Bathrooms — Appears dated and in need of updates
- Moderate Flooring — Worn and in need of replacement
- Moderate Paint — Chipped in some areas
- Moderate HVAC/mechanicals — No photos of HVAC/mechanicals
Value-add opportunities
- Both Painting and updating bathrooms — Improves appearance and functionality
- Both Replacing worn flooring — Enhances comfort and value
- Both Upgrading HVAC/mechanicals — Improves comfort and energy efficiency
Renovation cost estimate screening
| Repair item | Severity | Est. cost |
|---|---|---|
| Exterior siding · Weathered and peeling | Major | $15,000–50,000 |
| Kitchen · No photos of kitchen | Major | $15,000–50,000 |
| Bathrooms · Appears dated and in need of updates | Moderate | $3,000–15,000 |
| Flooring · Worn and in need of replacement | Moderate | $3,000–15,000 |
| Paint · Chipped in some areas | Moderate | $3,000–15,000 |
| HVAC/mechanicals · No photos of HVAC/mechanicals | Moderate | $3,000–15,000 |
| Total estimated repair cost · 6 items | $42,000–160,000 |
Value-add ROI direction
- Both Painting and updating bathrooms — Improves appearance and functionality ↑
- Both Replacing worn flooring — Enhances comfort and value ↑
- Both Upgrading HVAC/mechanicals — Improves comfort and energy efficiency ↑
ⓘ Cost ranges are severity-bucket heuristics (US national rule-of-thumb). Get contractor quotes + a written scope before underwriting a rehab budget.
Schools (NCES district)
- District
- Duanesburg Central School District
- NCES district ID
- 3609360
- Math proficiency
- 54% ▼ -6.00%
- Reading proficiency
- 71% ▲ 9.00%
- Median HH income
- $76,847
- Composite
- 55.65/100
- National rank
- #1227
- State rank
- #176 of 590 in NY
Livability — Delanson
- Score
- 67/100
- State rank
- #601
- US rank
- #10899
Category grades
Schools grade is shown separately in the Schools card above.
Census & demographics
- Census place
- Delanson, NY
- Population (ZIP)
- 4,325
Population outlook (Schenectady County) Hauer SSP2
- Today (2025)
- 155,046 people
- By 2030
- 154,322 · -0.5%
- By 2040
- 151,796 · -2.1%
- By 2050
- 148,621 · -4.1%
- By 2075
- 141,229 · -8.9%
- By 2100
- 126,014 · -18.7%
Race, ethnicity, and origin ACS 2023
- Neighborhood character
- Predominantly White (86%)
- Race & ethnicity
- White 86% Two or more races 11% Hispanic / Latino 7% Black 2%
- Hispanic origin (detail)
- Puerto Rican 5%
- Common ancestry
- Iranian 5% Italian 4% Lithuanian 3%
- Foreign-born
- 2% · Canada
Political lean MEDSL · Schenectady
- 2024 margin
- D (+10.8) · D 55.4% · R 44.6%
- 2008→2024 swing
- -1.8pp toward R · 2008: 12.7pp · 2024: 10.8pp
- All cycles
- 2024: D+10.8 2020: D+15.7 2016: D+5.8 2012: D+15.4 2008: D+12.7
Not yet ingested
- Civics
- —
Market trends
- HPI YoY
- ▲ 20.51%
- Current HPI
- 310.3979
- Rent YoY
- —
- Metro
- —
- State GDP YoY
- ▲ 2.60%
- F500 in state
- 92
Industry mix (Fortune 500 HQ in NY)
| Industry | F500 HQs | Revenue |
|---|---|---|
| Financial Services | 10 | $950B |
|
||
| Consumer Goods | 9 | $162B |
|
||
| Insurance | 4 | $225B |
|
||
| Telecommunications | 2 | $144B |
|
||
| Pharmaceuticals | 2 | $112B |
|
||
| Media / Entertainment | 2 | $69B |
|
||
Price history
+100.8% since first listed4 events — show timeline
- 2026-04-30 Pending — Global MLS
- 2026-04-21 Listed $239,000 Global MLS
- 2003-09-29 Sold (MLS) $122,000 Global MLS
- 2003-06-13 Listed $119,000 Global MLS
Cash-flow waterfall
monthlySold comps — $/sqft
last 12 mo · ≤1 miLoading sold comps…