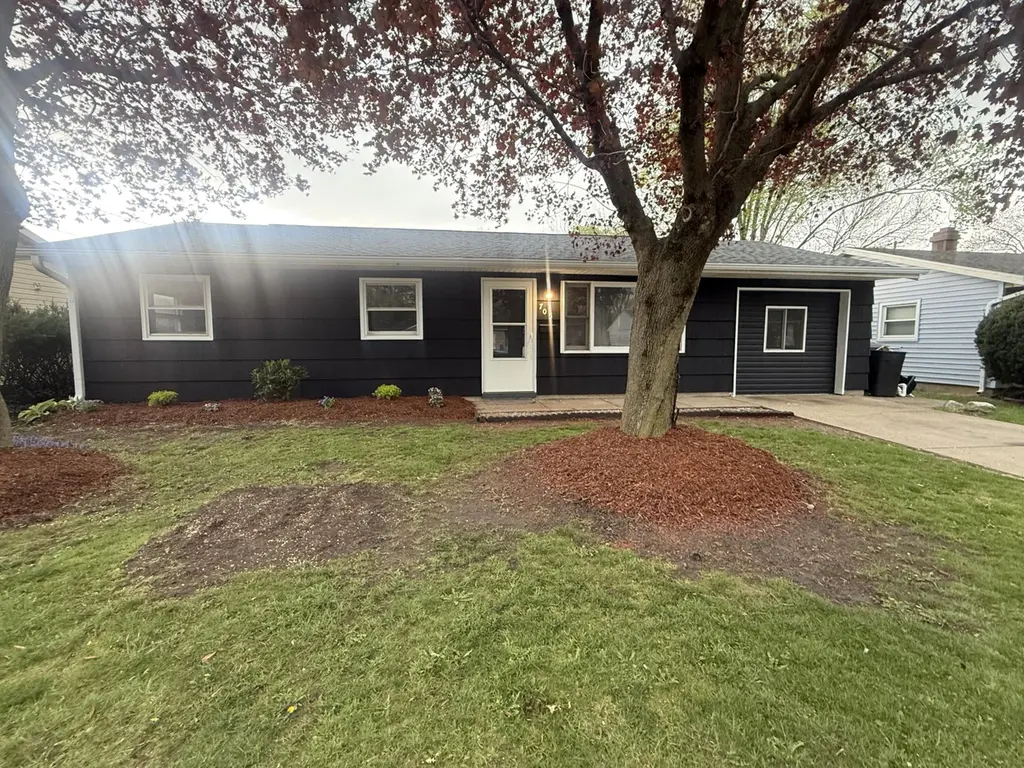
705 Plymouth Ct · Michigan City, IN
Flood risk 8/10 · Major
- FEMA flood zone
- X (unshaded)
- Chance of flooding over 30 yrs
- 0.99%
- Est. flood insurance / yr
- $507 – $1,088
Fire risk 1/10 · Minimal
- Est. fire insurance / yr
- $717 – $1,331
Heat risk 2/10 · Minimal
- Hot days now (above 100°F)
- 7 days/yr
- Hot days in 30 yrs
- 15 days/yr
Wind risk 2/10 · Minimal
- Chance of severe wind over 30 yrs
- —
Air-quality risk 3/10 · Minor
- Unhealthy air days now
- 2 days/yr
- Unhealthy air days in 30 yrs
- 3 days/yr
Risk factors via First Street. Map © Google.
Why this score? — see what drove the D+ grade
The composite is a weighted blend of 9 inputs, each scored 0–100. Each bar is that input's sub-score; the figure is the points it added to the 100-point composite (weight × sub-score).
- Cash flow +14.8/30.0
- ARV discount +11.1/15.0
- Rent growth +4.9/5.0
- DSCR +4.5/10.0
- Livability +4.0/5.0
- 1% rule +3.0/10.0
- Condition / age +2.5/5.0
- Schools +2.2/10.0
- Appreciation +0.0/10.0
$175,500
🖨 Deal sheet 📄 Offer letter ✓ Due diligence
Listing remarks MLS
Turn-key 4-bedroom home with a new roof, ideally located near Gardena Park. This property offers updated flooring throughout, a well-designed layout, and a spacious kitchen with center island. Generous yard provides room for outdoor living or future improvements. Convenient access to shopping, parks, and major routes. Well-positioned and ready for immediate occupancy--schedule your private showing today.
Key facts
- Generous yard
- Brand new roof
- Spacious kitchen
Tags
Neighborhood map
What this means for you Summary
Snapshot
- This is a 3-bed/1.5-bath single-family listed at $176k.
Deal economics
- At list price, monthly cash flow is $-19 ($-226/yr) — negative.
- To cash-flow at today's rent, offer at most $172k (1.9% below list).
- To meet the 1% rule (rent ≥ 1% of price), the offer needs to be $141k (19.8% below list).
- Recommended offer: $141k (19.8% below list) — sets the bar for 1% rule.
- Cap rate 6.6% vs local median 2.7% in Michigan City — top-decile yield for the area; either an underpriced asset or a hidden risk that comps aren't pricing in. Stress-test before assuming the spread holds.
Location & tenants
- Location reads 81/100 on livability (#15 in IN, #1,317 nationally) — a professional / high-income tenant draw. Strengths: commute A+, cost of living A+, housing A+; Watch: employment D, schools D-, amenities D-.
- Michigan City Area Schools (urban): math 23% / reading 28% proficiency, ranked #262 of 301 in IN (top 87%) — low school quality limits family demand, transient renter base, plan for 1-2y turnover; 68% free/reduced lunch — lower-income household profile, screen leases tightly.
- Market conditions: Rents rising fast (+9.7%/yr); 371 active listings in the ZIP; 9 comparable units currently listed for rent nearby; rentals lingering (median 44d on market — plan ~5-8 weeks vacancy on turnover, expect pricing pressure); 100% of comp listings sitting > 30 days — soft ceiling on asking rent; 216 units permitted in LaPorte County in 2024 (75 in 5+ unit buildings).
Forward outlook
- Local home prices are declining (-3.0%/yr); year-one equity from $1k of loan paydown is wiped out by about $5k of value loss. Plan a longer hold.
- LaPorte County population projected to shrink 7% by 2050 — rents likely to lag national; underwrite the cash flow, not the appreciation.
Negotiation context
- It's been on market 59 days — a 3% lower offer ($170k) is reasonable based on typical stale-listing flexibility.
- 2 sale attempts; this cycle's ask has dropped $22k (11%) from the opening price — seller is motivated, your offer sets the floor, not the list.
Risks & watch-outs
- Watch-outs: flood insurance adds $66/mo.
- Climate carrying-cost: severe flood risk — expect insurance premiums to compound above CPI over the hold.
Questions for the listing agent
- What do current leases actually rent for vs. the listed asking? Can we see a recent rent roll and the last 12 months of T-12 income?
- It's been on market 59 days. Have you received any prior offers? Is the seller open to a 20% concession, seller financing, or rate buy-down credit?
- Built in 1960 — when were the roof, HVAC, electrical panel, plumbing, and water heater last replaced?
- What's the actual annual flood-insurance premium (NFIP or private), and is the property in a SFHA with mandatory coverage?
- Is there a deadline driving the sale (1031 exchange, divorce, estate, relocation)? That informs how much negotiation room exists.
- Schools are D-rated, which usually means shorter tenancies and higher turnover. Who's the typical renter profile here, and what's been the actual vacancy rate?
- The area grade is low — what's the realistic commute time and amenity access for the typical tenant pool here? Any planned neighborhood developments (good or bad) we should know about?
- What's the average days-on-market for RENTAL listings here right now (not sales)? A rising rental-DOM trend means longer vacancies and softer asking-rent achievability than the comps imply.
- What's the recent tenant-quality profile in this submarket — average credit score on applications, eviction rate, late-payment / NSF rate, and stable-employment percentage? A property-management company in the area should have these aggregated.
- How much new for-sale + rental construction is in the pipeline within 1–3 miles? Heavy new supply typically softens prices + rents 12–24 months out; constrained supply supports both.
Investment metrics
- 1% rule
- 0.80% ✗
- Cap rate
- 6.62%
- Cash-on-cash
- 1.16%
- DSCR
- 1.05
- GRM
- 10.4
CMA / ARV
- ARV (median comp)
- $190,963
- List price
- $175,500
- Delta
- -8.10%
- Verdict
- FAIR
- Comps
- 20 within 1.0 mi
Show comp detail 12 sales within ~0.75 mi
| Address | Dist | Beds/Ba | Sqft | Sold | Price | $/sf | Match |
|---|---|---|---|---|---|---|---|
| 726 Jackson St | 0.31mi | 3/1.5 | 1,254 (+0%) | 9mo | $175,000 | $140 | 77 |
| 3220 Tilden Ave | 0.27mi | 2/1.5 (-1) | 1,282 (+3%) | 10mo | $225,000 | $176 | 69 |
| 624 Cleveland Ave | 0.56mi | 3/1.0 | 1,181 (-5%) | 1mo | $99,000 | $84 | 62 |
| 506 E Coolspring Ave Unit F | 0.31mi | 3/2.0 | 1,360 (+9%) | 9mo | $100,000 | $74 | 61 |
| 426 Hendricks St | 0.47mi | 3/1.0 | 1,336 (+7%) | 8mo | $150,000 | $112 | 58 |
| 701 S Dickson St | 0.36mi | 2/1.0 (-1) | 1,394 (+12%) | 6mo | $155,000 | $111 | 51 |
| 165 Indian Rdg Dr #165 | 0.61mi | 2/2.0 (-1) | 1,180 (-5%) | 8mo | $218,000 | $185 | 48 |
| 722 Madison St | 0.63mi | 3/1.5 | 1,400 (+12%) | 5mo | $225,000 | $161 | 46 |
| 609 Madison St | 0.64mi | 2/1.5 (-1) | 1,170 (-6%) | 11mo | $170,000 | $145 | 46 |
| 222 May Ave | 0.74mi | 3/1.0 | 1,138 (-9%) | 5mo | $164,400 | $144 | 45 |
| 405 Madison St | 0.67mi | 3/1.0 | 1,410 (+13%) | 2mo | $156,000 | $111 | 44 |
| 1902 Greenwood Ave | 0.62mi | 2/1.5 (-1) | 1,122 (-10%) | 9mo | $180,000 | $160 | 41 |
Match score weights: distance 35% · size 25% · config 20% · recency 20%. Top-matched comps best support the ARV.
Projected returns pro-forma
-3.0% appreciation · 8.0% rent growth · sell at horizon
- IRR
- -12.0%
- Equity multiple
- 0.55×
- Total profit
- $-22,226
- Equity at exit
- $26,168
- IRR
- 3.0%
- Equity multiple
- 1.26×
- Total profit
- $12,848
- Equity at exit
- $15,174
Cash invested: $49,140 (down + closing). Projections, not guarantees.
Landlord ↔ Tenant lean methodology
- Overall (STATE)
- 90 Strongly Landlord-Friendly
- State Indiana
- 90 Strongly Landlord-Friendly · R+11
- County
- — inherits STATE
- City
- — inherits STATE
ZIP-level market 46360
- Rents YoY
- 9.7%
- Active inventory
- 371
- Price-to-rent
- 10.4×
Monthly cashflow live
- Estimated rent
- $1,408 high interval (Pro) →
- Mortgage (P&I)
- −$920
- Tax from tax record
- −$71 /mo · $853/yr
- Insurance
- −$73
- Flood insurance flood zone
- −$66 /mo · $798/yr
- HOA
- −$0
- Vacancy / Maint / Mgmt
- −$296
- Net cashflow
- $-19
Break-even live
UW: 25.0% down · 7.5% · 30yr · 1.5% tax · 5.0% vac · 8.0% maint · 8.0% mgmt
Financing live
Cash to close
- Down payment
- $43,875
- Closing costs
- $5,265
- Reserves months
- —
- Total cash needed
- —
Loan-product check · same deal, 3 products live
Conventional
25% down · 7.5% · 30yr
- Down + closing
- —
- Monthly P&I
- —
- Monthly cashflow
- —
- DSCR
- —
- Eligible?
- —
Personal DTI + credit; lowest rate.
DSCR
20% down · 8.5% · 30yr
- Down + closing
- —
- Monthly P&I
- —
- Monthly cashflow
- —
- DSCR
- —
- Eligible?
- —
No personal income docs; deal must DSCR.
Hard money
10% down · 12.0% · 12mo
- Down + closing
- —
- Monthly P&I
- —
- Monthly cashflow
- —
- DSCR
- —
- Eligible?
- —
Short-term bridge; refi at stabilization.
Rent comps 9 comps
| Address | Beds | Baths | Sqft | Rent | $/sqft | DOM | Units | Dist |
|---|---|---|---|---|---|---|---|---|
| 1810 E Barker Ave Michigan City, IN | 1.0–2.0 | 1.0 | 900 | $1,250 | $1.39 | 43d | 1 | 0.69mi |
| 121 S Porter St Unit A Michigan City, IN | 2.0 | 2.0 | 1050 | $925 | $0.88 | 43d | 1 | 0.75mi |
| 910 S Carroll Ave Michigan City, IN | 2.0–3.0 | 2.0 | 1187 | $1,600 | $1.35 | 43d | 3 | 0.81mi |
| 106 Ruby Ct Michigan City, IN | 2.0 | 1.0 | 744 | $1,195 | $1.61 | 43d | 1 | 0.90mi |
| 215 N Woodland Ave Michigan City, IN | 3.0 | 1.0 | 1112 | $1,395 | $1.25 | 43d | 1 | 0.91mi |
| 416 E 9th St Unit 2 Michigan City, IN | 3.0 | 2.0 | 1400 | $1,325 | $0.95 | 43d | 1 | 1.14mi |
| 614 N Calumet Ave Michigan City, IN | 3.0 | 1.0 | 825 | $1,450 | $1.76 | 43d | 1 | 1.29mi |
| 3581 Hampden Rd Michigan City, IN | 4.0 | 1.0 | 1120 | $2,000 | $1.79 | 43d | 1 | 1.29mi |
| 934 Henry St Michigan City, IN | 3.0 | 1.0 | 1100 | $1,250 | $1.14 | 43d | 1 | 1.33mi |
Listing history 20 events
-
2026-06-19days on market $175,500 Active 59 DOM
-
2026-06-18days on market $175,500 Active 58 DOM
-
2026-06-17days on market $175,500 Active 57 DOM
-
2026-06-16days on market $175,500 Active 56 DOM
-
2026-06-15days on market $175,500 Active 55 DOM
-
2026-06-14pricedays on market $175,500 Active 53 DOM
-
2026-06-13days on market $189,900 Active 52 DOM
-
2026-06-10days on market $189,900 Active 50 DOM
-
2026-06-09days on market $189,900 Active 49 DOM
-
2026-06-08days on market $189,900 Active 48 DOM
-
2026-06-07days on market $189,900 Active 47 DOM
-
2026-06-03days on market $189,900 Active 43 DOM
-
2026-06-02days on market $189,900 Active 42 DOM
-
2026-06-01days on market $189,900 Active 41 DOM
-
2026-05-31days on market $189,900 Active 40 DOM
-
2026-05-30days on market $189,900 Active 39 DOM
-
2026-05-06price $189,900 407-char remark
Show marketing remark (407 chars)
Turn-key 4-bedroom home with a new roof, ideally located near Gardena Park. This property offers updated flooring throughout, a well-designed layout, and a spacious kitchen with center island. Generous yard provides room for outdoor living or future improvements. Convenient access to shopping, parks, and major routes. Well-positioned and ready for immediate occupancy--schedule your private showing today.
-
2026-04-21$198,000 Active 407-char remark
Show marketing remark (407 chars)
Turn-key 4-bedroom home with a new roof, ideally located near Gardena Park. This property offers updated flooring throughout, a well-designed layout, and a spacious kitchen with center island. Generous yard provides room for outdoor living or future improvements. Convenient access to shopping, parks, and major routes. Well-positioned and ready for immediate occupancy--schedule your private showing today.
-
2026-04-09historical
-
2026-02-12$198,000 Active
ⓘ Source: listings_history table (triggers on properties + properties_extension) + one-shot
backfill from property_details.listing_events for pre-trigger history.
Tax reassessment forecast IN · Partial reset (capped growth)
- Current annual tax
- $853 · $71/mo
- Projected year-2 tax
- $1,172 · $98/mo
- Expected delta
- +$319/yr (+$27/mo · 37.4%)
ⓘ Screening estimate from a state-policy table — verify with the county assessor before closing.
Climate risk First Street
- Flood 8/10 Severe FEMA zone X (unshaded) · 99% chance over 30 yrs
- Wildfire 1/10 Low
- Heat 2/10 Low 7 d/yr ≥100°F today · 15 d/yr by 30 yrs out
- Wind 2/10 Low
- Air quality 3/10 Moderate 2 unhealthy d/yr today · 3 by 30 yrs out
Nearby sold comps map
Loading sold comps map…
Walkable amenities ~0.75 mi
Loading nearby amenities…
Taxation est. · year 1
- Rental income
- $16,894
- − Mortgage interest
- −$9,831
- − Property taxes
- −$853
- − Insurance
- −$1,675
- − Repairs & maintenance
- −$1,352
- − Management
- −$1,352
- − Depreciation
- −$5,105
- Taxable loss
- −$3,273
- Est. tax savings @ 24.0%
- +$786
- After-tax cash flow
- $560/yr
For passive investors: Depreciation is non-cash, so a rental often shows a tax loss while cash-flowing — sheltering income. Rental losses are passive: they offset passive income freely, and up to $25,000/yr can offset ordinary (W-2) income if you actively participate and your MAGI is under $100k (phasing out to $0 by $150k); unused losses carry forward. On sale, claimed depreciation is recaptured at up to 25%, and gains may owe capital-gains tax (a 1031 exchange can defer both). Figures are a year-1 estimate at your 24.0% rate — not tax advice; consult a CPA.
Schools (NCES district)
- District
- Michigan City Area Schools
- NCES district ID
- 1806570
- Math proficiency
- 23% ▼ -16.00%
- Reading proficiency
- 28% ▼ -10.00%
- Median HH income
- $42,629
- Composite
- 21.76/100
- National rank
- #8257
- State rank
- #262 of 301 in IN
Livability — Michigan City
- Score
- 81/100
- State rank
- #15
- US rank
- #1317
Category grades
Schools grade is shown separately in the Schools card above.
Census & demographics
- Census place
- Michigan City, IN
- County
- La Porte County · 88,580 people
- City population
- 43,817
- Metro
- Michigan City-La Porte, IN
- Population (ZIP)
- 43,817
- Household income
- $59,266
- Rent vs Own
- Severe rent burden
- 1152.0
Population outlook (LaPorte County) Hauer SSP2
- Today (2025)
- 109,757 people
- By 2030
- 108,288 · -1.3%
- By 2040
- 105,070 · -4.3%
- By 2050
- 102,330 · -6.8%
- By 2075
- 97,009 · -11.6%
- By 2100
- 86,459 · -21.2%
Race, ethnicity, and origin ACS 2023
- Neighborhood character
- Predominantly White (67%)
- Race & ethnicity
- White 67% Black 20% Hispanic / Latino 8% Two or more races 7%
- Hispanic origin (detail)
- Mexican 5%
- Common ancestry
- Romanian 11% Lithuanian 2% Iranian 1%
- Foreign-born
- 3% · Canada
- Languages at home
- 95% English-only · Spanish 3%
Political lean MEDSL · LaPorte
- 2024 margin
- R (+14.1) · D 42.1% · R 56.2% · Other 1.7%
- 2008→2024 swing
- -19.1pp toward R · 2008: 5.0pp · 2024: -14.1pp
- All cycles
- 2024: R+14.1 2020: R+7.2 2016: R+6.4 2012: D+12.6 2008: D+5.0
Not yet ingested
- Civics
- —
Market trends
- HPI YoY
- ▼ -210.27%
- Current HPI
- 206.0882
- Rent YoY
- ▲ 9.72%
- Metro
- Michigan City-La Porte, IN
- State GDP YoY
- ▲ 2.90%
- F500 in state
- 18
Industry mix (Fortune 500 HQ in IN)
| Industry | F500 HQs | Revenue |
|---|---|---|
| Industrial Machinery | 2 | $37B |
|
||
| Healthcare | 1 | $177B |
|
||
| Pharmaceuticals | 1 | $45B |
|
||
| Metals / Steel | 1 | $18B |
|
||
| Agriculture | 1 | $17B |
|
||
| Packaging | 1 | $12B |
|
||
Price history
-4.1% since first listed4 events — show timeline
- 2026-05-06 Price Changed $189,900 NIRA MLS as Distributed by MLS Grid
- 2026-04-21 Listed $198,000 NIRA MLS as Distributed by MLS Grid
- 2026-04-09 Listing Removed — NIRA MLS as Distributed by MLS Grid
- 2026-02-12 Listed $198,000 NIRA MLS as Distributed by MLS Grid
Property tax history
+43.3%/yrLatest (2024): $853 · -5.6% YoY. Source: county tax records.
Cash-flow waterfall
monthlySold comps — $/sqft
last 12 mo · ≤1 miLoading sold comps…