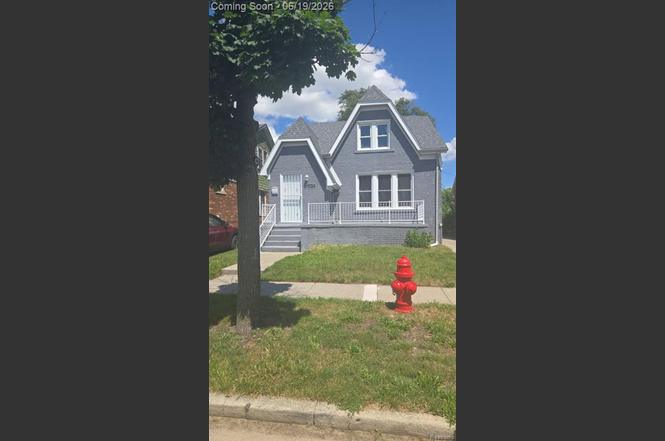
15072 Tracey St · Detroit, MI
Flood risk 1/10 · Minimal
- FEMA flood zone
- X (unshaded)
- Chance of flooding over 30 yrs
- 0.0%
- Est. flood insurance / yr
- $473 – $860
Fire risk 1/10 · Minimal
- Est. fire insurance / yr
- $784 – $1,456
Heat risk 3/10 · Minor
- Hot days now (above 97°F)
- 7 days/yr
- Hot days in 30 yrs
- 15 days/yr
Wind risk 2/10 · Minimal
- Chance of severe wind over 30 yrs
- —
Air-quality risk 3/10 · Minor
- Unhealthy air days now
- 2 days/yr
- Unhealthy air days in 30 yrs
- 5 days/yr
Risk factors via First Street. Map © Google.
Why this score? — see what drove the C grade
The composite is a weighted blend of 9 inputs, each scored 0–100. Each bar is that input's sub-score; the figure is the points it added to the 100-point composite (weight × sub-score).
- Cash flow +21.2/30.0
- ARV discount +7.5/15.0
- DSCR +6.8/10.0
- 1% rule +5.6/10.0
- Appreciation +5.0/10.0
- Livability +3.7/5.0
- Rent growth +2.5/5.0
- Condition / age +2.5/5.0
- Schools +1.3/10.0
$115,000
🖨 Deal sheet 📄 Offer letter ✓ Due diligence
Listing remarks
Come show and sell! This lovely 3 bed 1.5 bath bungalow features new paint throughout. All new light fixtures through the entire home. New vinyl flooring in the living room dining room, and bedrooms. The Kitchen has new shaker cabinets with ceramic tile. Both the full and half bath have been updated with ceramic flooring, new vanities and toilets. The spacious upstairs bedroom features a large walk in closet with a bonus space that can be used for additional closet space, a small office or a kids playroom. The full basement has also been freshly painted with a new heating system. The exterior of the home and garage also feature new roofs, and new vinyl siding.
Key facts
- New shaker cabinets
- Updated vanities
- New light fixtures
Tags
Property features AI
Exterior
- Parking: Detached garage with 1 parking space
- Utilities: Public water at street; Natural gas supply; Forced air heating system
- Home design: Residential property; 1½-story structure; Built in 1928; Frontage of approximately 5
- Construction: Basement foundation
- Exterior features: Brick and vinyl siding exterior; Paved street access
Interior
- Kitchen: Entry-level kitchen (approx. 15 x 13) with ceramic flooring; Dining room adjacent to kitchen (approx. 12 x 12)
- Bedrooms: Primary bedroom on second level (approx. 24 x 12) with carpet; Bedroom on entry level (approx. 10 x 11); Bedroom on entry level (approx. 10 wide)
- Flooring: Carpet in at least one bedroom; Ceramic flooring in kitchen and bathrooms
- Bathrooms: One full bathroom; One lavatory (two total baths/lavs); Entry-level bathroom approximately 8 x 6 with ceramic flooring; Second-level lavatory with ceramic flooring
- Heating & cooling: Forced air heating; Natural gas fuel
- Interior features: 8 total rooms; Unfinished basement
- Laundry & utility: Basement present (unfinished)
Neighborhood map
What this means for you Summary
Snapshot
- This is a 3-bed/1.0-bath single-family listed at $115k.
Deal economics
- At list price, monthly cash flow is $167 ($2k/yr) — positive.
- The deal already cash-flows at list — no discount required.
- Meets the 1% rule at list price ($1k rent vs $115k).
- Cap rate 8.0% vs local median 10.2% in Detroit — below-typical yield; the buyer is paying a premium for something (appreciation thesis, condition, location) that the cap rate doesn't capture.
Location & tenants
- Location reads 73/100 on livability (#218 in MI) — a middle-class / working-renter tenant base. Strengths: amenities A+, commute A+, cost of living A+; Watch: schools F, crime F, employment F.
- Detroit Public Schools Community District (urban): math 10% / reading 24% proficiency, ranked #499 of 540 in MI (top 92%) — low school quality limits family demand, transient renter base, plan for 1-2y turnover; 90% free/reduced lunch — lower-income household profile, screen leases tightly.
- Market conditions: 1 active listings in the ZIP; 40 comparable units currently listed for rent nearby; rentals at typical pace (median 22d on market — plan ~3-4 weeks tenant-placement turnaround); 2,639 units permitted in Wayne County in 2024 (1,216 in 5+ unit buildings).
Forward outlook
- In year one you build about $4k of equity ($795 loan paydown + $3k appreciation (3.0% local appreciation)).
- Wayne County population projected at -17% by 2050 — secular population decline; favor cash flow + early exit over multi-decade hold.
- At projected returns (3.0% appreciation + 3.0% rent growth), your $32k cash investment doubles in ~5 years — after that, you're playing with house money.
- By year 8, paydown + projected appreciation supports a ~$31k cash-out refi (75% LTV) — recoverable capital for the next deal without selling this one.
Negotiation context
- Only 1 days on market — expect competitive offers; lowballing is unlikely to land.
- 2 sale attempts since 22y ago; this cycle's ask is 53% above the opening price — seller raised mid-cycle; expect resistance to lowballs.
Risks & watch-outs
- Watch-outs: built in 1928 — expect roof / HVAC / electrical / plumbing capex.
Questions for the listing agent
- Built in 1928 — when were the roof, HVAC, electrical panel, plumbing, and water heater last replaced?
- Is there a deadline driving the sale (1031 exchange, divorce, estate, relocation)? That informs how much negotiation room exists.
- Schools are F-rated, which usually means shorter tenancies and higher turnover. Who's the typical renter profile here, and what's been the actual vacancy rate?
- Crime grade is F in this area — have there been break-ins, vandalism, or insurance claims at this property in the last 3 years? What carrier currently insures it and at what premium?
- What's the average days-on-market for RENTAL listings here right now (not sales)? A rising rental-DOM trend means longer vacancies and softer asking-rent achievability than the comps imply.
- What's the recent tenant-quality profile in this submarket — average credit score on applications, eviction rate, late-payment / NSF rate, and stable-employment percentage? A property-management company in the area should have these aggregated.
- How much new for-sale + rental construction is in the pipeline within 1–3 miles? Heavy new supply typically softens prices + rents 12–24 months out; constrained supply supports both.
Investment metrics
- 1% rule
- 1.06% ✓
- Cap rate
- 8.03%
- Cash-on-cash
- 6.21%
- DSCR
- 1.28
- GRM
- 7.9
CMA / ARV
- ARV (on-the-fly)
- $66,204
- Comps found
- 12
Show comp detail 12 sales within ~0.75 mi
| Address | Dist | Beds/Ba | Sqft | Sold | Price | $/sf | Match |
|---|---|---|---|---|---|---|---|
| 15053 Littlefield St | 0.20mi | 3/2.0 | 1,286 (+5%) | 2mo | $75,000 | $58 | 77 |
| 14644 Hubbell St | 0.53mi | 3/1.0 | 1,248 (+2%) | 2mo | $45,000 | $36 | 71 |
| 14905 Littlefield St | 0.25mi | 3/1.0 | 1,368 (+12%) | 1mo | $52,000 | $38 | 68 |
| 15824 Snowden St | 0.51mi | 3/1.0 | 1,127 (-8%) | 0mo | $61,000 | $54 | 62 |
| 15824 Snowden St | 0.51mi | 3/1.0 | 1,127 (-8%) | 0mo | $61,000 | $54 | 62 |
| 15770 Stansbury St | 0.44mi | 3/1.0 | 1,100 (-10%) | 1mo | $50,000 | $45 | 62 |
| 16176 Tracey St | 0.66mi | 3/2.0 | 1,270 (+4%) | 0mo | $70,000 | $55 | 59 |
| 14931 Monte Vista St | 0.65mi | 3/1.5 | 1,307 (+7%) | 0mo | $35,000 | $27 | 57 |
| 14321 Ardmore St | 0.61mi | 2/2.0 (-1) | 1,188 (-3%) | 2mo | $11,000 | $9 | 56 |
| 16180 Snowden St | 0.68mi | 3/1.0 | 1,137 (-7%) | 0mo | $61,000 | $54 | 56 |
| 14889 Manor St | 0.60mi | 4/2.5 (+1) | 1,375 (+12%) | 0mo | $159,000 | $116 | 40 |
| 14421 Marlowe St | 0.70mi | 4/1.0 (+1) | 1,060 (-14%) | 3mo | $66,000 | $62 | 38 |
Match score weights: distance 35% · size 25% · config 20% · recency 20%. Top-matched comps best support the ARV.
Projected returns pro-forma
3.0% appreciation · 3.0% rent growth · sell at horizon
- IRR
- 13.3%
- Equity multiple
- 1.76×
- Total profit
- $24,479
- Equity at exit
- $51,709
- IRR
- 15.2%
- Equity multiple
- 3.25×
- Total profit
- $72,321
- Equity at exit
- $79,690
Cash invested: $32,200 (down + closing). Projections, not guarantees.
Landlord ↔ Tenant lean methodology
- Overall (STATE)
- 62 Landlord-Friendly
- State Michigan
- 62 Landlord-Friendly · EVEN
- County
- — inherits STATE
- City
- — inherits STATE
ZIP-level market 48227 3254
- Active inventory
- 1
- Price-to-rent
- 7.9×
Monthly cashflow live
- Estimated rent
- $1,218 high interval (Pro) →
- Mortgage (P&I)
- −$603
- Tax from tax record
- −$145 /mo · $1,734/yr
- Insurance
- −$48
- HOA
- −$0
- Vacancy / Maint / Mgmt
- −$256
- Net cashflow
- $167
Break-even live
UW: 25.0% down · 7.5% · 30yr · 1.5% tax · 5.0% vac · 8.0% maint · 8.0% mgmt
Financing live
Cash to close
- Down payment
- $28,750
- Closing costs
- $3,450
- Reserves months
- —
- Total cash needed
- —
Loan-product check · same deal, 3 products live
Conventional
25% down · 7.5% · 30yr
- Down + closing
- —
- Monthly P&I
- —
- Monthly cashflow
- —
- DSCR
- —
- Eligible?
- —
Personal DTI + credit; lowest rate.
DSCR
20% down · 8.5% · 30yr
- Down + closing
- —
- Monthly P&I
- —
- Monthly cashflow
- —
- DSCR
- —
- Eligible?
- —
No personal income docs; deal must DSCR.
Hard money
10% down · 12.0% · 12mo
- Down + closing
- —
- Monthly P&I
- —
- Monthly cashflow
- —
- DSCR
- —
- Eligible?
- —
Short-term bridge; refi at stabilization.
Rent comps 40 comps
| Address | Beds | Baths | Sqft | Rent | $/sqft | DOM | Units | Dist |
|---|---|---|---|---|---|---|---|---|
| 14903 Tracey St Detroit, MI | 3.0 | 1.0 | 1004 | $1,100 | $1.10 | 16d | 1 | 0.16mi |
| 15340 Hartwell St Detroit, MI | 2.0 | 1.0 | 900 | $1,300 | $1.44 | 16d | 1 | 0.16mi |
| 15387 Lesure St Detroit, MI | 3.0 | 1.0 | 1064 | $1,350 | $1.27 | 12d | 1 | 0.19mi |
| 14891 Hartwell St Detroit, MI | 3.0 | 1.0 | 1000 | $1,150 | $1.15 | 43d | 1 | 0.19mi |
| 15088 Littlefield St Detroit, MI | 2.0 | 1.0 | 1294 | $1,275 | $0.99 | 21d | 1 | 0.23mi |
| 15517 Lesure St Unit BDRM1A Detroit, MI | 2.0 | 1.0 | 1000 | $850 | $0.85 | 24d | 1 | 0.32mi |
| 14847 Cheyenne St Detroit, MI | 3.0 | 2.0 | 849 | $1,150 | $1.35 | 17d | 1 | 0.33mi |
| 14590 Ardmore St Detroit, MI | 3.0 | 1.0 | 1200 | $1,195 | $1.00 | 2d | 1 | 0.40mi |
| 15073 Strathmoor St Detroit, MI | 2.0 | 1.0 | 860 | $1,350 | $1.57 | 16d | 1 | 0.41mi |
| 14600 Strathmoor St Detroit, MI | 4.0 | 1.0 | 1300 | $1,450 | $1.12 | 43d | 1 | 0.50mi |
| 15762 Mark Twain St Detroit, MI | 3.0 | 2.0 | 1430 | $1,250 | $0.87 | 16d | 1 | 0.52mi |
| 15388 Appoline St #203 Detroit, MI | 2.0 | 1.0 | 900 | $850 | $0.94 | 43d | 1 | 0.54mi |
| 15738 Sorrento Ave Detroit, MI | 3.0 | 1.0 | 762 | $1,175 | $1.54 | 43d | 1 | 0.54mi |
| 14559 Strathmoor St Detroit, MI | 2.0 | 1.0 | 1033 | $1,150 | $1.11 | 20d | 1 | 0.55mi |
| 15341 Lauder St Detroit, MI | 4.0 | 1.5 | 1080 | $1,475 | $1.37 | 16d | 1 | 0.61mi |
| 14284 Cruse St Detroit, MI | 3.0 | 1.0 | 1121 | $1,150 | $1.03 | 16d | 1 | 0.61mi |
| 15328 Coyle St Detroit, MI | 3.0 | 1.0 | 1000 | $1,450 | $1.45 | 17d | 1 | 0.70mi |
| 15330 Coyle St Unit 1 Detroit, MI | 3.0 | 1.0 | 1000 | $1,425 | $1.43 | 12d | 1 | 0.70mi |
| 15330 Coyle St Unit 2 Detroit, MI | 3.0 | 1.0 | 1000 | $1,450 | $1.45 | 24d | 1 | 0.70mi |
| 15330 Coyle St Unit 1 Detroit, MI | 3.0 | 1.0 | 1000 | $1,375 | $1.38 | 24d | 1 | 0.70mi |
| 16505 Stansbury St Detroit, MI | 3.0 | 1.0 | 1100 | $1,250 | $1.14 | 10d | 1 | 0.76mi |
| 15760 Monte Vista St Detroit, MI | 2.0 | 1.0 | 1080 | $1,250 | $1.16 | 43d | 1 | 0.77mi |
| 14881 Mendota St Detroit, MI | 3.0 | 1.0 | 1026 | $1,100 | $1.07 | 24d | 1 | 0.77mi |
| 15810 Robson St Detroit, MI | 3.0 | 1.0 | 1142 | $1,500 | $1.31 | 24d | 1 | 0.78mi |
| 14814 Sussex St Unit 2 Detroit, MI | 3.0 | 1.0 | 1100 | $1,000 | $0.91 | 43d | 1 | 0.79mi |
| 15468 Sussex St #2 Detroit, MI | 2.0 | 1.0 | 900 | $1,250 | $1.39 | 43d | 1 | 0.80mi |
| 14375 Terry St Detroit, MI | 3.0 | 2.0 | 1300 | $1,425 | $1.10 | 43d | 1 | 0.80mi |
| 16503 Ward Ave Unit 2 Detroit, MI | 2.0 | 1.0 | 700 | $850 | $1.21 | 43d | 1 | 0.81mi |
| 15100 Whitcomb St Detroit, MI | 2.0 | 1.0 | 750 | $925 | $1.23 | 43d | 1 | 0.81mi |
| 16204 Steel St Detroit, MI | 3.0 | 1.0 | 969 | $1,150 | $1.19 | 43d | 1 | 0.81mi |
| 15512 Mendota St Apt 2 Detroit, MI | 2.0 | 1.0 | 1000 | $1,200 | $1.20 | 43d | 1 | 0.83mi |
| 15512 Mendota St Detroit, MI | 2.0 | 1.0 | 931 | $1,200 | $1.29 | 4d | 1 | 0.83mi |
| 15708 Birwood St Detroit, MI | 3.0 | 1.0 | 1255 | $1,100 | $0.88 | 4d | 1 | 0.90mi |
| 16151 Robson St Detroit, MI | 3.0 | 1.0 | 1300 | $1,525 | $1.17 | 14d | 1 | 0.91mi |
| 14893 Prest St Detroit, MI | 3.0 | 1.0 | 1100 | $1,000 | $0.91 | 14d | 1 | 0.93mi |
| 14264 Coyle St Detroit, MI | 2.0 | 1.0 | 1000 | $1,150 | $1.15 | 43d | 1 | 0.93mi |
| 14104 Coyle St Detroit, MI | 3.0 | 1.0 | 1327 | $1,350 | $1.02 | 4d | 1 | 1.05mi |
| 15765 Washburn St Detroit, MI | 2.0 | 1.0 | 1093 | $950 | $0.87 | 43d | 1 | 1.05mi |
| 13331 Strathmoor St Detroit, MI | 3.0 | 1.0 | 1084 | $1,100 | $1.01 | 16d | 1 | 1.11mi |
| 14615 Winthrop St Detroit, MI | 2.0 | 1.0 | 1217 | $1,300 | $1.07 | 16d | 1 | 1.12mi |
Listing history 2 events
-
2026-06-17remarks 668-char remark
-
2026-06-17$115,000 Coming Soon 1 DOM
ⓘ Source: listings_history table (triggers on properties + properties_extension) + one-shot
backfill from property_details.listing_events for pre-trigger history.
Tax reassessment forecast MI · Partial reset (capped growth)
- Current annual tax
- $1,734 · $145/mo
- Projected year-2 tax
- $1,753 · $146/mo
- Expected delta
- +$18/yr (+$2/mo · 1.1%)
ⓘ Screening estimate from a state-policy table — verify with the county assessor before closing.
Climate risk First Street
- Flood 1/10 Low FEMA zone X (unshaded) · 0% chance over 30 yrs
- Wildfire 1/10 Low
- Heat 3/10 Moderate 7 d/yr ≥97°F today · 15 d/yr by 30 yrs out
- Wind 2/10 Low
- Air quality 3/10 Moderate 2 unhealthy d/yr today · 5 by 30 yrs out
Nearby sold comps map
Loading sold comps map…
Walkable amenities ~0.75 mi
Loading nearby amenities…
Taxation est. · year 1
- Rental income
- $14,613
- − Mortgage interest
- −$6,442
- − Property taxes
- −$1,734
- − Insurance
- −$575
- − Repairs & maintenance
- −$1,169
- − Management
- −$1,169
- − Depreciation
- −$3,345
- Taxable income
- $179
- Est. tax owed @ 24.0%
- −$43
- After-tax cash flow
- $1,955/yr
For passive investors: Depreciation is non-cash, so a rental often shows a tax loss while cash-flowing — sheltering income. Rental losses are passive: they offset passive income freely, and up to $25,000/yr can offset ordinary (W-2) income if you actively participate and your MAGI is under $100k (phasing out to $0 by $150k); unused losses carry forward. On sale, claimed depreciation is recaptured at up to 25%, and gains may owe capital-gains tax (a 1031 exchange can defer both). Figures are a year-1 estimate at your 24.0% rate — not tax advice; consult a CPA.
Schools (NCES district)
- District
- Detroit Public Schools Community District
- NCES district ID
- 2601103
- Math proficiency
- 10% ▼ -2.00%
- Reading proficiency
- 24% ▲ 6.00%
- Median HH income
- $25,815
- Composite
- 13.06/100
- National rank
- #9564
- State rank
- #499 of 540 in MI
Livability — Detroit
- Score
- 73/100
- State rank
- #218
- US rank
- #5427
Category grades
Schools grade is shown separately in the Schools card above.
Census & demographics
- Census place
- Detroit, MI
Population outlook (Wayne County) Hauer SSP2
- Today (2025)
- 1,675,273 people
- By 2030
- 1,620,300 · -3.3%
- By 2040
- 1,502,341 · -10.3%
- By 2050
- 1,384,039 · -17.4%
- By 2075
- 1,124,592 · -32.9%
- By 2100
- 881,193 · -47.4%
Not yet ingested
- Political lean
- —
- Race & ethnicity
- —
- Common origin
- —
- Civics
- —
Market trends
- HPI YoY
- —
- Current HPI
- —
- Rent YoY
- —
- Metro
- —
- State GDP YoY
- ▲ 1.37%
- F500 in state
- 28
Industry mix (Fortune 500 HQ in MI)
| Industry | F500 HQs | Revenue |
|---|---|---|
| Automotive Parts | 3 | $48B |
|
||
| Automotive | 2 | $372B |
|
||
| Chemicals | 1 | $45B |
|
||
| Automotive Retail | 1 | $29B |
|
||
| Healthcare / Medical Devices | 1 | $23B |
|
||
| Automotive Technology | 1 | $20B |
|
||
Price history
+53.3% since first listed5 events — show timeline
- 2026-06-17 Coming Soon $115,000 MiRealSource-MiMLS
- 2005-01-21 Listing Removed — REALCOMP
- 2005-01-21 Listing Removed — MiRealSource-MiMLS
- 2004-07-21 Listed $75,000 REALCOMP
- 2004-07-21 Listed $75,000 MiRealSource-MiMLS
Property tax history
+3.4%/yrLatest (2025): $1,734 · -0.2% YoY. Source: county tax records.
Cash-flow waterfall
monthlySold comps — $/sqft
last 12 mo · ≤1 miLoading sold comps…