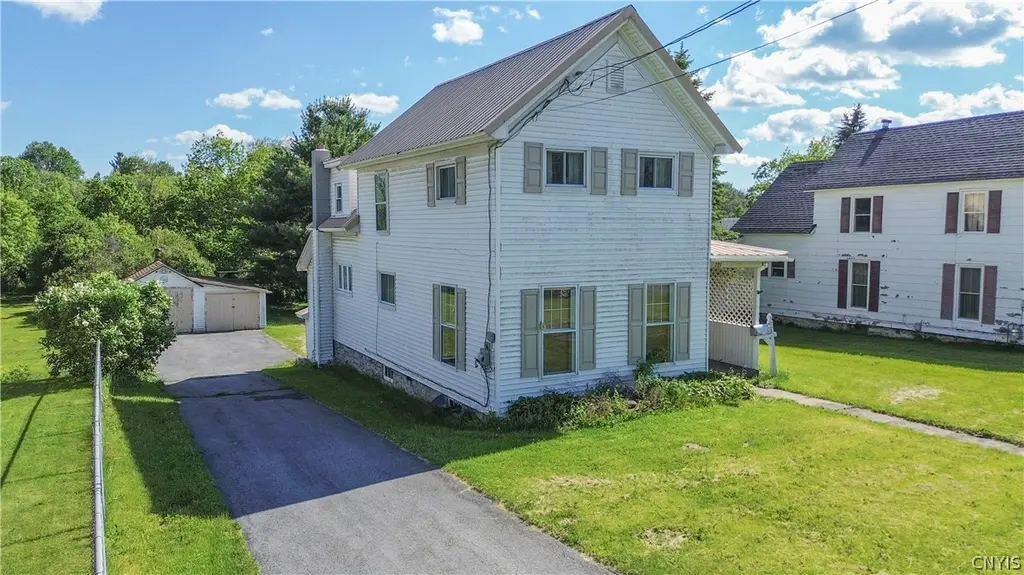
221 E Main St · Brownville, NY
Flood risk 4/10 · Minor
- FEMA flood zone
- X
- Chance of flooding over 30 yrs
- 0.27%
- Est. flood insurance / yr
- $473 – $860
Fire risk 1/10 · Minimal
- Est. fire insurance / yr
- $691 – $1,283
Heat risk 2/10 · Minimal
- Hot days now (above 92°F)
- 7 days/yr
- Hot days in 30 yrs
- 15 days/yr
Wind risk 1/10 · Minimal
- Chance of severe wind over 30 yrs
- 0.0%
Air-quality risk 2/10 · Minimal
- Unhealthy air days now
- 1 days/yr
- Unhealthy air days in 30 yrs
- 1 days/yr
Risk factors via First Street. Map © Google.
Why this score? — see what drove the C grade
The composite is a weighted blend of 9 inputs, each scored 0–100. Each bar is that input's sub-score; the figure is the points it added to the 100-point composite (weight × sub-score).
- Cash flow +17.2/30.0
- ARV discount +15.0/15.0
- Appreciation +5.5/10.0
- DSCR +5.3/10.0
- 1% rule +4.6/10.0
- Schools +4.2/10.0
- Livability +3.2/5.0
- Rent growth +2.5/5.0
- Condition / age +2.2/5.0
$135,000
🖨 Deal sheet 📄 Offer letter ✓ Due diligence
Listing remarks
Bring your vision and unlock the potential of this spacious 3 bedroom, 1 bath home in the Village of Brownville! Offering nearly 1,700 square feet of living space, this two story home is an excellent opportunity for those wanting a starter home, investors, or anyone looking for affordable homeownership. The property features a one-stall garage, a level backyard with plenty of room for outdoor activities, and a unique setting that backs up to the Black River. While the river is currently not accessible from the property due to overgrowth, the natural backdrop provides added privacy and a peaceful setting. Several important updates have already been completed, including a new main electrical
Key facts
- One stall garage
- Level backyard
- New toilet
Tags
Property features AI
Exterior
- Parking: Detached garage; One garage space
- Utilities: Sewer connected; Public water available/connected
- Home design: Two-story home; Existing construction; Rectangular lot; Main thoroughfare frontage
- Construction: Vinyl siding; Stone foundation
- Exterior features: Blacktop driveway; River access to the Black River; Stream frontage
Interior
- Kitchen: Built-in range; Built-in oven; Electric cooktop; Refrigerator
- Bedrooms: One main-level bedroom
- Flooring: Carpet; Laminate; Varies
- Bathrooms: One full bathroom
- Heating & cooling: Oil heating; Forced air
- Interior features: Separate/formal dining room; Eat-in kitchen; Bedroom on main level; Full basement; One fireplace
- Laundry & utility: Electric water heater
Neighborhood map
What this means for you Summary
Snapshot
- This is a 3-bed/1.0-bath single-family listed at $135k. Condition is rated fair.
Deal economics
- At list price, monthly cash flow is $96 ($1k/yr) — positive.
- The deal already cash-flows at list — no discount required.
- To meet the 1% rule (rent ≥ 1% of price), the offer needs to be $130k (3.6% below list).
- Recommended offer: $130k (3.6% below list) — sets the bar for 1% rule.
Location & tenants
- Location reads 65/100 on livability (#680 in NY) — a middle-class / working-renter tenant base. Strengths: employment A+, housing A+, cost of living B; Watch: schools D, health & safety D, crime D-.
- General Brown Central School District (rural): math 39% / reading 57% proficiency, ranked #407 of 590 in NY (top 69%) — families likely to look elsewhere, expect single-tenant / working-renter base with shorter leases.
- Market conditions: 7 active listings in the ZIP; 196 units permitted in Jefferson County in 2024 (0 in 5+ unit buildings).
Forward outlook
- In year one you build about $2k of equity ($933 loan paydown + $1k appreciation (0.9% local appreciation)).
- Jefferson County population projected at -12% by 2050 — secular population decline; favor cash flow + early exit over multi-decade hold.
- At projected returns (0.9% appreciation + 3.0% rent growth), your $38k cash investment doubles in ~8 years — after that, you're playing with house money.
Negotiation context
- Only 3 days on market — expect competitive offers; lowballing is unlikely to land.
Risks & watch-outs
- Watch-outs: built in 1867 — expect roof / HVAC / electrical / plumbing capex.
Questions for the listing agent
- Have any recent inspections been done? Can we get a copy of the seller's disclosures and any deferred-maintenance estimates?
- Built in 1867 — when were the roof, HVAC, electrical panel, plumbing, and water heater last replaced?
- Is there a deadline driving the sale (1031 exchange, divorce, estate, relocation)? That informs how much negotiation room exists.
- Schools are D-rated, which usually means shorter tenancies and higher turnover. Who's the typical renter profile here, and what's been the actual vacancy rate?
- Crime grade is D in this area — have there been break-ins, vandalism, or insurance claims at this property in the last 3 years? What carrier currently insures it and at what premium?
- What's the average days-on-market for RENTAL listings here right now (not sales)? A rising rental-DOM trend means longer vacancies and softer asking-rent achievability than the comps imply.
- What's the recent tenant-quality profile in this submarket — average credit score on applications, eviction rate, late-payment / NSF rate, and stable-employment percentage? A property-management company in the area should have these aggregated.
- How much new for-sale + rental construction is in the pipeline within 1–3 miles? Heavy new supply typically softens prices + rents 12–24 months out; constrained supply supports both.
Investment metrics
- 1% rule
- 0.96% ✗
- Cap rate
- 7.14%
- Cash-on-cash
- 3.03%
- DSCR
- 1.13
- GRM
- 8.6
CMA / ARV
- ARV (on-the-fly)
- $269,353
- Comps found
- 12
Show comp detail 12 sales within ~0.75 mi
| Address | Dist | Beds/Ba | Sqft | Sold | Price | $/sf | Match |
|---|---|---|---|---|---|---|---|
| 306 E Main St | 0.08mi | 4/2.0 (+1) | 1,620 (-3%) | 9mo | $204,000 | $126 | 75 |
| 203 Brown Blvd | 0.31mi | 3/2.0 | 1,701 (+2%) | 9mo | $208,000 | $122 | 71 |
| 205 Pike St | 0.25mi | 3/2.0 | 1,588 (-5%) | 7mo | $210,000 | $132 | 70 |
| 213 Pike St | 0.24mi | 2/1.5 (-1) | 1,496 (-11%) | 8mo | $190,000 | $127 | 58 |
| 205 Franklin St | 0.44mi | 3/2.5 | 1,784 (+7%) | 11mo | $230,000 | $129 | 53 |
| 20065 Evans Rd | 0.29mi | 3/2.0 | 1,876 (+12%) | 14mo | $330,000 | $176 | 51 |
| 118 Warren St | 0.37mi | 3/2.0 | 1,466 (-12%) | 9mo | $210,000 | $143 | 50 |
| 111 Brown Rd W | 0.26mi | 3/1.5 | 1,468 (-12%) | 19mo | $265,000 | $181 | 50 |
| 115 Patrician Ln | 0.55mi | 3/2.5 | 1,812 (+8%) | 6mo | $330,000 | $182 | 49 |
| 118 Patrician Ln | 0.60mi | 3/2.5 | 1,784 (+7%) | 8mo | $321,500 | $180 | 49 |
| 19649 State Route 12f | 0.13mi | 4/2.0 (+1) | 1,424 (-15%) | 20mo | $229,900 | $161 | 43 |
| 401 Brown Blvd | 0.55mi | 3/2.0 | 1,902 (+14%) | 12mo | $345,000 | $181 | 37 |
Match score weights: distance 35% · size 25% · config 20% · recency 20%. Top-matched comps best support the ARV.
Projected returns pro-forma
0.93% appreciation · 3.0% rent growth · sell at horizon
- IRR
- 4.3%
- Equity multiple
- 1.22×
- Total profit
- $8,140
- Equity at exit
- $45,567
- IRR
- 8.7%
- Equity multiple
- 2.05×
- Total profit
- $39,753
- Equity at exit
- $60,155
Cash invested: $37,800 (down + closing). Projections, not guarantees.
Landlord ↔ Tenant lean methodology
- Overall (STATE)
- 15 Strongly Tenant-Friendly
- State New York
- 15 Strongly Tenant-Friendly · D+10
- County
- — inherits STATE
- City
- — inherits STATE
ZIP-level market 13615
- Home prices YoY
- 0.3%
- Active inventory
- 7
- Price-to-rent
- 8.6×
Monthly cashflow live
- Estimated rent
- $1,302 medium interval (Pro) →
- Mortgage (P&I)
- −$708
- Tax est. 1.5%
- −$169 /mo · $2,025/yr
- Insurance
- −$56
- HOA
- −$0
- Vacancy / Maint / Mgmt
- −$273
- Net cashflow
- $96
Break-even live
UW: 25.0% down · 7.5% · 30yr · 1.5% tax · 5.0% vac · 8.0% maint · 8.0% mgmt
Financing live
Cash to close
- Down payment
- $33,750
- Closing costs
- $4,050
- Reserves months
- —
- Total cash needed
- —
Loan-product check · same deal, 3 products live
Conventional
25% down · 7.5% · 30yr
- Down + closing
- —
- Monthly P&I
- —
- Monthly cashflow
- —
- DSCR
- —
- Eligible?
- —
Personal DTI + credit; lowest rate.
DSCR
20% down · 8.5% · 30yr
- Down + closing
- —
- Monthly P&I
- —
- Monthly cashflow
- —
- DSCR
- —
- Eligible?
- —
No personal income docs; deal must DSCR.
Hard money
10% down · 12.0% · 12mo
- Down + closing
- —
- Monthly P&I
- —
- Monthly cashflow
- —
- DSCR
- —
- Eligible?
- —
Short-term bridge; refi at stabilization.
Listing history 2 events
-
2026-06-07remarks 699-char remark
-
2026-06-07$135,000 Pending 3 DOM
ⓘ Source: listings_history table (triggers on properties + properties_extension) + one-shot
backfill from property_details.listing_events for pre-trigger history.
Climate risk First Street
- Flood 4/10 Moderate FEMA zone X · 27% chance over 30 yrs
- Wildfire 1/10 Low
- Heat 2/10 Low 7 d/yr ≥92°F today · 15 d/yr by 30 yrs out
- Wind 1/10 Low 0% chance of damaging wind over 30 yrs
- Air quality 2/10 Low 1 unhealthy d/yr today · 1 by 30 yrs out
Nearby sold comps map
Loading sold comps map…
Walkable amenities ~0.75 mi
Loading nearby amenities…
Taxation est. · year 1
- Rental income
- $15,622
- − Mortgage interest
- −$7,562
- − Property taxes
- −$2,025
- − Insurance
- −$675
- − Repairs & maintenance
- −$1,250
- − Management
- −$1,250
- − Depreciation
- −$3,927
- Taxable loss
- −$1,067
- Est. tax savings @ 24.0%
- +$256
- After-tax cash flow
- $1,402/yr
For passive investors: Depreciation is non-cash, so a rental often shows a tax loss while cash-flowing — sheltering income. Rental losses are passive: they offset passive income freely, and up to $25,000/yr can offset ordinary (W-2) income if you actively participate and your MAGI is under $100k (phasing out to $0 by $150k); unused losses carry forward. On sale, claimed depreciation is recaptured at up to 25%, and gains may owe capital-gains tax (a 1031 exchange can defer both). Figures are a year-1 estimate at your 24.0% rate — not tax advice; consult a CPA.
Condition & rehab AI · 14 photos
This two-story home requires moderate renovations to improve its condition and increase its value. Key areas for improvement include the kitchen and bathroom, exterior siding, and roof. With updates, the home could be a great investment for both resale and rental markets.
Repairs flagged
- Major Kitchen cabinets — Outdated and worn, need replacement
- Major Bathroom cabinets — Outdated and worn, need replacement
- Moderate Roof — Age is unknown, may need inspection
- Moderate Exterior siding — Weathered and discolored, may need repainting or replacement
- Moderate Windows — Older windows, may need replacement or caulking
Value-add opportunities
- Resale New kitchen cabinets and countertops — Modernizes the kitchen and adds value for potential buyers
- Resale New bathroom fixtures and vanity — Modernizes the bathroom and adds value for potential buyers
- Both New roof — Improves the home's appearance and adds value for both resale and rental
- Both Exterior painting — Enhances curb appeal and adds value for both resale and rental
- Both Landscaping and yard maintenance — Improves the home's appearance and adds value for both resale and rental
Renovation cost estimate screening
| Repair item | Severity | Est. cost |
|---|---|---|
| Kitchen cabinets · Outdated and worn, need replacement | Major | $15,000–50,000 |
| Bathroom cabinets · Outdated and worn, need replacement | Major | $15,000–50,000 |
| Roof · Age is unknown, may need inspection | Moderate | $3,000–15,000 |
| Exterior siding · Weathered and discolored, may need repainting or replacement | Moderate | $3,000–15,000 |
| Windows · Older windows, may need replacement or caulking | Moderate | $3,000–15,000 |
| Total estimated repair cost · 5 items | $39,000–145,000 |
Value-add ROI direction
- Resale New kitchen cabinets and countertops — Modernizes the kitchen and adds value for potential buyers ↑
- Resale New bathroom fixtures and vanity — Modernizes the bathroom and adds value for potential buyers ↑
- Both New roof — Improves the home's appearance and adds value for both resale and rental ↑
- Both Exterior painting — Enhances curb appeal and adds value for both resale and rental ↑
- Both Landscaping and yard maintenance — Improves the home's appearance and adds value for both resale and rental ↑
ⓘ Cost ranges are severity-bucket heuristics (US national rule-of-thumb). Get contractor quotes + a written scope before underwriting a rehab budget.
Schools (NCES district)
- District
- General Brown Central School District
- NCES district ID
- 3611910
- Math proficiency
- 39% ▼ -17.00%
- Reading proficiency
- 57% ▲ 6.00%
- Median HH income
- $57,237
- Composite
- 41.75/100
- National rank
- #3398
- State rank
- #407 of 590 in NY
Livability — Brownville
- Score
- 65/100
- State rank
- #680
- US rank
- #12808
Category grades
Schools grade is shown separately in the Schools card above.
Census & demographics
- Census place
- Brownville, NY
- City population
- 538
- Population (ZIP)
- 538
Population outlook (Jefferson County) Hauer SSP2
- Today (2025)
- 111,748 people
- By 2030
- 109,370 · -2.1%
- By 2040
- 103,828 · -7.1%
- By 2050
- 98,523 · -11.8%
- By 2075
- 91,422 · -18.2%
- By 2100
- 78,214 · -30.0%
Race, ethnicity, and origin ACS 2023
- Neighborhood character
- Predominantly White (93%)
- Race & ethnicity
- White 93% Black 4% Two or more races 3%
- Common ancestry
- Lithuanian 18% Scandinavian 6% Iranian 3%
Political lean MEDSL · Jefferson
- 2024 margin
- Strong R (+23.6) · D 38.2% · R 61.8%
- 2008→2024 swing
- -18.3pp toward R · 2008: -5.3pp · 2024: -23.6pp
- All cycles
- 2024: R+23.6 2020: R+19.0 2016: R+22.4 2012: R+2.9 2008: R+5.3
Not yet ingested
- Civics
- —
Market trends
- HPI YoY
- ▲ 0.93%
- Current HPI
- 342.5299
- Rent YoY
- —
- Metro
- —
- State GDP YoY
- ▲ 2.60%
- F500 in state
- 92
Industry mix (Fortune 500 HQ in NY)
| Industry | F500 HQs | Revenue |
|---|---|---|
| Financial Services | 10 | $950B |
|
||
| Consumer Goods | 9 | $162B |
|
||
| Insurance | 4 | $225B |
|
||
| Telecommunications | 2 | $144B |
|
||
| Pharmaceuticals | 2 | $112B |
|
||
| Media / Entertainment | 2 | $69B |
|
||
Price history
2 events — show timeline
- 2026-06-07 Pending — CNYIS
- 2026-06-04 Listed $135,000 CNYIS
Cash-flow waterfall
monthlySold comps — $/sqft
last 12 mo · ≤1 miLoading sold comps…