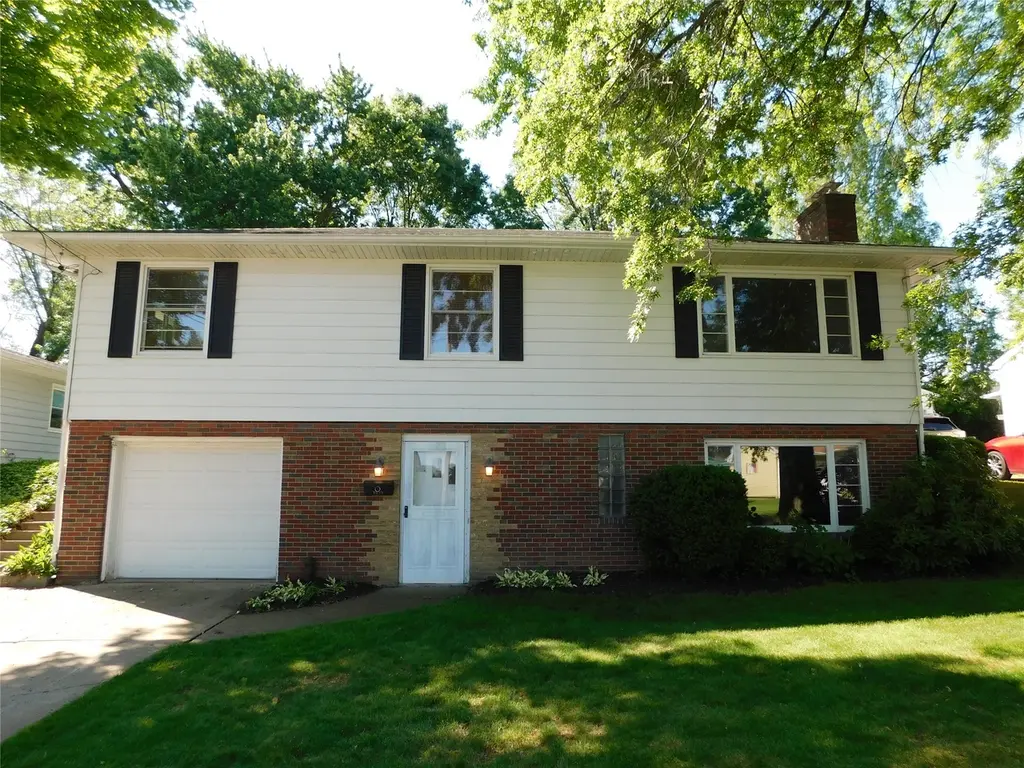
1635 W 41st St · Erie, PA
Flood risk 1/10 · Minimal
- FEMA flood zone
- X (unshaded)
- Chance of flooding over 30 yrs
- 0.0%
- Est. flood insurance / yr
- $473 – $860
Fire risk 1/10 · Minimal
- Est. fire insurance / yr
- $511 – $949
Heat risk 2/10 · Minimal
- Hot days now (above 90°F)
- 7 days/yr
- Hot days in 30 yrs
- 16 days/yr
Wind risk 1/10 · Minimal
- Chance of severe wind over 30 yrs
- —
Air-quality risk 2/10 · Minimal
- Unhealthy air days now
- 1 days/yr
- Unhealthy air days in 30 yrs
- 3 days/yr
Risk factors via First Street. Map © Google.
Why this score? — see what drove the C grade
The composite is a weighted blend of 9 inputs, each scored 0–100. Each bar is that input's sub-score; the figure is the points it added to the 100-point composite (weight × sub-score).
- Cash flow +19.7/30.0
- ARV discount +12.9/15.0
- 1% rule +6.5/10.0
- DSCR +6.2/10.0
- Livability +4.2/5.0
- Rent growth +2.5/5.0
- Condition / age +2.5/5.0
- Schools +1.3/10.0
- Appreciation +0.0/10.0
$175,000
🖨 Deal sheet (PDF) 📄 Offer letter ✓ Due diligence
Listing remarks
Welcome home to this beautiful 3-bedroom, 1 full and 1 half bath split foyer nestled in a quiet and desirable Southwest Erie neighborhood. Featuring gleaming hardwood floors throughout much of the main level, this home offers warmth, character, and plenty of space for comfortable living. Enjoy entertaining in the formal dining area, with open concept kitchen, perfect for holiday gatherings and family dinners. Cozy up on chilly Erie evenings with not one, but two woodburning fireplaces, providing charm and ambience on both levels of the home. The finished lower level offers valuable additional living space ideal for a family room, home office, recreation area, or guest retreat. Outside, you'
Key facts
- Open concept kitchen
- Formal dining area
- Hardwood floors
Tags
Property features AI
Finance
- HOA & community: Sidewalks in the community
Exterior
- Parking: Attached garage with one garage space; Paved driveway; Garage door opener
- Security: Fire alarm
- Utilities: Public water; Public sewer; Cable available
- Home design: Residential single-family home; Frame construction
- Construction: Asphalt roof; Frame construction; Finished full basement
- Exterior features: Covered patio; Storage shed
Interior
- Kitchen: Dishwasher; Exhaust fan; Electric oven; Electric range; Refrigerator
- Bedrooms: Total rooms count: 9; Basement level rooms included (full, finished basement)
- Flooring: Carpet; Hardwood
- Bathrooms: 1 full bathroom; 1 half bathroom
- Heating & cooling: Hot water heating; Ceiling fans for cooling
- Interior features: Ceiling fans throughout; Two wood-burning fireplaces
- Laundry & utility: Washer; Dryer
Neighborhood map
What this means for you Summary
Snapshot
- This is a 3-bed/1.0-bath single-family listed at $175k.
Deal economics
- At list price, monthly cash flow is $206 ($2k/yr) — positive.
- The deal already cash-flows at list — no discount required.
- Meets the 1% rule at list price ($2k rent vs $175k).
- Cap rate 7.7% vs local median 5.3% in Erie — top-decile yield for the area; either an underpriced asset or a hidden risk that comps aren't pricing in. Stress-test before assuming the spread holds.
Location & tenants
- Location reads 83/100 on livability (#109 in PA, #840 nationally) — a professional / high-income tenant draw. Strengths: amenities A+, commute A+, cost of living A+; Watch: crime D+, employment F.
- Erie City SD (urban): math 12% / reading 19% proficiency, ranked #510 of 539 in PA (top 95%) — low school quality limits family demand, transient renter base, plan for 1-2y turnover; 81% free/reduced lunch — lower-income household profile, screen leases tightly.
- Market conditions: 120 active listings in the ZIP; 6 comparable units currently listed for rent nearby; rentals lingering (median 45d on market — plan ~5-8 weeks vacancy on turnover, expect pricing pressure); 100% of comp listings sitting > 30 days — soft ceiling on asking rent; 364 units permitted in Erie County in 2024 (188 in 5+ unit buildings).
- This rent runs 35% of the median local income ($69k/yr) — at the standard rent-burdened threshold; future hikes will face affordability resistance.
Forward outlook
- Local home prices are declining (-3.0%/yr); year-one equity from $1k of loan paydown is wiped out by about $5k of value loss. Plan a longer hold.
- Erie County population projected at -14% by 2050 — secular population decline; favor cash flow + early exit over multi-decade hold.
Negotiation context
- Only 3 days on market — expect competitive offers; lowballing is unlikely to land.
- Current owner paid $130k; 35% above their basis — modest negotiation headroom, anchor on the comps not their cost.
Risks & watch-outs
- Watch-outs: property tax is 2.7% of price; built in 1958 — expect roof / HVAC / electrical / plumbing capex.
Questions for the listing agent
- Built in 1958 — when were the roof, HVAC, electrical panel, plumbing, and water heater last replaced?
- Property tax is high relative to price — has the assessment been appealed recently, and will the sale trigger a re-assessment?
- Is there a deadline driving the sale (1031 exchange, divorce, estate, relocation)? That informs how much negotiation room exists.
- Crime grade is D in this area — have there been break-ins, vandalism, or insurance claims at this property in the last 3 years? What carrier currently insures it and at what premium?
- What's the average days-on-market for RENTAL listings here right now (not sales)? A rising rental-DOM trend means longer vacancies and softer asking-rent achievability than the comps imply.
- What's the recent tenant-quality profile in this submarket — average credit score on applications, eviction rate, late-payment / NSF rate, and stable-employment percentage? A property-management company in the area should have these aggregated.
- How much new for-sale + rental construction is in the pipeline within 1–3 miles? Heavy new supply typically softens prices + rents 12–24 months out; constrained supply supports both.
Investment metrics
- 1% rule
- 1.15% ✓
- Cap rate
- 7.71%
- Cash-on-cash
- 5.05%
- DSCR
- 1.22
- GRM
- 7.2
CMA / ARV
- ARV (on-the-fly)
- $198,660
- Comps found
- 12
Show comp detail 12 sales within ~0.75 mi
| Address | Dist | Beds/Ba | Sqft | Sold | Price | $/sf | Match |
|---|---|---|---|---|---|---|---|
| 3511 Greengarden Blvd | 0.38mi | 3/1.0 | 1,502 (-2%) | 6mo | $151,000 | $101 | 74 |
| 1443 W 43rd St | 0.36mi | 3/1.5 | 1,464 (-5%) | 7mo | $229,900 | $157 | 67 |
| 1459 W 42nd St | 0.32mi | 3/1.0 | 1,396 (-9%) | 5mo | $175,000 | $125 | 65 |
| 1351 W 41st St | 0.47mi | 3/1.5 | 1,464 (-5%) | 6mo | $184,000 | $126 | 63 |
| 3611 Oakwood St | 0.30mi | 3/1.0 | 1,360 (-12%) | 5mo | $176,840 | $130 | 62 |
| 3813 Washington Ave | 0.36mi | 4/3.0 (+1) | 1,467 (-5%) | 3mo | $182,500 | $124 | 60 |
| 3504 Allegheny Rd | 0.41mi | 3/1.0 | 1,388 (-10%) | 6mo | $220,000 | $159 | 59 |
| 3407 Elmwood Ave | 0.73mi | 3/2.0 | 1,540 (0%) | 7mo | $199,000 | $129 | 56 |
| 1445 W 34th St | 0.57mi | 3/1.0 | 1,364 (-11%) | 0mo | $192,000 | $141 | 54 |
| 1918 W 38th St | 0.47mi | 3/1.0 | 1,310 (-15%) | 6mo | $198,000 | $151 | 48 |
| 2920 Auburn Ave | 0.74mi | 4/1.5 (+1) | 1,725 (+12%) | 1mo | $191,000 | $111 | 38 |
| 3109 Ellsworth Ave | 0.65mi | 4/2.0 (+1) | 1,352 (-12%) | 6mo | $152,000 | $112 | 36 |
Match score weights: distance 35% · size 25% · config 20% · recency 20%. Top-matched comps best support the ARV.
Projected returns pro-forma
-3.0% appreciation · 3.0% rent growth · sell at horizon
- IRR
- -8.4%
- Equity multiple
- 0.69×
- Total profit
- $-15,093
- Equity at exit
- $26,093
- IRR
- 1.2%
- Equity multiple
- 1.09×
- Total profit
- $4,324
- Equity at exit
- $15,131
Cash invested: $49,000 (down + closing). Projections, not guarantees.
Landlord ↔ Tenant lean methodology
- Overall (STATE)
- 62 Landlord-Friendly
- State Pennsylvania
- 62 Landlord-Friendly · EVEN
- County
- — inherits STATE
- City
- — inherits STATE
ZIP-level market 16509
- Home prices YoY
- -30.7%
- Active inventory
- 120
- Price-to-rent
- 7.2×
Monthly cashflow live
- Estimated rent
- $2,015 high interval (Pro) →
- Mortgage (P&I)
- −$918
- Tax from tax record
- −$395 /mo · $4,745/yr
- Insurance
- −$73
- HOA
- −$0
- Vacancy / Maint / Mgmt
- −$423
- Net cashflow
- $206
Break-even live
Sensitivity live
| Price | -10% $305 | -5% $256 | +0% $206 | +5% $157 | +10% $107 |
|---|---|---|---|---|---|
| Rent | -10% $47 | -5% $126 | +0% $206 | +5% $286 | +10% $365 |
| Rate | -1.0pp $294 | -0.5pp $251 | base $206 | +0.5pp $161 | +1.0pp $115 |
UW: 25.0% down · 7.5% · 30yr · 1.5% tax · 5.0% vac · 8.0% maint · 8.0% mgmt
Financing live
Cash to close
- Down payment
- $43,750
- Closing costs
- $5,250
- Reserves months
- —
- Total cash needed
- —
Loan-product check · same deal, 3 products live
Conventional
25% down · 7.5% · 30yr
- Down + closing
- —
- Monthly P&I
- —
- Monthly cashflow
- —
- DSCR
- —
- Eligible?
- —
Personal DTI + credit; lowest rate.
DSCR
20% down · 8.5% · 30yr
- Down + closing
- —
- Monthly P&I
- —
- Monthly cashflow
- —
- DSCR
- —
- Eligible?
- —
No personal income docs; deal must DSCR.
Hard money
10% down · 12.0% · 12mo
- Down + closing
- —
- Monthly P&I
- —
- Monthly cashflow
- —
- DSCR
- —
- Eligible?
- —
Short-term bridge; refi at stabilization.
Rent comps 6 comps
| Address | Beds | Baths | Sqft | Rent | $/sqft | DOM | Units | Dist |
|---|---|---|---|---|---|---|---|---|
| 2702 Raspberry St Unit 1 Erie, PA | 3.0 | 1.0 | 2000 | $1,200 | $0.60 | 45d | 1 | 1.16mi |
| 3603 Maple St Erie, PA | 2.0 | 1.0 | 1200 | $1,000 | $0.83 | 45d | 1 | 1.31mi |
| 4500 Hammocks Dr Erie, PA | 2.0–3.0 | 2.0 | 1312 | $3,270 | $2.49 | 45d | 7 | 1.48mi |
| 4536 Hammocks Dr Unit 536404 Erie, PA | 3.0 | 2.0 | 1416 | $2,290 | $1.62 | 45d | 1 | 1.49mi |
| 4536 Hammocks Dr Unit 542401 Erie, PA | 2.0 | 2.0 | 1327 | $2,160 | $1.63 | 45d | 1 | 1.49mi |
| 4536 Hammocks Dr Unit 536204 Erie, PA | 3.0 | 2.0 | 1416 | $2,275 | $1.61 | 45d | 1 | 1.49mi |
Listing history 3 events
-
2026-06-21days on market $175,000 Active 3 DOM
-
2026-06-18remarks 699-char remark
-
2026-06-18$175,000 Active 1 DOM
ⓘ Source: listings_history table (triggers on properties + properties_extension) + one-shot
backfill from property_details.listing_events for pre-trigger history.
Tax reassessment forecast PA · Partial reset (capped growth)
- Current annual tax
- $4,745 · $395/mo
- Projected year-2 tax
- $4,745 · $395/mo
- Expected delta
- $0/yr ($0/mo · 0.0%)
ⓘ Screening estimate from a state-policy table — verify with the county assessor before closing.
Climate risk First Street
- Flood 1/10 Low FEMA zone X (unshaded) · 0% chance over 30 yrs
- Wildfire 1/10 Low
- Heat 2/10 Low 7 d/yr ≥90°F today · 16 d/yr by 30 yrs out
- Wind 1/10 Low
- Air quality 2/10 Low 1 unhealthy d/yr today · 3 by 30 yrs out
Nearby sold comps map
Loading sold comps map…
Walkable amenities ~0.75 mi
Loading nearby amenities…
Taxation est. · year 1
- Rental income
- $24,185
- − Mortgage interest
- −$9,803
- − Property taxes
- −$4,745
- − Insurance
- −$875
- − Repairs & maintenance
- −$1,935
- − Management
- −$1,935
- − Depreciation
- −$5,091
- Taxable loss
- −$199
- Est. tax savings @ 24.0%
- +$48
- After-tax cash flow
- $2,521/yr
For passive investors: Depreciation is non-cash, so a rental often shows a tax loss while cash-flowing — sheltering income. Rental losses are passive: they offset passive income freely, and up to $25,000/yr can offset ordinary (W-2) income if you actively participate and your MAGI is under $100k (phasing out to $0 by $150k); unused losses carry forward. On sale, claimed depreciation is recaptured at up to 25%, and gains may owe capital-gains tax (a 1031 exchange can defer both). Figures are a year-1 estimate at your 24.0% rate — not tax advice; consult a CPA.
Schools (NCES district)
- District
- Erie City SD
- NCES district ID
- 4209300
- Math proficiency
- 12% ▼ -11.00%
- Reading proficiency
- 19% ▼ -16.00%
- Median HH income
- $33,625
- Composite
- 12.59/100
- National rank
- #9617
- State rank
- #510 of 539 in PA
Livability — Erie
- Score
- 83/100
- State rank
- #109
- US rank
- #840
Category grades
Schools grade is shown separately in the Schools card above.
Census & demographics
- Census place
- Erie, PA
- County
- Erie County · 92,215 people
- City population
- 92,215
- Metro
- Erie, PA
- Population (ZIP)
- 28,595
- Household income
- $68,846
- Rent vs Own
- Severe rent burden
- 870.0
Population outlook (Erie County) Hauer SSP2
- Today (2025)
- 272,159 people
- By 2030
- 266,299 · -2.2%
- By 2040
- 250,987 · -7.8%
- By 2050
- 234,925 · -13.7%
- By 2075
- 199,164 · -26.8%
- By 2100
- 162,985 · -40.1%
Race, ethnicity, and origin ACS 2023
- Neighborhood character
- Predominantly White (87%)
- Race & ethnicity
- White 87% Two or more races 6% Black 4% Hispanic / Latino 3% Asian 1%
- Common ancestry
- Romanian 14% Slovak 4% Scotch-Irish 2%
- Foreign-born
- 6% · Canada
- Languages at home
- 92% English-only · Russian/Polish/Slavic 3% German/W. Germanic 1% Spanish 1%
Political lean MEDSL · Erie
- 2024 margin
- Toss-up / Even · D 49.0% · R 50.0%
- 2008→2024 swing
- -20.9pp toward R · 2008: 19.9pp · 2024: -1.0pp
- All cycles
- 2024: R+1.0 2020: D+1.0 2016: R+2.0 2012: D+16.9 2008: D+19.9
Not yet ingested
- Civics
- —
Market trends
- HPI YoY
- ▼ -106.54%
- Current HPI
- 240.361
- Rent YoY
- —
- Metro
- Erie, PA
- State GDP YoY
- ▲ 1.68%
- F500 in state
- 34
Industry mix (Fortune 500 HQ in PA)
| Industry | F500 HQs | Revenue |
|---|---|---|
| Healthcare | 2 | $309B |
|
||
| Insurance | 2 | $27B |
|
||
| Telecommunications / Media | 1 | $124B |
|
||
| Industrial Distribution | 1 | $22B |
|
||
| Financial Services | 1 | $20B |
|
||
| Chemicals / Materials | 1 | $18B |
|
||
Price history
+204.3% since first listed5 events — show timeline
- 2026-06-18 Listed $175,000 GEBOR
- 2009-09-17 Sold (Public Records) $129,900 Public Records
- 2006-06-05 Sold (Public Records) $115,900 Public Records
- 1991-05-15 Sold (Public Records) $68,000 Public Records
- 1988-06-29 Sold (Public Records) $57,500 Public Records
Property tax history
+1.9%/yrLatest (2026): $4,745 · +3.4% YoY. Source: county tax records.
Cash-flow waterfall
monthlySold comps — $/sqft
last 12 mo · ≤1 miLoading sold comps…