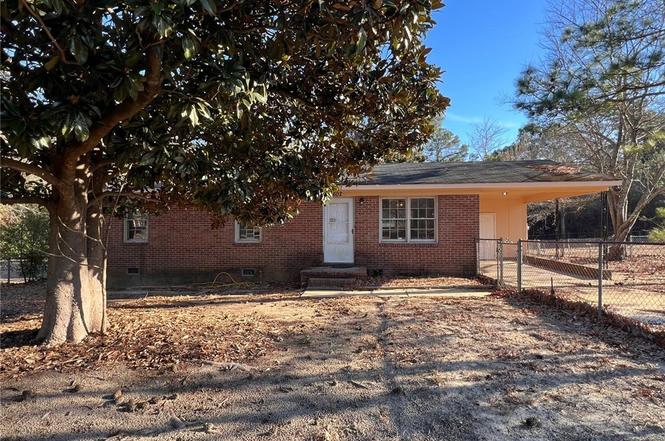
1602 Gardenia Ave · Fayetteville, NC
Flood risk 4/10 · Minor
- FEMA flood zone
- X (unshaded)
- Chance of flooding over 30 yrs
- 0.22%
- Est. flood insurance / yr
- $507 – $1,088
Fire risk 4/10 · Minor
- Est. fire insurance / yr
- $906 – $1,684
Heat risk 7/10 · Major
- Hot days now (above 105°F)
- 7 days/yr
- Hot days in 30 yrs
- 16 days/yr
Wind risk 6/10 · Moderate
- Chance of severe wind over 30 yrs
- 70.0%
Air-quality risk 2/10 · Minimal
- Unhealthy air days now
- 0 days/yr
- Unhealthy air days in 30 yrs
- 1 days/yr
Risk factors via First Street. Map © Google.
Why this score? — see what drove the B- grade
The composite is a weighted blend of 9 inputs, each scored 0–100. Each bar is that input's sub-score; the figure is the points it added to the 100-point composite (weight × sub-score).
- Cash flow +26.0/30.0
- ARV discount +15.0/15.0
- DSCR +8.8/10.0
- 1% rule +6.1/10.0
- Livability +3.8/5.0
- Rent growth +3.2/5.0
- Schools +3.1/10.0
- Condition / age +2.5/5.0
- Appreciation +0.0/10.0
$125,000
🖨 Deal sheet (PDF) 📄 Offer letter ✓ Due diligence
Listing remarks MLS
-As-Is Sale!
Key facts
- Brick exterior
- Spacious lot
- Residential setting
Tags
Property features AI
Exterior
- Parking: Attached carport; 1 covered space; 1 carport space
- Utilities: Public water; Holding tank and septic tank sewer
- Home design: Single-family residence; Residential zoning (R6 - Residential District)
- Construction: Brick veneer and frame construction
- Exterior features: Storm door(s)
Interior
- Kitchen: Refrigerator; Range
- Bedrooms: 5 total rooms (includes bedrooms and living areas)
- Flooring: Hardwood flooring; Vinyl flooring
- Bathrooms: 1 full bathroom; 1 half bathroom
- Heating & cooling: Electric heating; Forced air; Heat pump
- Interior features: Eat-in kitchen; Crawl space basement
Neighborhood map
What this means for you Summary
Snapshot
- This is a 3-bed/2.0-bath single-family listed at $125k.
Deal economics
- At list price, monthly cash flow is $313 ($4k/yr) — positive.
- The deal already cash-flows at list — no discount required.
- Meets the 1% rule at list price ($1k rent vs $125k).
- Recommended offer: $110k (12.0% below list) — sets the bar for market timing.
- Cap rate 9.3% vs local median 4.8% in Fayetteville — top-decile yield for the area; either an underpriced asset or a hidden risk that comps aren't pricing in. Stress-test before assuming the spread holds.
Location & tenants
- Location reads 75/100 on livability (#45 in NC, #4,031 nationally) — a middle-class / working-renter tenant base. Strengths: commute A+, cost of living A+, housing A+; Watch: crime F, employment D-.
- Cumberland County Schools (urban): math 32% / reading 41% proficiency, ranked #126 of 178 in NC (top 71%) — families likely to look elsewhere, expect single-tenant / working-renter base with shorter leases.
- Zoned schools: Westarea Elementary (math 12% / reading 27%, grade F, #1,242 of 1,410 statewide, top 90%, 559 students, 100% FRL); Spring Lake Middle (math 15% / reading 31%, grade F, #406 of 475 statewide, top 86%, 512 students, 99% FRL); Pine Forest High (math 73% / reading 51%, grade B-, #184 of 535 statewide, top 37%, 1,572 students, 62% FRL) — zoned schools average 87% FRL vs 55% district-wide (33 pts higher); higher-poverty schools than district average — tighter screening recommended.
- Market conditions: Rents rising (+2.8%/yr); 362 active listings in the ZIP; 21 comparable units currently listed for rent nearby; rentals at typical pace (median 25d on market — plan ~3-4 weeks tenant-placement turnaround); 1,125 units permitted in Cumberland County in 2024 (104 in 5+ unit buildings).
Forward outlook
- Local home prices are declining (-3.0%/yr); year-one equity from $864 of loan paydown is wiped out by about $4k of value loss. Plan a longer hold.
Negotiation context
- It's been on market 139 days — a 12% lower offer ($110k) is reasonable based on typical stale-listing flexibility.
- 5 sale attempts since 29y ago; this cycle's ask has dropped $38k (23%) from the opening price — seller is motivated, your offer sets the floor, not the list.
- Current owner paid $15k; list at $125k implies a 733% gain — meaningful room to come down on a strong offer.
Risks & watch-outs
- Climate carrying-cost: major wind risk, 70% chance of damaging wind over 30y; extreme-heat days projected 7→16/yr by 2055 (HVAC capex compounding) — expect insurance premiums to compound above CPI over the hold.
Questions for the listing agent
- It's been on market 139 days. Have you received any prior offers? Is the seller open to a 12% concession, seller financing, or rate buy-down credit?
- Built in 1966 — when were the roof, HVAC, electrical panel, plumbing, and water heater last replaced?
- Why hasn't it sold? Are there any deal-killer items the seller is aware of (foundation, flood, title, zoning, code violations)?
- Is there a deadline driving the sale (1031 exchange, divorce, estate, relocation)? That informs how much negotiation room exists.
- Crime grade is F in this area — have there been break-ins, vandalism, or insurance claims at this property in the last 3 years? What carrier currently insures it and at what premium?
- What's the average days-on-market for RENTAL listings here right now (not sales)? A rising rental-DOM trend means longer vacancies and softer asking-rent achievability than the comps imply.
- What's the recent tenant-quality profile in this submarket — average credit score on applications, eviction rate, late-payment / NSF rate, and stable-employment percentage? A property-management company in the area should have these aggregated.
- How much new for-sale + rental construction is in the pipeline within 1–3 miles? Heavy new supply typically softens prices + rents 12–24 months out; constrained supply supports both.
Investment metrics
- 1% rule
- 1.11% ✓
- Cap rate
- 9.29%
- Cash-on-cash
- 10.72%
- DSCR
- 1.48
- GRM
- 7.5
CMA / ARV
- ARV (on-the-fly)
- $160,272
- Comps found
- 8
Show comp detail 8 sales within ~0.75 mi
| Address | Dist | Beds/Ba | Sqft | Sold | Price | $/sf | Match |
|---|---|---|---|---|---|---|---|
| 1622 Shaw Rd | 0.12mi | 3/2.0 | 996 (-1%) | 7mo | $36,000 | $36 | 86 |
| 1612 Gardenia Ave | 0.08mi | 3/2.0 | 1,107 (+10%) | 2mo | $155,000 | $140 | 78 |
| 5212 Delco St | 0.27mi | 3/1.5 | 1,095 (+9%) | 1mo | $174,000 | $159 | 70 |
| 927 Fiske Dr | 0.52mi | 3/1.0 | 1,012 (+0%) | 4mo | $127,000 | $125 | 67 |
| 5200 Delco Dr | 0.30mi | 3/2.0 | 1,040 (+3%) | 19mo | $181,500 | $175 | 65 |
| 1075 Brenda Dr | 0.50mi | 3/1.0 | 944 (-6%) | 11mo | $150,000 | $159 | 53 |
| 906 Fiske Dr | 0.67mi | 4/1.5 (+1) | 1,050 (+4%) | 16mo | $155,000 | $148 | 42 |
| 1512 Stansfield Dr | 0.72mi | 2/2.0 (-1) | 900 (-11%) | 8mo | $160,000 | $178 | 37 |
Match score weights: distance 35% · size 25% · config 20% · recency 20%. Top-matched comps best support the ARV.
Projected returns pro-forma
-3.0% appreciation · 2.82% rent growth · sell at horizon
- IRR
- -0.5%
- Equity multiple
- 0.98×
- Total profit
- $-625
- Equity at exit
- $18,638
- IRR
- 9.0%
- Equity multiple
- 1.68×
- Total profit
- $23,957
- Equity at exit
- $10,808
Cash invested: $35,000 (down + closing). Projections, not guarantees.
Landlord ↔ Tenant lean methodology
- Overall (STATE)
- 85 Strongly Landlord-Friendly
- State North Carolina
- 85 Strongly Landlord-Friendly · R+3
- County
- — inherits STATE
- City
- — inherits STATE
ZIP-level market 28311
- Home prices YoY
- -18.4%
- Rents YoY
- 2.8%
- Active inventory
- 362
- Price-to-rent
- 7.5×
Monthly cashflow live
- Estimated rent
- $1,393 high interval (Pro) →
- Mortgage (P&I)
- −$656
- Tax from tax record
- −$80 /mo · $960/yr
- Insurance
- −$52
- HOA
- −$0
- Vacancy / Maint / Mgmt
- −$292
- Net cashflow
- $313
Break-even live
Sensitivity live
| Price | -10% $383 | -5% $348 | +0% $313 | +5% $277 | +10% $242 |
|---|---|---|---|---|---|
| Rent | -10% $203 | -5% $258 | +0% $313 | +5% $368 | +10% $423 |
| Rate | -1.0pp $376 | -0.5pp $344 | base $313 | +0.5pp $280 | +1.0pp $247 |
UW: 25.0% down · 7.5% · 30yr · 1.5% tax · 5.0% vac · 8.0% maint · 8.0% mgmt
Financing live
Cash to close
- Down payment
- $31,250
- Closing costs
- $3,750
- Reserves months
- —
- Total cash needed
- —
Loan-product check · same deal, 3 products live
Conventional
25% down · 7.5% · 30yr
- Down + closing
- —
- Monthly P&I
- —
- Monthly cashflow
- —
- DSCR
- —
- Eligible?
- —
Personal DTI + credit; lowest rate.
DSCR
20% down · 8.5% · 30yr
- Down + closing
- —
- Monthly P&I
- —
- Monthly cashflow
- —
- DSCR
- —
- Eligible?
- —
No personal income docs; deal must DSCR.
Hard money
10% down · 12.0% · 12mo
- Down + closing
- —
- Monthly P&I
- —
- Monthly cashflow
- —
- DSCR
- —
- Eligible?
- —
Short-term bridge; refi at stabilization.
Rent comps 21 comps
| Address | Beds | Baths | Sqft | Rent | $/sqft | DOM | Units | Dist |
|---|---|---|---|---|---|---|---|---|
| 1404 Hibiscus Rd Fayetteville, NC | 3.0 | 1.5 | 1418 | $1,350 | $0.95 | 22d | 1 | 0.21mi |
| 1350 Shaw Rd Fayetteville, NC | 3.0 | 2.0 | 1339 | $1,399 | $1.04 | 15d | 1 | 0.24mi |
| 5745 Holland St Fayetteville, NC | 3.0 | 1.0 | 1140 | $1,650 | $1.45 | 24d | 1 | 0.32mi |
| 5523 Livingston Dr Fayetteville, NC | 4.0 | 1.5 | 1305 | $1,600 | $1.23 | 24d | 1 | 0.45mi |
| 927 Fiske Dr Fayetteville, NC | 3.0 | 1.0 | 926 | $1,200 | $1.30 | 24d | 1 | 0.50mi |
| 844 Anita Rd Fayetteville, NC | 2.0 | 1.0 | 850 | $850 | $1.00 | 15d | 1 | 0.91mi |
| 4310 Coolidge St Fayetteville, NC | 3.0 | 1.5 | 1212 | $1,250 | $1.03 | 15d | 1 | 1.04mi |
| 1907 Eichelberger Dr Fayetteville, NC | 3.0 | 2.0 | 1463 | $1,650 | $1.13 | 24d | 1 | 1.18mi |
| 848 Tamarack Dr Fayetteville, NC | 1.0–2.0 | 1.0 | 705 | $1,171 | $1.66 | 15d | 49 | 1.23mi |
| 3613 Pine Lake Dr Fayetteville, NC | 1.0–3.0 | 1.0–2.0 | 1116 | $1,645 | $1.47 | 15d | 31 | 1.25mi |
| 1882 Tryon Dr #4 Fayetteville, NC | 2.0 | 2.0 | 1063 | $1,100 | $1.03 | 15d | 1 | 1.32mi |
| 1808 Tryon Dr Fayetteville, NC | 2.0 | 2.0 | 1066 | $995 | $0.93 | 24d | 1 | 1.32mi |
| 4206 S Dowfield Dr Fayetteville, NC | 2.0 | 1.0 | 900 | $895 | $0.99 | 24d | 1 | 1.32mi |
| 4202 S Dowfield Dr Fayetteville, NC | 2.0 | 1.0 | 800 | $930 | $1.16 | 24d | 1 | 1.32mi |
| 5109 Higgins St Fayetteville, NC | 2.0 | 1.0 | 862 | $1,000 | $1.16 | 24d | 1 | 1.35mi |
| 1861 Tryon Dr Unit 3 Fayetteville, NC | 2.0 | 2.0 | 1050 | $995 | $0.95 | 24d | 1 | 1.36mi |
| 5112 Cannon St Fayetteville, NC | 2.0 | 1.0 | 750 | $949 | $1.27 | 15d | 1 | 1.36mi |
| 1909 Tryon Dr #7 Fayetteville, NC | 2.0 | 2.0 | 1060 | $1,050 | $0.99 | 24d | 1 | 1.41mi |
| 1615 Morehead Ave Fayetteville, NC | 3.0 | 2.0 | 1073 | $1,400 | $1.30 | 24d | 1 | 1.41mi |
| 1849 Tryon Dr Fayetteville, NC | 2.0 | 2.0 | 1061 | $998 | $0.94 | 24d | 2 | 1.42mi |
| 4420 Blanton Rd Unit 4420-H Fayetteville, NC | 2.0 | 1.5 | 990 | $1,025 | $1.04 | 15d | 1 | 1.43mi |
Listing history 28 events
-
2026-06-21days on market $125,000 Active 139 DOM
-
2026-06-18days on market $125,000 Active 136 DOM
-
2026-06-17days on market $125,000 Active 135 DOM
-
2026-06-16days on market $125,000 Active 134 DOM
-
2026-06-15days on market $125,000 Active 133 DOM
-
2026-06-14days on market $125,000 Active 131 DOM
-
2026-06-13days on market $125,000 Active 130 DOM
-
2026-06-10pricedays on market $125,000 Active 128 DOM
-
2026-06-09days on market $151,000 Active 127 DOM
-
2026-06-08days on market $151,000 Active 126 DOM
-
2026-06-07days on market $151,000 Active 125 DOM
-
2026-06-03days on market $151,000 Active 121 DOM
-
2026-06-02days on market $151,000 Active 120 DOM
-
2026-06-01days on market $151,000 Active 119 DOM
-
2026-05-31days on market $151,000 Active 118 DOM
-
2026-05-30days on market $151,000 Active 117 DOM
-
2026-04-10price $151,000
-
2026-04-10status Active
-
2026-01-23$163,000 Active
-
2023-11-29price $24,900 12-char remark
Show marketing remark (12 chars)
-As-Is Sale!
-
2016-09-15soldstatus $15,000 12-char remark
Show marketing remark (12 chars)
-As-Is Sale!
-
2016-01-02$24,900 12-char remark
Show marketing remark (12 chars)
-As-Is Sale!
-
2015-09-02soldstatus $30,000
-
2014-12-31historical
-
2014-09-02$38,000
-
1997-12-03soldstatus $15,000 12-char remark
Show marketing remark (12 chars)
-As-Is Sale!
-
1997-10-17$152,900 12-char remark
Show marketing remark (12 chars)
-As-Is Sale!
-
1995-08-07soldstatus $50,000
ⓘ Source: listings_history table (triggers on properties + properties_extension) + one-shot
backfill from property_details.listing_events for pre-trigger history.
Tax reassessment forecast NC · Resets to sale price
- Current annual tax
- $960 · $80/mo
- Projected year-2 tax
- $1,025 · $85/mo
- Expected delta
- +$65/yr (+$5/mo · 6.7%)
ⓘ Screening estimate from a state-policy table — verify with the county assessor before closing.
Climate risk First Street
- Flood 4/10 Moderate FEMA zone X (unshaded) · 22% chance over 30 yrs
- Wildfire 4/10 Moderate
- Heat 7/10 Severe 7 d/yr ≥105°F today · 16 d/yr by 30 yrs out
- Wind 6/10 Major 70% chance of damaging wind over 30 yrs
- Air quality 2/10 Low 0 unhealthy d/yr today · 1 by 30 yrs out
Nearby sold comps map
Loading sold comps map…
Walkable amenities ~0.75 mi
Loading nearby amenities…
Taxation est. · year 1
- Rental income
- $16,712
- − Mortgage interest
- −$7,002
- − Property taxes
- −$960
- − Insurance
- −$625
- − Repairs & maintenance
- −$1,337
- − Management
- −$1,337
- − Depreciation
- −$3,636
- Taxable income
- $1,814
- Est. tax owed @ 24.0%
- −$435
- After-tax cash flow
- $3,315/yr
For passive investors: Depreciation is non-cash, so a rental often shows a tax loss while cash-flowing — sheltering income. Rental losses are passive: they offset passive income freely, and up to $25,000/yr can offset ordinary (W-2) income if you actively participate and your MAGI is under $100k (phasing out to $0 by $150k); unused losses carry forward. On sale, claimed depreciation is recaptured at up to 25%, and gains may owe capital-gains tax (a 1031 exchange can defer both). Figures are a year-1 estimate at your 24.0% rate — not tax advice; consult a CPA.
Schools (NCES district)
- District
- Cumberland County Schools
- NCES district ID
- 3700011
- Math proficiency
- 32% ▼ -2.00%
- Reading proficiency
- 41% ▼ -1.00%
- Median HH income
- $44,168
- Composite
- 31.0/100
- National rank
- #6096
- State rank
- #126 of 178 in NC
Livability — Fayetteville
- Score
- 75/100
- State rank
- #45
- US rank
- #4031
Category grades
Schools grade is shown separately in the Schools card above.
Census & demographics
- County
- Cumberland County · 265,314 people
- City population
- 226,118
- Metro
- Fayetteville, NC
- Population (ZIP)
- 36,629
- Household income
- $62,170
- Rent vs Own
- Severe rent burden
- 1645.0
Population outlook (Cumberland County) Hauer SSP2
- Today (2025)
- 330,855 people
- By 2030
- 333,523 · +0.8%
- By 2040
- 335,583 · +1.4%
- By 2050
- 335,325 · +1.4%
- By 2075
- 342,853 · +3.6%
- By 2100
- 340,698 · +3.0%
Race, ethnicity, and origin ACS 2023
- Neighborhood character
- Diverse neighborhood (Simpson 0.67)
- Race & ethnicity
- Black 42% White 38% Hispanic / Latino 9% Two or more races 8% Asian 3% Native American 1%
- Hispanic origin (detail)
- Mexican 3% Puerto Rican 4%
- Common ancestry
- Slovak 1% Lithuanian 1% Italian 1%
- Foreign-born
- 7% · Canada, South Korea, Jamaica
- Languages at home
- 89% English-only · Spanish 6% German/W. Germanic 1% Other Indo-European 1%
Political lean MEDSL · Cumberland
- 2024 margin
- D (+13.4) · D 56.1% · R 42.7% · Other 1.2%
- 2008→2024 swing
- -4.3pp toward R · 2008: 17.7pp · 2024: 13.4pp
- All cycles
- 2024: D+13.4 2020: D+16.6 2016: D+16.0 2012: D+19.7 2008: D+17.7
Not yet ingested
- Civics
- —
Market trends
- HPI YoY
- ▼ -45.88%
- Current HPI
- 203.0731
- Rent YoY
- ▲ 2.82%
- Metro
- Fayetteville, NC
- State GDP YoY
- ▲ 3.28%
- F500 in state
- 26
Industry mix (Fortune 500 HQ in NC)
| Industry | F500 HQs | Revenue |
|---|---|---|
| Financial Services | 2 | $213B |
|
||
| Retail | 2 | $95B |
|
||
| Industrial Conglomerate | 1 | $38B |
|
||
| Metals / Steel | 1 | $35B |
|
||
| Utilities | 1 | $30B |
|
||
| Industrial Machinery | 1 | $19B |
|
||
Price history
+202.0% since first listed12 events — show timeline
- 2026-04-10 Price Changed $151,000 LPRMLS
- 2026-04-10 Relisted — LPRMLS
- 2026-01-23 Listed $163,000 LPRMLS
- 2023-11-29 Price Changed $24,900 TMLS
- 2016-09-15 Sold (MLS) $15,000 LPRMLS
- 2016-01-02 Listed $24,900 LPRMLS
- 2015-09-02 Sold (Public Records) $30,000 Public Records
- 2014-12-31 Listing Removed — TMLS
- 2014-09-02 Listed $38,000 TMLS
- 1997-12-03 Sold (MLS) $15,000 TMLS
- 1997-10-17 Listed $152,900 TMLS
- 1995-08-07 Sold (Public Records) $50,000 Public Records
Property tax history
+6.9%/yrLatest (2025): $960 · +57.3% YoY. Source: county tax records.
Cash-flow waterfall
monthlySold comps — $/sqft
last 12 mo · ≤1 miLoading sold comps…