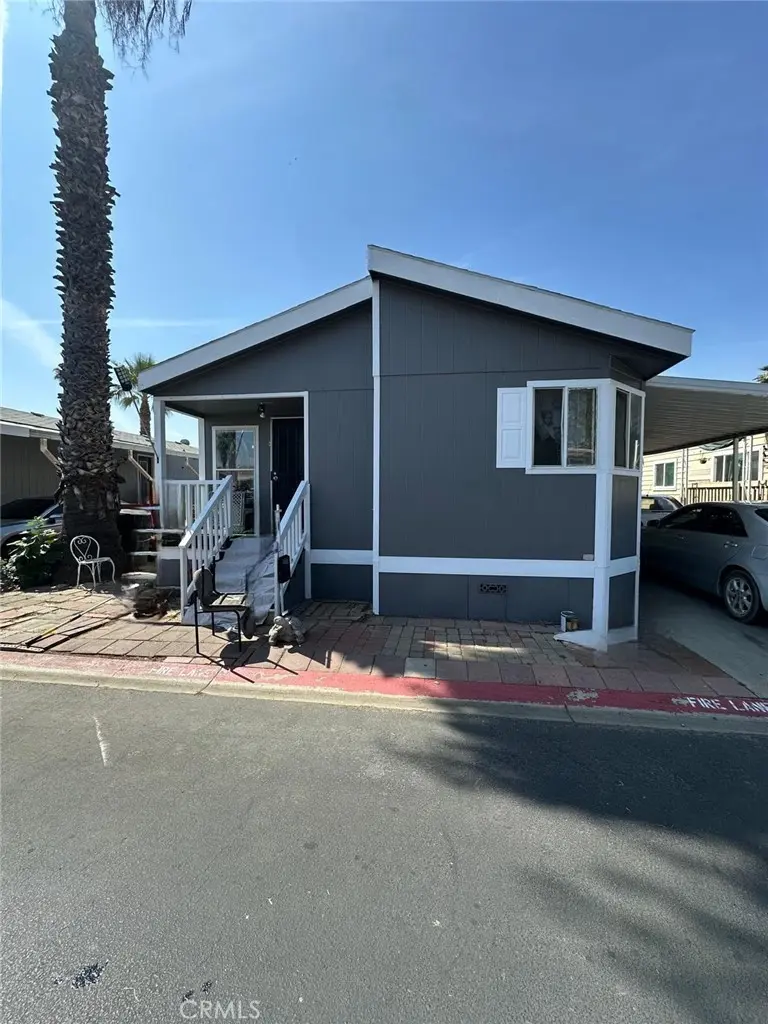
350 E San Jacinto #151 · Perris, CA
Flood risk 4/10 · Minor
- FEMA flood zone
- X (unshaded)
- Chance of flooding over 30 yrs
- 0.2%
- Est. flood insurance / yr
- $507 – $1,088
Fire risk 8/10 · Major
- Est. fire insurance / yr
- $659 – $1,223
Heat risk 7/10 · Major
- Hot days now (above 104°F)
- 7 days/yr
- Hot days in 30 yrs
- 19 days/yr
Wind risk 1/10 · Minimal
- Chance of severe wind over 30 yrs
- —
Air-quality risk 5/10 · Moderate
- Unhealthy air days now
- 8 days/yr
- Unhealthy air days in 30 yrs
- 10 days/yr
Risk factors via First Street. Map © Google.
Why this score? — see what drove the C+ grade
The composite is a weighted blend of 9 inputs, each scored 0–100. Each bar is that input's sub-score; the figure is the points it added to the 100-point composite (weight × sub-score).
- Cash flow +30.0/30.0
- 1% rule +10.0/10.0
- DSCR +10.0/10.0
- Rent growth +4.4/5.0
- Livability +3.4/5.0
- Schools +3.0/10.0
- Condition / age +2.2/5.0
- ARV discount +0.0/15.0
- Appreciation +0.0/10.0
$159,000
🖨 Deal sheet (PDF) 📄 Offer letter ✓ Due diligence
Listing remarks
Welcome to this exceptional manufactured home, WITH A LOW SPACE RENT OF APPROXIMATELY $1,060. Discover an outstanding opportunity in Riverside County. Look no further than this remarkable all-ages manufactured home, ideally located in the Lake Perris Village Mobile Home Park. This spacious residence offers a comfortable lifestyle with 3 bedrooms, 2 bathrooms, and parking that may accommodate up to three small vehicles. Adding even more value, the home includes a generous backyard and side yard. Community amenities OFFER A CLUBHOUSE/EVENT ROOM, SWIMMING POOL, GYM, LAUDRY AREA, & PLAYGROUND. For added convenience, the property is just minutes from Downtown Perris, Highway 74, and a varie
Key facts
- 2 parking spots
- Community pool
- Built 2005
Property features AI
Finance
- Other: Park name: Lake Perris Village
- Financial info: Rent includes: none
- HOA & community: Land lease in park (Lake Perris Village) with monthly land lease payment of $1,060; Community features include dog park and sidewalks; Manager approval required
Exterior
- Parking: Carport with 2 parking spaces
- Security: Gated community; Smoke and carbon monoxide detectors
- Utilities: Public/district water; Public sewer (sewer paid); Natural gas connected and available; Electricity available
- Home design: Single-story mobile home (model 3502K); Raised foundation; Mobile home remains in place; Approximately 23 ft wide by 50 ft long; Faces main entry (entry on level 1)
- Construction: Shingle roof; Wood skirting; Raised foundation; Built year sourced from public records
- Exterior features: Shingle roof; Wood skirting; Community pool; No fencing
Interior
- Kitchen: Kitchen island; Laminate countertops; Gas oven
- Bedrooms: All bedrooms located on the main level
- Flooring: Vinyl; Carpet; Wood
- Bathrooms: Two full bathrooms; Showers in tubs
- Heating & cooling: Central furnace heating; Wall/window cooling
- Interior features: One-level layout with all bedrooms on the main floor; Main entry at level 1; Carbon monoxide detector(s) and smoke detector; Located in a gated community
- Laundry & utility: Interior laundry
Neighborhood map
What this means for you Summary
Snapshot
- This is a 3-bed/2.0-bath manufactured listed at $159k. Condition is rated fair.
Deal economics
- At list price, monthly cash flow is $1k ($12k/yr) — positive.
- The deal already cash-flows at list — no discount required.
- Meets the 1% rule at list price ($3k rent vs $159k).
- Recommended offer: $154k (3.0% below list) — sets the bar for market timing.
- Cap rate 13.9% vs local median 3.6% in Perris — top-decile yield for the area; either an underpriced asset or a hidden risk that comps aren't pricing in. Stress-test before assuming the spread holds.
Location & tenants
- Location reads 67/100 on livability (#322 in CA) — a middle-class / working-renter tenant base. Strengths: housing A+, commute B; Watch: crime C-, health & safety D, amenities F.
- Perris Union High (suburban): math 21% / reading 48% proficiency, ranked #282 of 517 in CA (top 54%) — families likely to look elsewhere, expect single-tenant / working-renter base with shorter leases; 72% free/reduced lunch — lower-income household profile, screen leases tightly.
- Zoned schools: Palms Elementary (734 students, 84% FRL); Pinacate Middle (math 11% / reading 27%, grade F, #426 of 498 statewide, top 86%, 927 students, 96% FRL) — zoned schools average 90% FRL vs 72% district-wide (18 pts higher); higher-poverty schools than district average — tighter screening recommended.
- Zoned-school proficiency averages 19% at this address vs 34% district-wide (-16 pts) — the specific schools serving this property underperform the Perris Union High average; the district grade overstates school quality for this exact location.
- Market conditions: Rents rising fast (+7.7%/yr); 141 active listings in the ZIP; 12 comparable units currently listed for rent nearby; rentals leasing fast (median 0d on market — plan ~1-2 weeks tenant-placement turnaround); solid renter incomes; 9,195 units permitted in Riverside County in 2024 (1,512 in 5+ unit buildings).
- This rent runs 35% of the median local income ($92k/yr) — at the standard rent-burdened threshold; future hikes will face affordability resistance.
Forward outlook
- Local home prices are declining (-3.0%/yr); year-one equity from $1k of loan paydown is wiped out by about $5k of value loss. Plan a longer hold.
- Riverside County population projected at +22% by 2050 — long-run rental-demand tailwind backs the buy-and-hold thesis.
- At projected returns (-3.0% appreciation + 7.7% rent growth), your $45k cash investment doubles in ~4 years — after that, you're playing with house money.
Negotiation context
- It's been on market 49 days — a 3% lower offer ($154k) is reasonable based on typical stale-listing flexibility.
Risks & watch-outs
- Climate carrying-cost: severe wildfire risk; extreme-heat days projected 7→19/yr by 2055 (HVAC capex compounding) — expect insurance premiums to compound above CPI over the hold.
Questions for the listing agent
- It's been on market 49 days. Have you received any prior offers? Is the seller open to a 3% concession, seller financing, or rate buy-down credit?
- Have any recent inspections been done? Can we get a copy of the seller's disclosures and any deferred-maintenance estimates?
- Is there a deadline driving the sale (1031 exchange, divorce, estate, relocation)? That informs how much negotiation room exists.
- Schools are F-rated, which usually means shorter tenancies and higher turnover. Who's the typical renter profile here, and what's been the actual vacancy rate?
- What's the average days-on-market for RENTAL listings here right now (not sales)? A rising rental-DOM trend means longer vacancies and softer asking-rent achievability than the comps imply.
- What's the recent tenant-quality profile in this submarket — average credit score on applications, eviction rate, late-payment / NSF rate, and stable-employment percentage? A property-management company in the area should have these aggregated.
- How much new for-sale + rental construction is in the pipeline within 1–3 miles? Heavy new supply typically softens prices + rents 12–24 months out; constrained supply supports both.
Investment metrics
- 1% rule
- 1.68% ✓
- Cap rate
- 13.89%
- Cash-on-cash
- 27.12%
- DSCR
- 2.21
- GRM
- 5.0
CMA / ARV
- ARV (on-the-fly)
- $128,184
- Comps found
- 12
Show comp detail 12 sales within ~0.75 mi
| Address | Dist | Beds/Ba | Sqft | Sold | Price | $/sf | Match |
|---|---|---|---|---|---|---|---|
| 350 E San Jacinto Ave #108 | 0.00mi | 3/2.0 | 1,152 (-2%) | 3mo | $145,000 | $126 | 94 |
| 350 E San Jacinto | 0.00mi | 3/2.0 | 1,120 (-5%) | 4mo | $35,000 | $31 | 89 |
| 350 E San Jacinto #163 | 0.00mi | 3/2.0 | 1,248 (+6%) | 4mo | $120,000 | $96 | 86 |
| 350 E San Jacinto Ave #9 | 0.00mi | 3/2.0 | 1,152 (-2%) | 18mo | $159,900 | $139 | 82 |
| 350 E San Jacinto Ave #27 | 0.00mi | 3/2.0 | 1,272 (+8%) | 10mo | $180,000 | $142 | 78 |
| 350 E San Jacinto Ave #170 | 0.14mi | 3/2.0 | 1,176 (0%) | 19mo | $128,000 | $109 | 78 |
| 350 E San Jacinto Ave #121 | 0.00mi | 3/2.0 | 1,344 (+14%) | 4mo | $120,000 | $89 | 72 |
| 350 E San Jacinto Ave #207 | 0.00mi | 3/2.0 | 1,344 (+14%) | 10mo | $144,000 | $107 | 68 |
| 350 E San Jacinto Ave #208 | 0.00mi | 3/2.0 | 1,344 (+14%) | 16mo | $160,000 | $119 | 63 |
| 350 E San Jacunto #195 | 0.01mi | 3/2.0 | 1,344 (+14%) | 17mo | $140,000 | $104 | 62 |
| 350 E San Jacinto Ave #127 | 0.00mi | 3/2.0 | 1,344 (+14%) | 18mo | $222,557 | $166 | 61 |
| 350 E San Jacinto Ave #145 | 0.00mi | 2/2.0 (-1) | 1,000 (-15%) | 13mo | $96,600 | $97 | 60 |
Match score weights: distance 35% · size 25% · config 20% · recency 20%. Top-matched comps best support the ARV.
Projected returns pro-forma
-3.0% appreciation · 7.69% rent growth · sell at horizon
- IRR
- 26.3%
- Equity multiple
- 2.16×
- Total profit
- $51,517
- Equity at exit
- $23,707
- IRR
- 36.7%
- Equity multiple
- 5.20×
- Total profit
- $187,067
- Equity at exit
- $13,747
Cash invested: $44,520 (down + closing). Projections, not guarantees.
Landlord ↔ Tenant lean methodology
- Overall (STATE)
- 18 Strongly Tenant-Friendly
- State California
- 18 Strongly Tenant-Friendly · D+13
- County
- — inherits STATE
- City
- — inherits STATE
ZIP-level market 92571
- Home prices YoY
- -9.4%
- Rents YoY
- 7.7%
- Active inventory
- 141
- Price-to-rent
- 5.0×
Monthly cashflow live
- Estimated rent
- $2,664 high interval (Pro) →
- Mortgage (P&I)
- −$834
- Tax est. 1.5%
- −$199 /mo · $2,385/yr
- Insurance
- −$66
- HOA
- −$0
- Vacancy / Maint / Mgmt
- −$560
- Net cashflow
- $1,006
Break-even live
Sensitivity live
| Price | -10% $1,116 | -5% $1,061 | +0% $1,006 | +5% $951 | +10% $896 |
|---|---|---|---|---|---|
| Rent | -10% $796 | -5% $901 | +0% $1,006 | +5% $1,111 | +10% $1,217 |
| Rate | -1.0pp $1,086 | -0.5pp $1,046 | base $1,006 | +0.5pp $965 | +1.0pp $923 |
UW: 25.0% down · 7.5% · 30yr · 1.5% tax · 5.0% vac · 8.0% maint · 8.0% mgmt
Financing live
Cash to close
- Down payment
- $39,750
- Closing costs
- $4,770
- Reserves months
- —
- Total cash needed
- —
Loan-product check · same deal, 3 products live
Conventional
25% down · 7.5% · 30yr
- Down + closing
- —
- Monthly P&I
- —
- Monthly cashflow
- —
- DSCR
- —
- Eligible?
- —
Personal DTI + credit; lowest rate.
DSCR
20% down · 8.5% · 30yr
- Down + closing
- —
- Monthly P&I
- —
- Monthly cashflow
- —
- DSCR
- —
- Eligible?
- —
No personal income docs; deal must DSCR.
Hard money
10% down · 12.0% · 12mo
- Down + closing
- —
- Monthly P&I
- —
- Monthly cashflow
- —
- DSCR
- —
- Eligible?
- —
Short-term bridge; refi at stabilization.
Rent comps 12 comps
| Address | Beds | Baths | Sqft | Rent | $/sqft | DOM | Units | Dist |
|---|---|---|---|---|---|---|---|---|
| 342 Wilkerson Ave Perris, CA | 2.0 | 2.0 | 920 | $1,595 | $1.73 | 0d | 1 | 0.28mi |
| 290 Wilson Ave Perris, CA | 1.0–3.0 | 1.0–2.0 | 875 | $1,950 | $2.23 | 0d | 7 | 0.34mi |
| 768 Wilson Ave Perris, CA | 3.0 | 2.5 | 1500 | $4,500 | $3.00 | 4d | 1 | 0.54mi |
| 1093 Johns Rd Perris, CA | 3.0 | 2.0 | 1100 | $2,500 | $2.27 | 16d | 1 | 0.84mi |
| 154 E 11th St Perris, CA | 3.0 | 2.0 | 1423 | $3,333 | $2.34 | 0d | 1 | 0.94mi |
| 876 S D St Perris, CA | 2.0 | 2.5 | 1300 | $2,395 | $1.84 | 0d | 1 | 0.98mi |
| 1355 S Perris Blvd Perris, CA | 2.0 | 1.0 | 962 | $1,975 | $2.05 | 0d | 1 | 1.01mi |
| 128 Elmtree Dr Perris, CA | 2.0 | 1.0 | 794 | $2,300 | $2.90 | 0d | 1 | 1.36mi |
| 1687 Sycamore St Perris, CA | 3.0 | 2.0 | 1100 | $7,500 | $6.82 | 0d | 1 | 1.44mi |
| 1188 Witt St Perris, CA | 2.0 | 1.0 | 900 | $2,800 | $3.11 | 0d | 1 | 1.45mi |
| 2036 Orchard Dr Perris, CA | 2.0 | 2.0 | 1005 | $2,095 | $2.08 | 4d | 1 | 1.48mi |
| 2036 Orchard Dr Perris, CA | 2.0 | 2.0 | 1005 | $2,095 | $2.08 | 3d | 1 | 1.48mi |
Listing history 17 events
-
2026-06-21days on market $159,000 Active 49 DOM
-
2026-06-18days on market $159,000 Active 46 DOM
-
2026-06-17days on market $159,000 Active 45 DOM
-
2026-06-16days on market $159,000 Active 44 DOM
-
2026-06-15days on market $159,000 Active 43 DOM
-
2026-06-13days on market $159,000 Active 41 DOM
-
2026-06-13days on market $159,000 Active 40 DOM
-
2026-06-09days on market $159,000 Active 37 DOM
-
2026-06-08days on market $159,000 Active 36 DOM
-
2026-06-07days on market $159,000 Active 35 DOM
-
2026-06-04days on market $159,000 Active 32 DOM
-
2026-06-03days on market $159,000 Active 31 DOM
-
2026-06-02days on market $159,000 Active 30 DOM
-
2026-06-01days on market $159,000 Active 29 DOM
-
2026-05-31days on market $159,000 Active 28 DOM
-
2026-05-03$159,000 Active
-
2026-05-01historical $159,000
ⓘ Source: listings_history table (triggers on properties + properties_extension) + one-shot
backfill from property_details.listing_events for pre-trigger history.
Climate risk First Street
- Flood 4/10 Moderate FEMA zone X (unshaded) · 20% chance over 30 yrs
- Wildfire 8/10 Severe
- Heat 7/10 Severe 7 d/yr ≥104°F today · 19 d/yr by 30 yrs out
- Wind 1/10 Low
- Air quality 5/10 Major 8 unhealthy d/yr today · 10 by 30 yrs out
Nearby sold comps map
Loading sold comps map…
Walkable amenities ~0.75 mi
Loading nearby amenities…
Taxation est. · year 1
- Rental income
- $31,972
- − Mortgage interest
- −$8,906
- − Property taxes
- −$2,385
- − Insurance
- −$795
- − Repairs & maintenance
- −$2,558
- − Management
- −$2,558
- − Depreciation
- −$4,625
- Taxable income
- $10,145
- Est. tax owed @ 24.0%
- −$2,435
- After-tax cash flow
- $9,638/yr
For passive investors: Depreciation is non-cash, so a rental often shows a tax loss while cash-flowing — sheltering income. Rental losses are passive: they offset passive income freely, and up to $25,000/yr can offset ordinary (W-2) income if you actively participate and your MAGI is under $100k (phasing out to $0 by $150k); unused losses carry forward. On sale, claimed depreciation is recaptured at up to 25%, and gains may owe capital-gains tax (a 1031 exchange can defer both). Figures are a year-1 estimate at your 24.0% rate — not tax advice; consult a CPA.
Condition & rehab AI · 12 photos
This manufactured home requires moderate repairs and maintenance, with updates to the kitchen, bathrooms, and landscaping to significantly increase its value.
Repairs flagged
- Minor kitchen backsplash — checkered tile
- Minor bathroom fixtures — outdated
- Moderate landscaping — no landscaping
Value-add opportunities
- Both paint interior walls — fresh paint enhances curb appeal and interior
- Both update kitchen backsplash — new backsplash improves aesthetics and functionality
- Both update bathroom fixtures — new fixtures improve aesthetics and functionality
- Both landscaping — landscaping enhances curb appeal and adds value
Renovation cost estimate screening
| Repair item | Severity | Est. cost |
|---|---|---|
| kitchen backsplash · checkered tile | Minor | $500–3,000 |
| bathroom fixtures · outdated | Minor | $500–3,000 |
| landscaping · no landscaping | Moderate | $3,000–15,000 |
| Total estimated repair cost · 3 items | $4,000–21,000 |
Value-add ROI direction
- Both paint interior walls — fresh paint enhances curb appeal and interior ↑
- Both update kitchen backsplash — new backsplash improves aesthetics and functionality ↑
- Both update bathroom fixtures — new fixtures improve aesthetics and functionality ↑
- Both landscaping — landscaping enhances curb appeal and adds value ↑
ⓘ Cost ranges are severity-bucket heuristics (US national rule-of-thumb). Get contractor quotes + a written scope before underwriting a rehab budget.
Schools (NCES district)
- District
- Perris Union High
- NCES district ID
- 0630210
- Math proficiency
- 21% ▲ 2.00%
- Reading proficiency
- 48% ▲ 5.00%
- Median HH income
- $49,210
- Composite
- 29.75/100
- National rank
- #6439
- State rank
- #282 of 517 in CA
Livability — Perris
- Score
- 67/100
- State rank
- #322
- US rank
- #10902
Category grades
Schools grade is shown separately in the Schools card above.
Census & demographics
- Census place
- Perris, CA
- County
- Riverside County · 2,287,001 people
- City population
- 118,178
- Metro
- Riverside-San Bernardino-Ontario, CA
- Population (ZIP)
- 60,096
- Household income
- $92,309
- Rent vs Own
- Severe rent burden
- 1152.0
Population outlook (Riverside County) Hauer SSP2
- Today (2025)
- 2,664,475 people
- By 2030
- 2,802,692 · +5.2%
- By 2040
- 3,050,904 · +14.5%
- By 2050
- 3,256,783 · +22.2%
- By 2075
- 3,655,058 · +37.2%
- By 2100
- 3,766,594 · +41.4%
Race, ethnicity, and origin ACS 2023
- Neighborhood character
- Predominantly Hispanic (78%)
- Race & ethnicity
- Hispanic / Latino 78% Two or more races 18% Black 9% White 8% Asian 3% Native American 1%
- Hispanic origin (detail)
- Mexican 70%
- Common ancestry
- Lithuanian 1%
- Foreign-born
- 30% · Canada, Jamaica
- Languages at home
- 34% English-only · Spanish 62% Tagalog/Filipino 1%
Political lean MEDSL · Riverside
- 2024 margin
- Toss-up / Even · D 48.0% · R 49.3% · Other 2.6%
- 2008→2024 swing
- -3.6pp toward R · 2008: 2.3pp · 2024: -1.3pp
- All cycles
- 2024: R+1.3 2020: D+8.0 2016: D+4.3 2012: R+0.4 2008: D+2.3
Not yet ingested
- Civics
- —
Market trends
- HPI YoY
- ▼ -43.87%
- Current HPI
- 421.3426
- Rent YoY
- ▲ 7.69%
- Metro
- Riverside-San Bernardino-Ontario, CA
- State GDP YoY
- ▲ 3.21%
- F500 in state
- 116
Industry mix (Fortune 500 HQ in CA)
| Industry | F500 HQs | Revenue |
|---|---|---|
| Technology | 27 | $1,492B |
|
||
| Financial Services | 3 | $174B |
|
||
| Retail | 3 | $44B |
|
||
| Insurance | 3 | $26B |
|
||
| Media / Entertainment | 2 | $115B |
|
||
| Pharmaceuticals / Biotech | 2 | $62B |
|
||
Price history
+0.0% since first listed2 events — show timeline
- 2026-05-03 Listed $159,000 CRMLS
- 2026-05-01 Coming Soon $159,000 CRMLS
Cash-flow waterfall
monthlySold comps — $/sqft
last 12 mo · ≤1 miLoading sold comps…