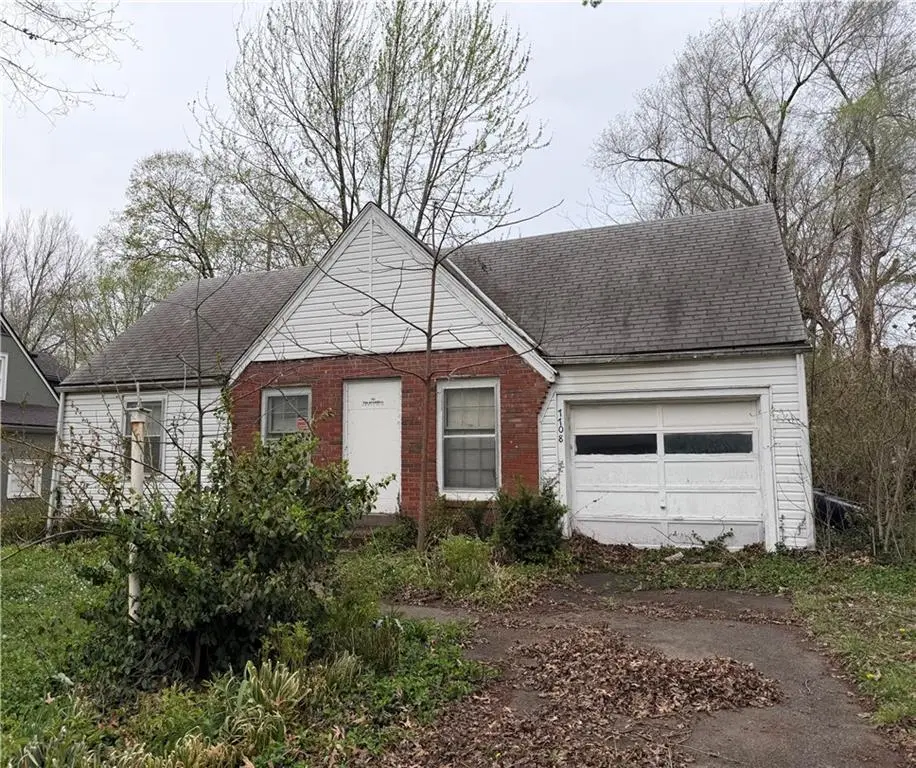
7708 Grand Ave · Kansas City, MO
Flood risk 1/10 · Minimal
- FEMA flood zone
- X (unshaded)
- Chance of flooding over 30 yrs
- 0.0%
- Est. flood insurance / yr
- $507 – $1,088
Fire risk 1/10 · Minimal
- Est. fire insurance / yr
- $1,054 – $1,958
Heat risk 4/10 · Minor
- Hot days now (above 106°F)
- 7 days/yr
- Hot days in 30 yrs
- 17 days/yr
Wind risk 2/10 · Minimal
- Chance of severe wind over 30 yrs
- —
Air-quality risk 3/10 · Minor
- Unhealthy air days now
- 2 days/yr
- Unhealthy air days in 30 yrs
- 4 days/yr
Risk factors via First Street. Map © Google.
Why this score? — see what drove the B- grade
The composite is a weighted blend of 9 inputs, each scored 0–100. Each bar is that input's sub-score; the figure is the points it added to the 100-point composite (weight × sub-score).
- Cash flow +30.0/30.0
- 1% rule +10.0/10.0
- DSCR +10.0/10.0
- ARV discount +7.5/15.0
- Livability +3.9/5.0
- Rent growth +3.6/5.0
- Condition / age +2.5/5.0
- Schools +1.5/10.0
- Appreciation +0.0/10.0
$100,000
🖨 Deal sheet 📄 Offer letter ✓ Due diligence
Listing remarks
Location! Location! Location! Great potential on a great block! CASH ONLY! Quick close wanted. No disclosure-sold as is. No showings-no exception-no trespassing until this property is active in the MLS. DEADLINE FOR OFFERS IS Wednesday April 29th 5:00 pm.
Key facts
- 6,740 sq ft lot
- Garage
- Built 1939
Property features AI
Finance
- Other: Living area reported as 1,434 (public records); Age approximately 76–100 years
Exterior
- Parking: Attached garage (1 car)
- Utilities: Public water; Public sewer; Cable available; Fiber available; High-speed internet available
- Home design: Single-family residence; Residential property; Fixer condition; Attached property; Faces front; 1.5 stories
- Construction: Brick/mortar construction; Composition roof
- Exterior features: Not in a flood plain; Lot approximately 6,740 square feet
Interior
- Bedrooms: 4 bedrooms total; Bedrooms on first and second floors (some on first, some on second)
- Bathrooms: 1 full bathroom
- Heating & cooling: Forced air heating; No central cooling
- Interior features: Full basement; Formal living room; Formal dining area; Main-floor bedroom; Main-floor primary bedroom; 1.5-story floor plan; Has fireplace (1)
Neighborhood map
What this means for you Summary
Snapshot
- This is a 3-bed/1.0-bath single-family listed at $100k.
Deal economics
- At list price, monthly cash flow is $599 ($7k/yr) — positive.
- The deal already cash-flows at list — no discount required.
- Meets the 1% rule at list price ($2k rent vs $100k).
- Cap rate 13.5% vs local median 3.9% in Kansas City — top-decile yield for the area; either an underpriced asset or a hidden risk that comps aren't pricing in. Stress-test before assuming the spread holds.
Location & tenants
- Location reads 78/100 on livability (#28 in MO, #2,671 nationally) — a middle-class / working-renter tenant base. Strengths: amenities A+, commute A+, cost of living A+; Watch: schools C-, crime F.
- Kansas City 33 (urban): math 12% / reading 24% proficiency, ranked #308 of 324 in MO (top 95%) — low school quality limits family demand, transient renter base, plan for 1-2y turnover; 75% free/reduced lunch — lower-income household profile, screen leases tightly.
- Market conditions: Rents rising fast (+4.6%/yr); 174 active listings in the ZIP; 27 comparable units currently listed for rent nearby; rentals at typical pace (median 17d on market — plan ~3-4 weeks tenant-placement turnaround); solid renter incomes; 4,002 units permitted in Jackson County in 2024 (2,271 in 5+ unit buildings).
Forward outlook
- Local home prices are declining (-3.0%/yr); year-one equity from $691 of loan paydown is wiped out by about $3k of value loss. Plan a longer hold.
- Jackson County population projected at +4% by 2050 — modest demand growth; plan on rents tracking national, not racing it.
- At projected returns (-3.0% appreciation + 4.6% rent growth), your $28k cash investment doubles in ~5 years — after that, you're playing with house money.
Negotiation context
- Only 6 days on market — expect competitive offers; lowballing is unlikely to land.
Risks & watch-outs
- Watch-outs: property tax is 3.5% of price; built in 1939 — expect roof / HVAC / electrical / plumbing capex.
Questions for the listing agent
- Built in 1939 — when were the roof, HVAC, electrical panel, plumbing, and water heater last replaced?
- Property tax is high relative to price — has the assessment been appealed recently, and will the sale trigger a re-assessment?
- Is there a deadline driving the sale (1031 exchange, divorce, estate, relocation)? That informs how much negotiation room exists.
- Crime grade is F in this area — have there been break-ins, vandalism, or insurance claims at this property in the last 3 years? What carrier currently insures it and at what premium?
- What's the average days-on-market for RENTAL listings here right now (not sales)? A rising rental-DOM trend means longer vacancies and softer asking-rent achievability than the comps imply.
- What's the recent tenant-quality profile in this submarket — average credit score on applications, eviction rate, late-payment / NSF rate, and stable-employment percentage? A property-management company in the area should have these aggregated.
- How much new for-sale + rental construction is in the pipeline within 1–3 miles? Heavy new supply typically softens prices + rents 12–24 months out; constrained supply supports both.
Investment metrics
- 1% rule
- 1.84% ✓
- Cap rate
- 13.48%
- Cash-on-cash
- 25.69%
- DSCR
- 2.14
- GRM
- 4.5
CMA / ARV
- ARV (on-the-fly)
- $325,518
- Comps found
- 12
Show comp detail 12 sales within ~0.75 mi
| Address | Dist | Beds/Ba | Sqft | Sold | Price | $/sf | Match |
|---|---|---|---|---|---|---|---|
| 7708 Grand Ave | 0.00mi | 4/1.0 (+1) | 1,434 (0%) | 0mo | $100,000 | $70 | 95 |
| 7530 Oak St | 0.24mi | 3/1.0 | 1,455 (+2%) | 0mo | $329,000 | $226 | 86 |
| 7520 Oak St | 0.25mi | 3/2.0 | 1,445 (+1%) | 0mo | $375,000 | $260 | 83 |
| 101 E 80th Ter | 0.43mi | 3/1.0 | 1,508 (+5%) | 1mo | $175,000 | $116 | 71 |
| 243 E 72nd Ter | 0.58mi | 3/1.5 | 1,434 (0%) | 2mo | $384,900 | $268 | 69 |
| 7404 Walnut St | 0.39mi | 3/2.0 | 1,514 (+6%) | 0mo | $349,900 | $231 | 68 |
| 7523 Walnut St | 0.22mi | 3/2.0 | 1,589 (+11%) | 2mo | $360,000 | $227 | 66 |
| 27 W 74th St | 0.43mi | 3/1.0 | 1,321 (-8%) | 1mo | $300,000 | $227 | 66 |
| 1116 E 77th Ter | 0.69mi | 3/2.0 | 1,460 (+2%) | 2mo | $215,000 | $147 | 60 |
| 7148 Oak St | 0.67mi | 3/1.5 | 1,331 (-7%) | 2mo | $379,000 | $285 | 53 |
| 7316 Charlotte St | 0.64mi | 3/2.5 | 1,600 (+12%) | 1mo | $389,900 | $244 | 44 |
| 8210 Mcgee St | 0.64mi | 4/2.0 (+1) | 1,611 (+12%) | 2mo | $314,900 | $195 | 39 |
Match score weights: distance 35% · size 25% · config 20% · recency 20%. Top-matched comps best support the ARV.
Projected returns pro-forma
-3.0% appreciation · 4.57% rent growth · sell at horizon
- IRR
- 21.4%
- Equity multiple
- 1.89×
- Total profit
- $25,047
- Equity at exit
- $14,910
- IRR
- 30.7%
- Equity multiple
- 4.00×
- Total profit
- $83,990
- Equity at exit
- $8,646
Cash invested: $28,000 (down + closing). Projections, not guarantees.
Landlord ↔ Tenant lean methodology
- Overall (STATE)
- 81 Strongly Landlord-Friendly
- State Missouri
- 81 Strongly Landlord-Friendly · R+10
- County
- — inherits STATE
- City
- — inherits STATE
ZIP-level market 64114
- Rents YoY
- 4.6%
- Active inventory
- 174
- Price-to-rent
- 4.5×
Monthly cashflow live
- Estimated rent
- $1,840 high interval (Pro) →
- Mortgage (P&I)
- −$524
- Tax from tax record
- −$288 /mo · $3,457/yr
- Insurance
- −$42
- HOA
- −$0
- Vacancy / Maint / Mgmt
- −$386
- Net cashflow
- $599
Break-even live
UW: 25.0% down · 7.5% · 30yr · 1.5% tax · 5.0% vac · 8.0% maint · 8.0% mgmt
Financing live
Cash to close
- Down payment
- $25,000
- Closing costs
- $3,000
- Reserves months
- —
- Total cash needed
- —
Loan-product check · same deal, 3 products live
Conventional
25% down · 7.5% · 30yr
- Down + closing
- —
- Monthly P&I
- —
- Monthly cashflow
- —
- DSCR
- —
- Eligible?
- —
Personal DTI + credit; lowest rate.
DSCR
20% down · 8.5% · 30yr
- Down + closing
- —
- Monthly P&I
- —
- Monthly cashflow
- —
- DSCR
- —
- Eligible?
- —
No personal income docs; deal must DSCR.
Hard money
10% down · 12.0% · 12mo
- Down + closing
- —
- Monthly P&I
- —
- Monthly cashflow
- —
- DSCR
- —
- Eligible?
- —
Short-term bridge; refi at stabilization.
Rent comps 27 comps
| Address | Beds | Baths | Sqft | Rent | $/sqft | DOM | Units | Dist |
|---|---|---|---|---|---|---|---|---|
| 7524 Baltimore Ave Kansas City, MO | 2.0 | 1.0 | 1000 | $1,300 | $1.30 | 16d | 1 | 0.28mi |
| 320 E 79th Ter Kansas City, MO | 3.0 | 1.0 | 1100 | $1,700 | $1.55 | 44d | 1 | 0.30mi |
| 119 W 79th Ter Kansas City, MO | 3.0 | 2.0 | 1312 | $2,205 | $1.68 | 2d | 1 | 0.36mi |
| 11 W 80th St Kansas City, MO | 4.0 | 3.5 | 1369 | $2,600 | $1.90 | 2d | 1 | 0.38mi |
| 8104 McGee St Kansas City, MO | 2.0 | 1.0 | 1100 | $1,350 | $1.23 | 24d | 1 | 0.51mi |
| 7919 Jefferson St Kansas City, MO | 3.0 | 1.0 | 1388 | $1,950 | $1.40 | 14d | 1 | 0.57mi |
| 7425 Pennsylvania Ave Kansas City, MO | 3.0 | 2.0 | 1000 | $1,695 | $1.70 | 7d | 1 | 0.58mi |
| 8101 Campbell St Kansas City, MO | 2.0 | 1.0 | 820 | $888 | $1.08 | 2d | 1 | 0.70mi |
| 8150 Troost Ave Unit 53 Kansas City, MO | 2.0 | 1.0 | 900 | $1,200 | $1.33 | 44d | 1 | 0.79mi |
| 822 E 72nd St Kansas City, MO | 3.0 | 3.0 | 1800 | $2,400 | $1.33 | 21d | 1 | 0.87mi |
| 7610 Terrace St Kansas City, MO | 2.0 | 1.0 | 1000 | $1,525 | $1.52 | 44d | 1 | 0.99mi |
| 7544 Terrace St Unit 7544TER Kansas City, MO | 2.0 | 1.0 | 1000 | $1,525 | $1.52 | 44d | 1 | 0.99mi |
| 7528 Terrace St Unit 7528TER Kansas City, MO | 2.0 | 1.0 | 1000 | $1,525 | $1.52 | 44d | 1 | 1.01mi |
| 8419 Pennsylvania Ave Kansas City, MO | 3.0 | 1.0 | 1200 | $1,650 | $1.38 | 14d | 1 | 1.01mi |
| 803 W 84th St Kansas City, MO | 2.0 | 1.0 | 950 | $1,095 | $1.15 | 20d | 1 | 1.05mi |
| 421 W 87 Pl Kansas City, MO | 3.0 | 1.0 | 1056 | $1,195 | $1.13 | 16d | 1 | 1.24mi |
| 1830 E 78th St Kansas City, MO | 3.0 | 1.0 | 1000 | $1,350 | $1.35 | 12d | 1 | 1.24mi |
| 8700 Wornall Rd Kansas City, MO | 1.0–3.0 | 1.0 | 836 | $1,195 | $1.43 | 15d | 3 | 1.25mi |
| 1827 E 75th Ter Kansas City, MO | 3.0 | 1.5 | 1700 | $1,595 | $0.94 | 16d | 1 | 1.26mi |
| 8701 Chestnut Cir Kansas City, MO | 1.0–2.0 | 1.0–2.0 | 925 | $1,115 | $1.21 | 2d | 15 | 1.27mi |
| 1836 E 77th St Kansas City, MO | 2.0 | 1.0 | 1200 | $1,150 | $0.96 | 21d | 1 | 1.27mi |
| 6720 Holmes Rd Kansas City, MO | 3.0 | 3.0 | 1552 | $2,695 | $1.74 | 44d | 1 | 1.30mi |
| 7543 Booth Dr Prairie Village, KS | 3.0 | 2.0 | 1360 | $2,445 | $1.80 | 24d | 1 | 1.30mi |
| 2311 W 79th St Prairie Village, KS | 2.0 | 1.0 | 1050 | $2,300 | $2.19 | 12d | 1 | 1.30mi |
| 8400 State Line Rd Leawood, KS | 4.0 | 3.0 | 1855 | $2,899 | $1.56 | 2d | 1 | 1.37mi |
| 2504 W 76th St Prairie Village, KS | 3.0 | 1.0 | 950 | $1,900 | $2.00 | 17d | 1 | 1.43mi |
| 7632 Rainbow Dr Prairie Village, KS | 3.0 | 1.0 | 1139 | $1,900 | $1.67 | 24d | 1 | 1.47mi |
Listing history 4 events
-
2026-05-01status Pending
-
2026-04-25$100,000 Active
-
2026-04-04historical $100,000
-
1989-11-01soldstatus
ⓘ Source: listings_history table (triggers on properties + properties_extension) + one-shot
backfill from property_details.listing_events for pre-trigger history.
Tax reassessment forecast MO · Resets to sale price
- Current annual tax
- $3,457 · $288/mo
- Projected year-2 tax
- $3,457 · $288/mo
- Expected delta
- $0/yr ($0/mo · 0.0%)
ⓘ Screening estimate from a state-policy table — verify with the county assessor before closing.
Climate risk First Street
- Flood 1/10 Low FEMA zone X (unshaded) · 0% chance over 30 yrs
- Wildfire 1/10 Low
- Heat 4/10 Moderate 7 d/yr ≥106°F today · 17 d/yr by 30 yrs out
- Wind 2/10 Low
- Air quality 3/10 Moderate 2 unhealthy d/yr today · 4 by 30 yrs out
Nearby sold comps map
Loading sold comps map…
Walkable amenities ~0.75 mi
Loading nearby amenities…
Taxation est. · year 1
- Rental income
- $22,079
- − Mortgage interest
- −$5,602
- − Property taxes
- −$3,457
- − Insurance
- −$500
- − Repairs & maintenance
- −$1,766
- − Management
- −$1,766
- − Depreciation
- −$2,909
- Taxable income
- $6,078
- Est. tax owed @ 24.0%
- −$1,459
- After-tax cash flow
- $5,733/yr
For passive investors: Depreciation is non-cash, so a rental often shows a tax loss while cash-flowing — sheltering income. Rental losses are passive: they offset passive income freely, and up to $25,000/yr can offset ordinary (W-2) income if you actively participate and your MAGI is under $100k (phasing out to $0 by $150k); unused losses carry forward. On sale, claimed depreciation is recaptured at up to 25%, and gains may owe capital-gains tax (a 1031 exchange can defer both). Figures are a year-1 estimate at your 24.0% rate — not tax advice; consult a CPA.
Schools (NCES district)
- District
- Kansas City 33
- NCES district ID
- 2916400
- Math proficiency
- 12% ▼ -8.00%
- Reading proficiency
- 24% ▬ 0.00%
- Median HH income
- $35,227
- Composite
- 14.8/100
- National rank
- #9387
- State rank
- #308 of 324 in MO
Livability — Kansas City
- Score
- 78/100
- State rank
- #28
- US rank
- #2671
Category grades
Schools grade is shown separately in the Schools card above.
Census & demographics
- Census place
- Kansas City, MO
- County
- Jackson County · 687,798 people
- City population
- 439,467
- Metro
- Kansas City, MO-KS
- Population (ZIP)
- 24,229
- Household income
- $81,275
- Rent vs Own
- Severe rent burden
- 851.0
Population outlook (Jackson County) Hauer SSP2
- Today (2025)
- 719,589 people
- By 2030
- 731,456 · +1.6%
- By 2040
- 746,689 · +3.8%
- By 2050
- 749,289 · +4.1%
- By 2075
- 736,227 · +2.3%
- By 2100
- 668,210 · -7.1%
Race, ethnicity, and origin ACS 2023
- Neighborhood character
- Predominantly White (75%)
- Race & ethnicity
- White 75% Black 11% Two or more races 8% Hispanic / Latino 7% Asian 3%
- Hispanic origin (detail)
- Mexican 5%
- Common ancestry
- Lithuanian 3% Italian 3% Romanian 2%
- Foreign-born
- 4% · Canada
- Languages at home
- 93% English-only · Spanish 3% Other Indo-European 2%
Political lean MEDSL · Jackson
- 2024 margin
- D (+19.3) · D 58.9% · R 39.5% · Other 1.6%
- 2008→2024 swing
- -6.1pp toward R · 2008: 25.4pp · 2024: 19.3pp
- All cycles
- 2024: D+19.3 2020: D+22.0 2016: D+16.6 2012: D+19.0 2008: D+25.4
Not yet ingested
- Civics
- —
Market trends
- HPI YoY
- ▼ -311.24%
- Current HPI
- 280.5587
- Rent YoY
- ▲ 4.57%
- Metro
- Kansas City, MO-KS
- State GDP YoY
- ▲ 1.84%
- F500 in state
- 20
Industry mix (Fortune 500 HQ in MO)
| Industry | F500 HQs | Revenue |
|---|---|---|
| Healthcare | 1 | $163B |
|
||
| Insurance | 1 | $21B |
|
||
| Industrial Technology | 1 | $17B |
|
||
| Retail | 1 | $16B |
|
||
| Industrial Distribution | 1 | $10B |
|
||
| Utilities | 1 | $9B |
|
||
Price history
+0.0% since first listed4 events — show timeline
- 2026-05-01 Pending — Heartland MLS as Distributed by MLS Grid
- 2026-04-25 Listed $100,000 Heartland MLS as Distributed by MLS Grid
- 2026-04-04 Coming Soon $100,000 Heartland MLS as Distributed by MLS Grid
- 1989-11-01 Sold (Public Records) — Public Records
Property tax history
+8.2%/yrLatest (2025): $3,457 · +8.2% YoY. Source: county tax records.
Cash-flow waterfall
monthlySold comps — $/sqft
last 12 mo · ≤1 miLoading sold comps…