120 N Commercial St · Winchester, IL
Flood risk 1/10 · Minimal
- FEMA flood zone
- X (unshaded)
- Chance of flooding over 30 yrs
- 0.0%
- Est. flood insurance / yr
- $507 – $1,088
Fire risk 1/10 · Minimal
- Est. fire insurance / yr
- $804 – $1,492
Heat risk 4/10 · Minor
- Hot days now (above 106°F)
- 7 days/yr
- Hot days in 30 yrs
- 19 days/yr
Wind risk 2/10 · Minimal
- Chance of severe wind over 30 yrs
- 2.0%
Air-quality risk 1/10 · Minimal
- Unhealthy air days now
- 0 days/yr
- Unhealthy air days in 30 yrs
- 0 days/yr
Risk factors via First Street. Map © Google.
Why this score? — see what drove the C+ grade
The composite is a weighted blend of 9 inputs, each scored 0–100. Each bar is that input's sub-score; the figure is the points it added to the 100-point composite (weight × sub-score).
- Cash flow +25.9/30.0
- DSCR +8.7/10.0
- 1% rule +7.4/10.0
- Appreciation +6.5/10.0
- Livability +3.4/5.0
- Rent growth +2.5/5.0
- Condition / age +2.5/5.0
- Schools +2.4/10.0
- ARV discount +1.8/15.0
$89,900
🖨 Deal sheet 📄 Offer letter ✓ Due diligence
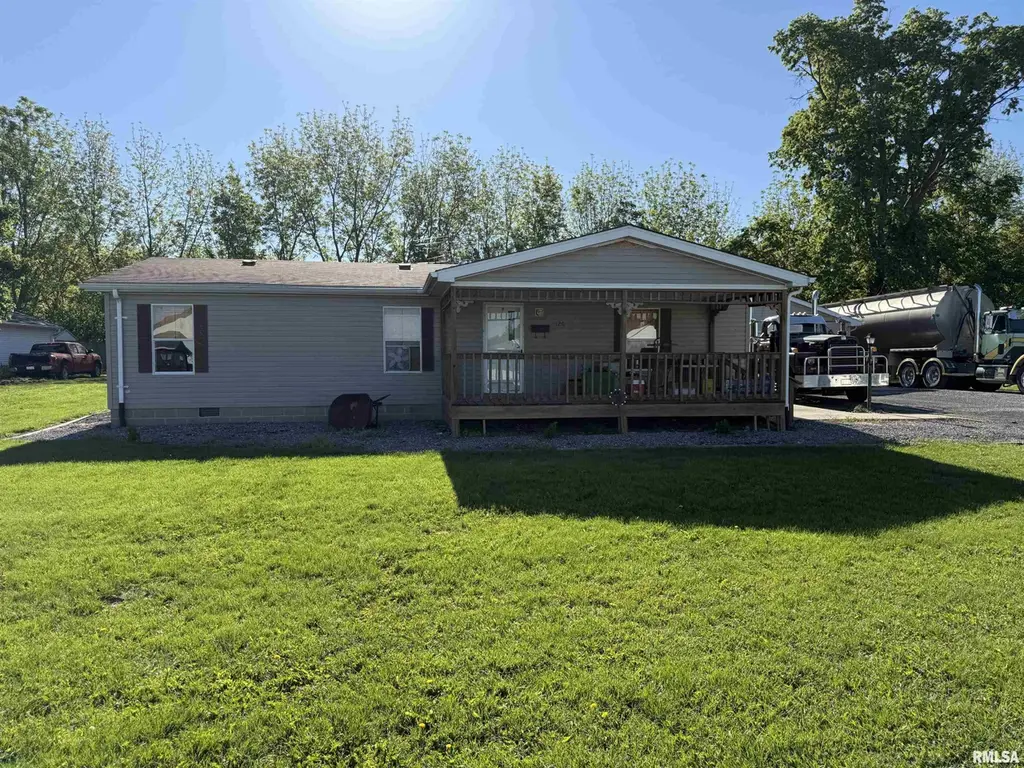
Listing remarks
Spacious and move-in ready 3 bedroom, 2 bathroom home with a warm rustic-modern feel and exceptional exterior functionality. Inside, you’ll find custom wood accents, large open-concept living spaces, generously sized bedrooms, updated flooring, and an oversized kitchen with extensive cabinetry and workspace. The primary bedroom delivers a cozy lodge-style atmosphere with custom finishes throughout. The exterior is equally impressive, featuring a detached garage, oversized gravel drive, and substantial parking capacity ideal for trucks, trailers, equipment, RVs, or hobby use. Relax on the covered front porch while enjoying the quiet small-town setting. Hard-to-find combination of comfo
Key facts
- Covered front porch
- Extensive cabinetry
- Custom wood accents
Tags
Property features AI
Exterior
- Parking: Detached 2-car garage; Gravel driveway/parking
- Utilities: Public water; Public sewer
- Home design: Single family residence; Double wide body type; 1996 construction; One main story with upper, lower, basement and additional levels noted; Shingle roof
- Construction: Built in 1996; Double wide construction; Crawl space basement
- Exterior features: Level lot; Roads paved; some other road surface noted
Interior
- Kitchen: Dishwasher; Refrigerator
- Bedrooms: 3 bedrooms; Bedroom 1 on main level (13.25 x 12.5) with egress window; Bedroom 2 on main level (12.5 x 9.5) with egress window; Bedroom 3 on main level (11 x 9.25) with egress window
- Flooring: Luxury vinyl plank throughout main living areas and bedrooms
- Bathrooms: 1 full bathroom
- Heating & cooling: Forced air heating; Gas water heater; Central air conditioning
- Interior features: Vaulted/cathedral/tray ceilings; Ceiling fan(s)
- Laundry & utility: Main level laundry
Neighborhood map
What this means for you Summary
Snapshot
- This is a 3-bed/1.0-bath other listed at $90k.
Deal economics
- At list price, monthly cash flow is $220 ($3k/yr) — positive.
- The deal already cash-flows at list — no discount required.
- Meets the 1% rule at list price ($1k rent vs $90k).
Location & tenants
- Location reads 68/100 on livability (#474 in IL) — a middle-class / working-renter tenant base. Strengths: crime A+, cost of living A+, housing A+; Watch: amenities F, commute F, health & safety F.
- Winchester CUSD 1 (rural): math 26% / reading 29% proficiency, ranked #281 of 620 in IL (top 45%) — low school quality limits family demand, transient renter base, plan for 1-2y turnover.
- Zoned schools: Winchester High School (math 5% / reading 15%, grade F, #528 of 693 statewide, top 82%, 165 students, 0% FRL) — zoned schools average 0% FRL vs 36% district-wide (36 pts lower); this property's tenant base skews higher-income than the district average.
- Zoned-school proficiency averages 10% at this address vs 28% district-wide (-18 pts) — the specific schools serving this property underperform the Winchester CUSD 1 average; the district grade overstates school quality for this exact location.
- Market conditions: 8 active listings in the ZIP.
Forward outlook
- In year one you build about $3k of equity ($622 loan paydown + $3k appreciation (3.1% local appreciation)).
- Scott County population projected at -27% by 2050 — secular population decline; favor cash flow + early exit over multi-decade hold.
- At projected returns (3.1% appreciation + 3.0% rent growth), your $25k cash investment doubles in ~4 years — after that, you're playing with house money.
- By year 10, paydown + projected appreciation supports a ~$33k cash-out refi (75% LTV) — recoverable capital for the next deal without selling this one.
Negotiation context
- Only 1 days on market — expect competitive offers; lowballing is unlikely to land.
- Current owner paid $62k; 45% above their basis — modest negotiation headroom, anchor on the comps not their cost.
Questions for the listing agent
- Is there a deadline driving the sale (1031 exchange, divorce, estate, relocation)? That informs how much negotiation room exists.
- Schools are D-rated, which usually means shorter tenancies and higher turnover. Who's the typical renter profile here, and what's been the actual vacancy rate?
- What's the average days-on-market for RENTAL listings here right now (not sales)? A rising rental-DOM trend means longer vacancies and softer asking-rent achievability than the comps imply.
- What's the recent tenant-quality profile in this submarket — average credit score on applications, eviction rate, late-payment / NSF rate, and stable-employment percentage? A property-management company in the area should have these aggregated.
- How much new for-sale + rental construction is in the pipeline within 1–3 miles? Heavy new supply typically softens prices + rents 12–24 months out; constrained supply supports both.
Investment metrics
- 1% rule
- 1.24% ✓
- Cap rate
- 9.23%
- Cash-on-cash
- 10.48%
- DSCR
- 1.47
- GRM
- 6.7
CMA / ARV
- ARV (median comp)
- $79,801
- List price
- $89,900
- Delta
- 12.66%
- Verdict
- OVERPRICED
- Comps
- 20 within 1.0 mi
Projected returns pro-forma
3.07% appreciation · 3.0% rent growth · sell at horizon
- IRR
- 17.5%
- Equity multiple
- 2.00×
- Total profit
- $25,189
- Equity at exit
- $40,763
- IRR
- 18.9%
- Equity multiple
- 3.77×
- Total profit
- $69,725
- Equity at exit
- $63,086
Cash invested: $25,172 (down + closing). Projections, not guarantees.
Landlord ↔ Tenant lean methodology
- Overall (STATE)
- 43 Moderately Tenant-Leaning
- State Illinois
- 43 Moderately Tenant-Leaning · D+7
- County
- — inherits STATE
- City
- — inherits STATE
ZIP-level market 62694
- Home prices YoY
- 4.5%
- Active inventory
- 8
- Price-to-rent
- 6.7×
Monthly cashflow live
- Estimated rent
- $1,114 medium interval (Pro) →
- Mortgage (P&I)
- −$471
- Tax from tax record
- −$151 /mo · $1,812/yr
- Insurance
- −$37
- HOA
- −$0
- Vacancy / Maint / Mgmt
- −$234
- Net cashflow
- $220
Break-even live
UW: 25.0% down · 7.5% · 30yr · 1.5% tax · 5.0% vac · 8.0% maint · 8.0% mgmt
Financing live
Cash to close
- Down payment
- $22,475
- Closing costs
- $2,697
- Reserves months
- —
- Total cash needed
- —
Loan-product check · same deal, 3 products live
Conventional
25% down · 7.5% · 30yr
- Down + closing
- —
- Monthly P&I
- —
- Monthly cashflow
- —
- DSCR
- —
- Eligible?
- —
Personal DTI + credit; lowest rate.
DSCR
20% down · 8.5% · 30yr
- Down + closing
- —
- Monthly P&I
- —
- Monthly cashflow
- —
- DSCR
- —
- Eligible?
- —
No personal income docs; deal must DSCR.
Hard money
10% down · 12.0% · 12mo
- Down + closing
- —
- Monthly P&I
- —
- Monthly cashflow
- —
- DSCR
- —
- Eligible?
- —
Short-term bridge; refi at stabilization.
Listing history 4 events
-
2026-05-16status Pending 820-char remark
-
2026-05-14$89,900 Active 820-char remark
-
2021-06-04soldstatus $62,000
-
2007-02-23soldstatus $57,000
ⓘ Source: listings_history table (triggers on properties + properties_extension) + one-shot
backfill from property_details.listing_events for pre-trigger history.
Tax reassessment forecast IL · Partial reset (capped growth)
- Current annual tax
- $1,812 · $151/mo
- Projected year-2 tax
- $1,926 · $161/mo
- Expected delta
- +$115/yr (+$10/mo · 6.3%)
ⓘ Screening estimate from a state-policy table — verify with the county assessor before closing.
Climate risk First Street
- Flood 1/10 Low FEMA zone X (unshaded) · 0% chance over 30 yrs
- Wildfire 1/10 Low
- Heat 4/10 Moderate 7 d/yr ≥106°F today · 19 d/yr by 30 yrs out
- Wind 2/10 Low 2% chance of damaging wind over 30 yrs
- Air quality 1/10 Low 0 unhealthy d/yr today · 0 by 30 yrs out
Nearby sold comps map
Loading sold comps map…
Walkable amenities ~0.75 mi
Loading nearby amenities…
Taxation est. · year 1
- Rental income
- $13,362
- − Mortgage interest
- −$5,036
- − Property taxes
- −$1,812
- − Insurance
- −$450
- − Repairs & maintenance
- −$1,069
- − Management
- −$1,069
- − Depreciation
- −$2,615
- Taxable income
- $1,312
- Est. tax owed @ 24.0%
- −$315
- After-tax cash flow
- $2,323/yr
For passive investors: Depreciation is non-cash, so a rental often shows a tax loss while cash-flowing — sheltering income. Rental losses are passive: they offset passive income freely, and up to $25,000/yr can offset ordinary (W-2) income if you actively participate and your MAGI is under $100k (phasing out to $0 by $150k); unused losses carry forward. On sale, claimed depreciation is recaptured at up to 25%, and gains may owe capital-gains tax (a 1031 exchange can defer both). Figures are a year-1 estimate at your 24.0% rate — not tax advice; consult a CPA.
Schools (NCES district)
- District
- Winchester CUSD 1
- NCES district ID
- 1742660
- Math proficiency
- 26% ▼ -3.00%
- Reading proficiency
- 29% ▼ -5.00%
- Median HH income
- $47,710
- Composite
- 23.9/100
- National rank
- #7792
- State rank
- #281 of 620 in IL
Livability — Winchester
- Score
- 68/100
- State rank
- #474
- US rank
- #9790
Category grades
Schools grade is shown separately in the Schools card above.
Census & demographics
- Census place
- Winchester, IL
- Population (ZIP)
- 2,944
Population outlook (Scott County) Hauer SSP2
- Today (2025)
- 4,701 people
- By 2030
- 4,451 · -5.3%
- By 2040
- 3,970 · -15.5%
- By 2050
- 3,445 · -26.7%
- By 2075
- 2,371 · -49.6%
- By 2100
- 1,506 · -68.0%
Race, ethnicity, and origin ACS 2023
- Neighborhood character
- Predominantly White (97%)
- Race & ethnicity
- White 97% Two or more races 2%
- Common ancestry
- Italian 4% Romanian 2% Portuguese 1%
- Foreign-born
- 1%
- Languages at home
- 99% English-only · Other Indo-European 1% Spanish 1%
Political lean MEDSL · Scott
- 2024 margin
- Solid R (+61.2) · D 18.9% · R 80.0% · Other 1.1%
- 2008→2024 swing
- -47.1pp toward R · 2008: -14.0pp · 2024: -61.2pp
- All cycles
- 2024: R+61.2 2020: R+56.3 2016: R+55.6 2012: R+26.5 2008: R+14.0
Not yet ingested
- Civics
- —
Market trends
- HPI YoY
- ▲ 3.07%
- Current HPI
- 71.3116
- Rent YoY
- —
- Metro
- —
- State GDP YoY
- ▲ 1.59%
- F500 in state
- 60
Industry mix (Fortune 500 HQ in IL)
| Industry | F500 HQs | Revenue |
|---|---|---|
| Insurance | 4 | $201B |
|
||
| Consumer Goods | 4 | $87B |
|
||
| Industrial Machinery | 3 | $64B |
|
||
| Healthcare | 2 | $55B |
|
||
| Retail / Pharmacy | 1 | $148B |
|
||
| Agriculture / Food | 1 | $86B |
|
||
Price history
+57.7% since first listed4 events — show timeline
- 2026-05-16 Pending — RMLSA as Distributed by MLS Grid
- 2026-05-14 Listed $89,900 RMLSA as Distributed by MLS Grid
- 2021-06-04 Sold (Public Records) $62,000 Public Records
- 2007-02-23 Sold (Public Records) $57,000 Public Records
Property tax history
+1.7%/yrLatest (2024): $1,812 · +9.4% YoY. Source: county tax records.
Cash-flow waterfall
monthlySold comps — $/sqft
last 12 mo · ≤1 miLoading sold comps…