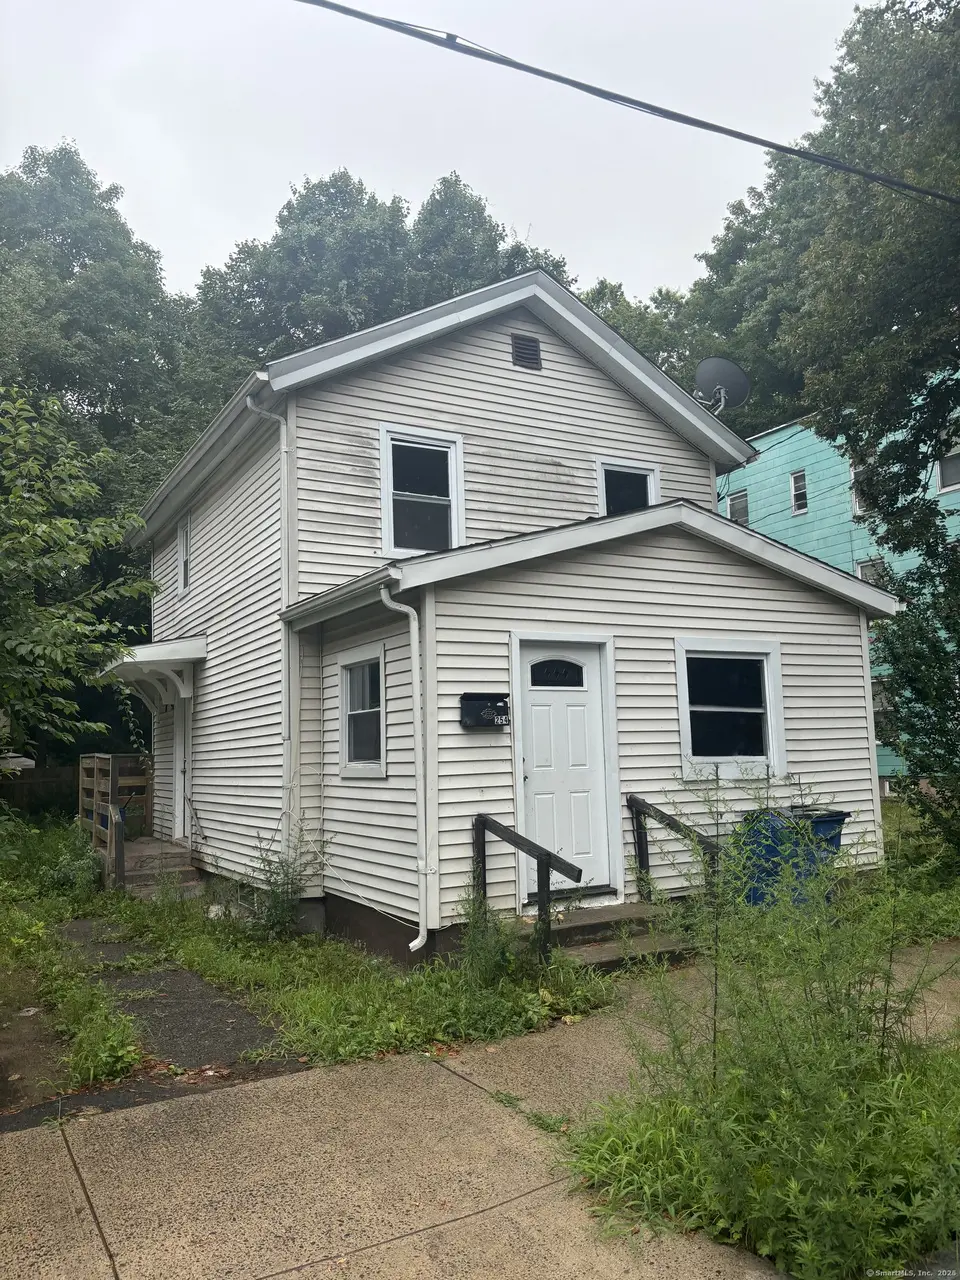
254 Starr St · New Haven, CT
Flood risk 1/10 · Minimal
- FEMA flood zone
- X (unshaded)
- Chance of flooding over 30 yrs
- 0.0%
- Est. flood insurance / yr
- $473 – $860
Fire risk 1/10 · Minimal
- Est. fire insurance / yr
- $829 – $1,539
Heat risk 7/10 · Major
- Hot days now (above 99°F)
- 7 days/yr
- Hot days in 30 yrs
- 16 days/yr
Wind risk 6/10 · Moderate
- Chance of severe wind over 30 yrs
- 51.0%
Air-quality risk 5/10 · Moderate
- Unhealthy air days now
- 6 days/yr
- Unhealthy air days in 30 yrs
- 8 days/yr
Risk factors via First Street. Map © Google.
Why this score? — see what drove the C grade
The composite is a weighted blend of 9 inputs, each scored 0–100. Each bar is that input's sub-score; the figure is the points it added to the 100-point composite (weight × sub-score).
- Cash flow +18.5/30.0
- ARV discount +15.0/15.0
- DSCR +5.8/10.0
- 1% rule +5.3/10.0
- Livability +4.0/5.0
- Rent growth +3.2/5.0
- Condition / age +2.5/5.0
- Schools +1.5/10.0
- Appreciation +0.0/10.0
$195,000
🖨 Deal sheet 📄 Offer letter ✓ Due diligence
Listing remarks MLS
Opportunity awaits in Newhallville! This 2-bedroom, 1-bath home offers strong potential for renovation and value creation. Hardwood floors, an eat-in kitchen, and a functional layout with bedrooms on the upper level provide a solid starting point for improvements. A spacious fenced backyard and off-street parking add to the appeal, all set on a quiet residential street. Ideal for investors or owner-occupants looking to build equity. Conveniently located near Yale, Albertus Magnus College, shopping, and public transportation. Property to be sold as-is.
Key facts
- Fenced backyard
- Off-street parking
- 3,049 sq ft lot
Tags
Neighborhood map
What this means for you Summary
Snapshot
- This is a 2-bed/1.0-bath single-family listed at $195k.
Deal economics
- At list price, monthly cash flow is $186 ($2k/yr) — positive.
- The deal already cash-flows at list — no discount required.
- Meets the 1% rule at list price ($2k rent vs $195k).
- Recommended offer: $172k (12.0% below list) — sets the bar for market timing.
- Cap rate 7.4% vs local median 4.8% in New Haven — top-decile yield for the area; either an underpriced asset or a hidden risk that comps aren't pricing in. Stress-test before assuming the spread holds.
Location & tenants
- Location reads 79/100 on livability (#31 in CT, #2,190 nationally) — a middle-class / working-renter tenant base. Strengths: amenities A+, commute A+, health & safety A+; Watch: schools D+, employment D, crime F.
- New Haven School District (urban): math 12% / reading 25% proficiency, ranked #147 of 153 in CT (top 96%) — low school quality limits family demand, transient renter base, plan for 1-2y turnover; 66% free/reduced lunch — lower-income household profile, screen leases tightly.
- Market conditions: Rents rising (+2.6%/yr); 137 active listings in the ZIP; 40 comparable units currently listed for rent nearby; rentals at typical pace (median 24d on market — plan ~3-4 weeks tenant-placement turnaround); 48% of comp listings sitting > 30 days — soft ceiling on asking rent; 1,059 units permitted in South Central Connecticut Planning Region in 2024 (779 in 5+ unit buildings).
- This rent runs 40% of the median local income ($60k/yr) — at the standard rent-burdened threshold; future hikes will face affordability resistance.
Forward outlook
- Local home prices are declining (-3.0%/yr); year-one equity from $1k of loan paydown is wiped out by about $6k of value loss. Plan a longer hold.
Negotiation context
- It's been on market 126 days — a 12% lower offer ($172k) is reasonable based on typical stale-listing flexibility.
- 7 sale attempts since 9y ago with the ask held roughly flat each time — persistent listings suggest the price (not the market) is what's stuck; bring a comps-based counter.
- Current owner paid $35k; list at $195k implies a 457% gain — meaningful room to come down on a strong offer.
Risks & watch-outs
- Watch-outs: built in 1890 — expect roof / HVAC / electrical / plumbing capex.
- Climate carrying-cost: major wind risk, 51% chance of damaging wind over 30y; extreme-heat days projected 7→16/yr by 2055 (HVAC capex compounding) — expect insurance premiums to compound above CPI over the hold.
Questions for the listing agent
- It's been on market 126 days. Have you received any prior offers? Is the seller open to a 12% concession, seller financing, or rate buy-down credit?
- Built in 1890 — when were the roof, HVAC, electrical panel, plumbing, and water heater last replaced?
- Why hasn't it sold? Are there any deal-killer items the seller is aware of (foundation, flood, title, zoning, code violations)?
- Is there a deadline driving the sale (1031 exchange, divorce, estate, relocation)? That informs how much negotiation room exists.
- Schools are D-rated, which usually means shorter tenancies and higher turnover. Who's the typical renter profile here, and what's been the actual vacancy rate?
- Crime grade is F in this area — have there been break-ins, vandalism, or insurance claims at this property in the last 3 years? What carrier currently insures it and at what premium?
- What's the average days-on-market for RENTAL listings here right now (not sales)? A rising rental-DOM trend means longer vacancies and softer asking-rent achievability than the comps imply.
- What's the recent tenant-quality profile in this submarket — average credit score on applications, eviction rate, late-payment / NSF rate, and stable-employment percentage? A property-management company in the area should have these aggregated.
- How much new for-sale + rental construction is in the pipeline within 1–3 miles? Heavy new supply typically softens prices + rents 12–24 months out; constrained supply supports both.
Investment metrics
- 1% rule
- 1.03% ✓
- Cap rate
- 7.44%
- Cash-on-cash
- 4.09%
- DSCR
- 1.18
- GRM
- 8.1
CMA / ARV
- ARV (median comp)
- $251,541
- List price
- $195,000
- Delta
- -22.48%
- Verdict
- UNDERPRICED
- Comps
- 20 within 1.0 mi
Show comp detail 11 sales within ~0.75 mi
| Address | Dist | Beds/Ba | Sqft | Sold | Price | $/sf | Match |
|---|---|---|---|---|---|---|---|
| 255 Starr St | 0.02mi | 3/1.0 (+1) | 968 (+1%) | 5mo | $160,000 | $165 | 88 |
| 39 Edwards St | 0.59mi | 2/1.0 | 930 (-3%) | 6mo | $160,000 | $172 | 63 |
| 118 Cherry Ann St | 0.68mi | 2/1.0 | 992 (+4%) | 0mo | $250,000 | $252 | 62 |
| 13 West Read St | 0.40mi | 2/1.5 | 978 (+2%) | 19mo | $230,000 | $235 | 60 |
| 74 Shepard St | 0.40mi | 3/2.0 (+1) | 936 (-2%) | 20mo | $205,000 | $219 | 52 |
| 272 Goodrich St | 0.50mi | 3/1.0 (+1) | 999 (+4%) | 21mo | $230,000 | $230 | 46 |
| 246 Sheffield Ave | 0.37mi | 3/2.0 (+1) | 1,080 (+13%) | 9mo | $345,000 | $319 | 44 |
| 472 Shelton Ave | 0.56mi | 3/2.0 (+1) | 996 (+4%) | 22mo | $263,700 | $265 | 40 |
| 37 Watson St | 0.37mi | 3/1.5 (+1) | 1,056 (+10%) | 23mo | $291,000 | $276 | 39 |
| 32 Alling St | 0.56mi | 3/2.0 (+1) | 1,092 (+14%) | 14mo | $320,000 | $293 | 29 |
| 60 Bowen St | 0.73mi | 3/1.0 (+1) | 864 (-10%) | 20mo | $269,000 | $311 | 28 |
Match score weights: distance 35% · size 25% · config 20% · recency 20%. Top-matched comps best support the ARV.
Projected returns pro-forma
-3.0% appreciation · 2.6% rent growth · sell at horizon
- IRR
- -10.3%
- Equity multiple
- 0.62×
- Total profit
- $-20,492
- Equity at exit
- $29,075
- IRR
- -1.5%
- Equity multiple
- 0.90×
- Total profit
- $-5,611
- Equity at exit
- $16,860
Cash invested: $54,600 (down + closing). Projections, not guarantees.
Landlord ↔ Tenant lean methodology
- Overall (STATE)
- 27 Tenant-Leaning
- State Connecticut
- 27 Tenant-Leaning · D+7
- County
- — inherits STATE
- City
- — inherits STATE
ZIP-level market 06511
- Home prices YoY
- -20.8%
- Rents YoY
- 2.6%
- Active inventory
- 137
- Price-to-rent
- 8.1×
Monthly cashflow live
- Estimated rent
- $2,001 high interval (Pro) →
- Mortgage (P&I)
- −$1,023
- Tax from tax record
- −$291 /mo · $3,492/yr
- Insurance
- −$81
- HOA
- −$0
- Vacancy / Maint / Mgmt
- −$420
- Net cashflow
- $186
Break-even live
UW: 25.0% down · 7.5% · 30yr · 1.5% tax · 5.0% vac · 8.0% maint · 8.0% mgmt
Financing live
Cash to close
- Down payment
- $48,750
- Closing costs
- $5,850
- Reserves months
- —
- Total cash needed
- —
Loan-product check · same deal, 3 products live
Conventional
25% down · 7.5% · 30yr
- Down + closing
- —
- Monthly P&I
- —
- Monthly cashflow
- —
- DSCR
- —
- Eligible?
- —
Personal DTI + credit; lowest rate.
DSCR
20% down · 8.5% · 30yr
- Down + closing
- —
- Monthly P&I
- —
- Monthly cashflow
- —
- DSCR
- —
- Eligible?
- —
No personal income docs; deal must DSCR.
Hard money
10% down · 12.0% · 12mo
- Down + closing
- —
- Monthly P&I
- —
- Monthly cashflow
- —
- DSCR
- —
- Eligible?
- —
Short-term bridge; refi at stabilization.
Rent comps 40 comps
| Address | Beds | Baths | Sqft | Rent | $/sqft | DOM | Units | Dist |
|---|---|---|---|---|---|---|---|---|
| 235 Starr St New Haven, CT | 3.0 | 1.0 | 1100 | $2,175 | $1.98 | 14d | 1 | 0.02mi |
| 57 Thompson St Unit 1R New Haven, CT | 1.0 | 1.0 | 700 | $1,450 | $2.07 | 43d | 1 | 0.10mi |
| 145 Starr St New Haven, CT | 2.0 | 1.0 | 678 | $1,600 | $2.36 | 43d | 1 | 0.17mi |
| 145 Starr St Unit 3 New Haven, CT | 2.0 | 1.0 | 678 | $1,600 | $2.36 | 23d | 1 | 0.17mi |
| 40 Lilac St Unit 3 New Haven, CT | 3.0 | 1.0 | 1100 | $1,600 | $1.45 | 43d | 1 | 0.21mi |
| 310 W Division St Unit 1R New Haven, CT | 2.0 | 1.0 | 850 | $1,500 | $1.76 | 23d | 1 | 0.26mi |
| 624 Dixwell Ave Unit 1 New Haven, CT | 3.0 | 1.0 | 958 | $1,650 | $1.72 | 19d | 1 | 0.28mi |
| 402 Huntington St Unit 2 New Haven, CT | 3.0 | 1.0 | 1108 | $1,800 | $1.62 | 23d | 1 | 0.32mi |
| 201 Munson St New Haven, CT | 3.0 | 1.0–2.5 | 941 | $3,770 | $4.00 | 2d | 120 | 0.35mi |
| 35 Goodyear St Unit 2 New Haven, CT | 2.0 | 1.0 | 750 | $1,750 | $2.33 | 43d | 1 | 0.35mi |
| 705 Dixwell Ave Unit 1R New Haven, CT | 2.0 | 1.0 | 930 | $1,650 | $1.77 | 19d | 1 | 0.37mi |
| 301 Winchester Ave New Haven, CT | 3.0 | 1.0–2.0 | 890 | $3,718 | $4.18 | 2d | 96 | 0.38mi |
| 312 Huntington St New Haven, CT | 3.0 | 1.0 | 1100 | $1,950 | $1.77 | 14d | 1 | 0.38mi |
| 312 Huntington St Unit 3 New Haven, CT | 3.0 | 1.0 | 1000 | $1,750 | $1.75 | 43d | 1 | 0.39mi |
| 250 Bassett St Unit 3rd floor New Haven, CT | 2.0 | 1.0 | 960 | $1,900 | $1.98 | 43d | 1 | 0.39mi |
| 77 Shepard St Unit 1 New Haven, CT | 2.0 | 1.0 | 664 | $1,625 | $2.45 | 23d | 1 | 0.41mi |
| 77 Shepard St Unit 1 New Haven, CT | 2.0 | 1.0 | 664 | $1,625 | $2.45 | 19d | 1 | 0.41mi |
| 550 Prospect St #8 New Haven, CT | 2.0 | 1.5 | 1000 | $2,450 | $2.45 | 43d | 1 | 0.43mi |
| 280 Bassett St New Haven, CT | 2.0 | 1.0 | 1000 | $1,500 | $1.50 | 43d | 1 | 0.43mi |
| 500 Prospect St Unit 2A New Haven, CT | 2.0 | 1.0 | 1099 | $2,950 | $2.68 | 43d | 1 | 0.44mi |
| 570 Prospect St New Haven, CT | 1.0 | 1.0 | 725 | $1,395 | $1.92 | 43d | 1 | 0.44mi |
| 440 Prospect St #2 New Haven, CT | 1.0 | 1.0 | 625 | $1,850 | $2.96 | 43d | 1 | 0.47mi |
| 118 Shepard St Unit 2 R New Haven, CT | 2.0 | 1.0 | 595 | $1,650 | $2.77 | 2d | 1 | 0.48mi |
| 48 Daisy St Unit 2 New Haven, CT | 3.0 | 1.0 | 810 | $1,900 | $2.35 | 23d | 1 | 0.49mi |
| 84 Munson St Unit 2 New Haven, CT | 1.0 | 1.0 | 800 | $1,700 | $2.12 | 23d | 1 | 0.52mi |
| 30 Tilton St Unit 2 New Haven, CT | 2.0 | 1.0 | 800 | $1,950 | $2.44 | 43d | 1 | 0.58mi |
| 38 Tilton St Unit 423-L New Haven, CT | 3.0 | 1.0 | 1071 | $1,895 | $1.77 | 43d | 1 | 0.58mi |
| 963 Sherman Ave Unit 2ND New Haven, CT | 3.0 | 1.0 | 1000 | $1,800 | $1.80 | 23d | 1 | 0.62mi |
| 37 Woodland St Unit 1 New Haven, CT | 3.0 | 1.0 | 912 | $2,400 | $2.63 | 43d | 1 | 0.62mi |
| 37 Woodland St Unit 2 New Haven, CT | 3.0 | 1.0 | 996 | $2,400 | $2.41 | 3d | 1 | 0.62mi |
| 141 County St Unit 2 New Haven, CT | 2.0 | 1.0 | 695 | $1,700 | $2.45 | 43d | 1 | 0.69mi |
| 141 County St New Haven, CT | 2.0 | 1.0 | 695 | $1,700 | $2.45 | 2d | 1 | 0.69mi |
| 28 Compton St Unit 1 New Haven, CT | 3.0 | 1.0 | 1100 | $2,700 | $2.45 | 43d | 1 | 0.72mi |
| 110 W Easton St Hamden, CT | 3.0 | 1.0 | 975 | $2,500 | $2.56 | 43d | 1 | 0.74mi |
| 492 Whitney Ave Unit 4C New Haven, CT | 2.0 | 1.0 | 1060 | $2,600 | $2.45 | 23d | 1 | 0.75mi |
| 550 Whitney Ave Unit 2 New Haven, CT | 1.0 | 1.0 | 550 | $1,725 | $3.14 | 23d | 1 | 0.77mi |
| 570 Whitney Ave Unit L3 New Haven, CT | 1.0 | 1.0 | 820 | $1,925 | $2.35 | 43d | 1 | 0.78mi |
| 382 Whitney Ave New Haven, CT | 1.0 | 1.0 | 550 | $1,800 | $3.27 | 43d | 1 | 0.80mi |
| 382 Whitney Ave Unit 14 New Haven, CT | 1.0 | 1.0 | 550 | $1,800 | $3.27 | 11d | 1 | 0.80mi |
| 572 Whitney Ave Unit 3E New Haven, CT | 1.0 | 1.0 | 800 | $1,750 | $2.19 | 14d | 1 | 0.80mi |
Listing history 36 events
-
2026-06-18days on market $195,000 Active 126 DOM
-
2026-06-17days on market $195,000 Active 125 DOM
-
2026-06-16days on market $195,000 Active 124 DOM
-
2026-06-15days on market $195,000 Active 123 DOM
-
2026-06-14days on market $195,000 Active 121 DOM
-
2026-06-13days on market $195,000 Active 120 DOM
-
2026-06-10days on market $195,000 Active 118 DOM
-
2026-06-09days on market $195,000 Active 117 DOM
-
2026-06-08days on market $195,000 Active 116 DOM
-
2026-06-07pricedays on market $195,000 Active 115 DOM
-
2026-06-05days on market $200,000 Active 112 DOM
-
2026-06-03days on market $200,000 Active 111 DOM
-
2026-06-03days on market $200,000 Active 110 DOM
-
2026-06-01days on market $200,000 Active 109 DOM
-
2026-05-31days on market $200,000 Active 108 DOM
-
2026-02-11$200,000 Active 557-char remark
Show marketing remark (557 chars)
Opportunity awaits in Newhallville! This 2-bedroom, 1-bath home offers strong potential for renovation and value creation. Hardwood floors, an eat-in kitchen, and a functional layout with bedrooms on the upper level provide a solid starting point for improvements. A spacious fenced backyard and off-street parking add to the appeal, all set on a quiet residential street. Ideal for investors or owner-occupants looking to build equity. Conveniently located near Yale, Albertus Magnus College, shopping, and public transportation. Property to be sold as-is.
-
2026-01-31historical
-
2025-12-01status Active
-
2025-12-01historical
-
2025-11-28price $210,000
-
2025-08-29$238,000 Active
-
2025-08-27historical
-
2025-06-26price $250,000
-
2025-06-13$254,000 Active
-
2025-05-31historical
-
2024-12-19price $254,000
-
2024-12-03price $255,000
-
2024-11-04price $260,000
-
2024-10-16price $266,000
-
2024-07-27$270,000 Active
-
2024-07-23historical
-
2024-03-26price $270,000
-
2024-02-09$275,000 Active
-
2018-01-19soldstatus $35,000 Closed
-
2017-12-23historical
-
2017-09-25$34,900 Active
ⓘ Source: listings_history table (triggers on properties + properties_extension) + one-shot
backfill from property_details.listing_events for pre-trigger history.
Tax reassessment forecast CT · Partial reset (capped growth)
- Current annual tax
- $3,492 · $291/mo
- Projected year-2 tax
- $3,832 · $319/mo
- Expected delta
- +$340/yr (+$28/mo · 9.8%)
ⓘ Screening estimate from a state-policy table — verify with the county assessor before closing.
Climate risk First Street
- Flood 1/10 Low FEMA zone X (unshaded) · 0% chance over 30 yrs
- Wildfire 1/10 Low
- Heat 7/10 Severe 7 d/yr ≥99°F today · 16 d/yr by 30 yrs out
- Wind 6/10 Major 51% chance of damaging wind over 30 yrs
- Air quality 5/10 Major 6 unhealthy d/yr today · 8 by 30 yrs out
Nearby sold comps map
Loading sold comps map…
Walkable amenities ~0.75 mi
Loading nearby amenities…
Taxation est. · year 1
- Rental income
- $24,014
- − Mortgage interest
- −$10,923
- − Property taxes
- −$3,492
- − Insurance
- −$975
- − Repairs & maintenance
- −$1,921
- − Management
- −$1,921
- − Depreciation
- −$5,673
- Taxable loss
- −$891
- Est. tax savings @ 24.0%
- +$214
- After-tax cash flow
- $2,446/yr
For passive investors: Depreciation is non-cash, so a rental often shows a tax loss while cash-flowing — sheltering income. Rental losses are passive: they offset passive income freely, and up to $25,000/yr can offset ordinary (W-2) income if you actively participate and your MAGI is under $100k (phasing out to $0 by $150k); unused losses carry forward. On sale, claimed depreciation is recaptured at up to 25%, and gains may owe capital-gains tax (a 1031 exchange can defer both). Figures are a year-1 estimate at your 24.0% rate — not tax advice; consult a CPA.
Schools (NCES district)
- District
- New Haven School District
- NCES district ID
- 0902790
- Math proficiency
- 12% ▼ -10.00%
- Reading proficiency
- 25% ▼ -10.00%
- Median HH income
- $38,058
- Composite
- 15.48/100
- National rank
- #9308
- State rank
- #147 of 153 in CT
Livability — New Haven
- Score
- 79/100
- State rank
- #31
- US rank
- #2190
Category grades
Schools grade is shown separately in the Schools card above.
Census & demographics
- Census place
- New Haven, CT
- County
- New Haven County · 688,236 people
- City population
- 132,813
- Metro
- New Haven-Milford, CT
- Population (ZIP)
- 54,730
- Household income
- $59,969
- Rent vs Own
- Severe rent burden
- 4999.0
Population outlook (South Central Connecticut County) Hauer SSP2
- By 2040
- 608,362
Race, ethnicity, and origin ACS 2023
- Neighborhood character
- Highly diverse neighborhood (Simpson 0.73)
- Race & ethnicity
- Black 34% White 32% Hispanic / Latino 21% Two or more races 8% Asian 7%
- Hispanic origin (detail)
- Mexican 4% Puerto Rican 10% Dominican 2%
- Common ancestry
- Romanian 2% Lithuanian 1% Russian 1%
- Foreign-born
- 17% · Canada, China, South Korea
- Languages at home
- 74% English-only · Spanish 15% Chinese 3% Other Indo-European 2%
Political lean MEDSL · South Central Connecticut
- 2024 margin
- Strong D (+20.1) · D 59.0% · R 38.9% · Other 2.1%
- All cycles
- 2024: D+20.1
Not yet ingested
- Civics
- —
Market trends
- HPI YoY
- ▼ -86.05%
- Current HPI
- 328.1353
- Rent YoY
- ▲ 2.60%
- Metro
- New Haven-Milford, CT
- State GDP YoY
- ▲ 1.06%
- F500 in state
- 38
Industry mix (Fortune 500 HQ in CT)
| Industry | F500 HQs | Revenue |
|---|---|---|
| Industrial Machinery | 4 | $38B |
|
||
| Insurance | 3 | $71B |
|
||
| Financial Services | 2 | $25B |
|
||
| Transportation / Logistics | 2 | $18B |
|
||
| Healthcare | 1 | $247B |
|
||
| Telecommunications | 1 | $55B |
|
||
Price history
+473.1% since first listed21 events — show timeline
- 2026-02-11 Listed $200,000 Smart MLS
- 2026-01-31 Listing Removed — Smart MLS
- 2025-12-01 Relisted — Smart MLS
- 2025-12-01 Listing Removed — Smart MLS
- 2025-11-28 Price Changed $210,000 Smart MLS
- 2025-08-29 Listed $238,000 Smart MLS
- 2025-08-27 Listing Removed — Smart MLS
- 2025-06-26 Price Changed $250,000 Smart MLS
- 2025-06-13 Listed $254,000 Smart MLS
- 2025-05-31 Listing Removed — Smart MLS
- 2024-12-19 Price Changed $254,000 Smart MLS
- 2024-12-03 Price Changed $255,000 Smart MLS
- 2024-11-04 Price Changed $260,000 Smart MLS
- 2024-10-16 Price Changed $266,000 Smart MLS
- 2024-07-27 Listed $270,000 Smart MLS
- 2024-07-23 Listing Removed — Smart MLS
- 2024-03-26 Price Changed $270,000 Smart MLS
- 2024-02-09 Listed $275,000 Smart MLS
- 2018-01-19 Sold (MLS) $35,000 Smart MLS
- 2017-12-23 Listing Removed — Smart MLS
- 2017-09-25 Listed $34,900 Smart MLS
Property tax history
+5.5%/yrLatest (2023): $3,492 · -6.4% YoY. Source: county tax records.
Cash-flow waterfall
monthlySold comps — $/sqft
last 12 mo · ≤1 miLoading sold comps…