340 E Spring St · Bloomfield, IN
Flood risk 1/10 · Minimal
- FEMA flood zone
- X (unshaded)
- Chance of flooding over 30 yrs
- 0.0%
- Est. flood insurance / yr
- $473 – $860
Fire risk 3/10 · Minor
- Est. fire insurance / yr
- $717 – $1,331
Heat risk 4/10 · Minor
- Hot days now (above 106°F)
- 7 days/yr
- Hot days in 30 yrs
- 18 days/yr
Wind risk 2/10 · Minimal
- Chance of severe wind over 30 yrs
- 1.0%
Air-quality risk 3/10 · Minor
- Unhealthy air days now
- 2 days/yr
- Unhealthy air days in 30 yrs
- 3 days/yr
Risk factors via First Street. Map © Google.
Why this score? — see what drove the C grade
The composite is a weighted blend of 9 inputs, each scored 0–100. Each bar is that input's sub-score; the figure is the points it added to the 100-point composite (weight × sub-score).
- Cash flow +20.7/30.0
- ARV discount +12.2/15.0
- DSCR +6.6/10.0
- 1% rule +4.4/10.0
- Livability +3.7/5.0
- Appreciation +3.6/10.0
- Schools +3.2/10.0
- Rent growth +2.5/5.0
- Condition / age +2.5/5.0
$179,900
🖨 Deal sheet 📄 Offer letter ✓ Due diligence
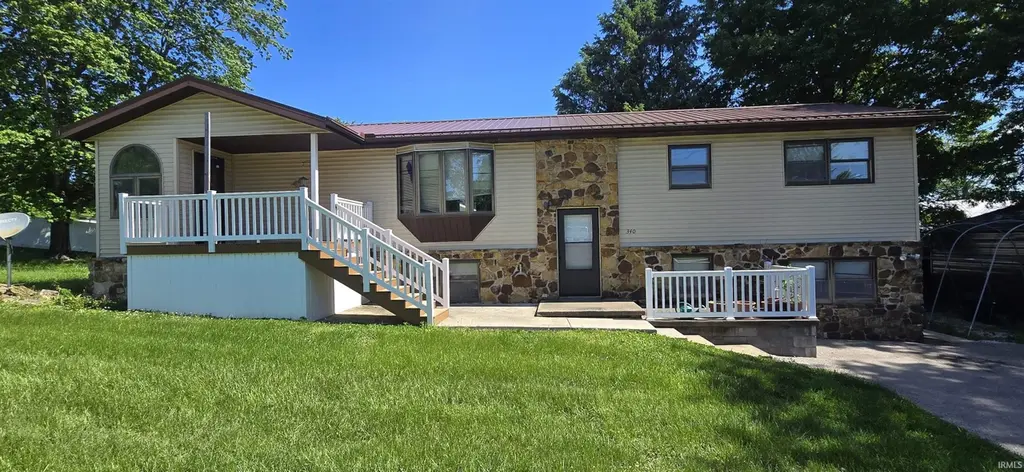
Listing remarks
Spacious opportunity in the heart of Bloomfield! This 4-bedroom, 2 full bath home offers over 2,800 square feet of living space, providing plenty of room to spread out and make it your own. Inside, you’ll find both a comfortable living room and a separate family room, complete with a fireplace that adds warmth and character. One of the bathrooms has been recently updated, and the home also features a newer metal roof, offering a solid start for your improvements. With generous storage throughout and a flexible layout, this property is ideal for buyers looking to add value and customize a home to their taste. While the home does need some TLC and updates, it presents a great opportunit
Key facts
- 0.3 acre lot
- Built 1977
- Listed 35 days
Property features AI
Exterior
- Utilities: Public water; Public sewer; Electric service
- Home design: Single-family, site-built home
- Construction: Vinyl siding; Block foundation
- Exterior features: Corner lot; Outbuilding on the property; Lot dimensions approximately 110 x 145
Interior
- Kitchen: Microwave; Refrigerator; Electric oven
- Bathrooms: Two full bathrooms; One full bathroom on the main level
- Heating & cooling: Electric forced-air heating; Central air conditioning
- Interior features: Finished basement with walk-out access; Crawl space; Wood-burning fireplace in the basement
- Laundry & utility: Washer and dryer; Laundry located on the lower level; Electric water heater
Neighborhood map
What this means for you Summary
Snapshot
- This is a 3-bed/2.0-bath single-family listed at $180k.
Deal economics
- At list price, monthly cash flow is $242 ($3k/yr) — positive.
- The deal already cash-flows at list — no discount required.
- To meet the 1% rule (rent ≥ 1% of price), the offer needs to be $169k (6.1% below list).
- Recommended offer: $169k (6.1% below list) — sets the bar for 1% rule.
Location & tenants
- Location reads 73/100 on livability (#96 in IN) — a middle-class / working-renter tenant base. Strengths: crime A+, cost of living A+, housing A+; Watch: amenities F, commute F.
- Bloomfield School District (town): math 33% / reading 41% proficiency, ranked #169 of 301 in IN (top 56%) — families likely to look elsewhere, expect single-tenant / working-renter base with shorter leases.
- Zoned schools: Bloomfield Elementary School (math 30% / reading 34%, grade F, #652 of 994 statewide, top 68%, 457 students, 51% FRL); Bloomfield Middle School (168 students, 51% FRL); Bloomfield High School (math 37% / reading 52%, grade F, #169 of 369 statewide, top 51%, 233 students, 40% FRL) — zoned schools average 47% FRL vs 32% district-wide (15 pts higher); higher-poverty schools than district average — tighter screening recommended.
- Market conditions: 53 active listings in the ZIP.
Forward outlook
- Local home prices are declining (-2.8%/yr); year-one equity from $1k of loan paydown is wiped out by about $5k of value loss. Plan a longer hold.
- Greene County population projected at -22% by 2050 — secular population decline; favor cash flow + early exit over multi-decade hold.
Negotiation context
- It's been on market 35 days — a 3% lower offer ($175k) is reasonable based on typical stale-listing flexibility.
Questions for the listing agent
- It's been on market 35 days. Have you received any prior offers? Is the seller open to a 6% concession, seller financing, or rate buy-down credit?
- Built in 1977 — when were the roof, HVAC, electrical panel, plumbing, and water heater last replaced?
- Is there a deadline driving the sale (1031 exchange, divorce, estate, relocation)? That informs how much negotiation room exists.
- Schools are D-rated, which usually means shorter tenancies and higher turnover. Who's the typical renter profile here, and what's been the actual vacancy rate?
- What's the average days-on-market for RENTAL listings here right now (not sales)? A rising rental-DOM trend means longer vacancies and softer asking-rent achievability than the comps imply.
- What's the recent tenant-quality profile in this submarket — average credit score on applications, eviction rate, late-payment / NSF rate, and stable-employment percentage? A property-management company in the area should have these aggregated.
- How much new for-sale + rental construction is in the pipeline within 1–3 miles? Heavy new supply typically softens prices + rents 12–24 months out; constrained supply supports both.
Investment metrics
- 1% rule
- 0.94% ✗
- Cap rate
- 7.91%
- Cash-on-cash
- 5.77%
- DSCR
- 1.26
- GRM
- 8.9
CMA / ARV
- ARV (median comp)
- $201,033
- List price
- $179,900
- Delta
- -10.51%
- Verdict
- UNDERPRICED
- Comps
- 20 within 1.0 mi
Show comp detail 1 sale within ~0.75 mi
| Address | Dist | Beds/Ba | Sqft | Sold | Price | $/sf | Match |
|---|---|---|---|---|---|---|---|
| 21 W Mechanic St | 0.46mi | 3/3.0 | 2,882 (+1%) | 0mo | $290,000 | $101 | 73 |
Match score weights: distance 35% · size 25% · config 20% · recency 20%. Top-matched comps best support the ARV.
Projected returns pro-forma
-2.84% appreciation · 3.0% rent growth · sell at horizon
- IRR
- -6.7%
- Equity multiple
- 0.75×
- Total profit
- $-12,593
- Equity at exit
- $28,110
- IRR
- 2.6%
- Equity multiple
- 1.19×
- Total profit
- $9,645
- Equity at exit
- $17,773
Cash invested: $50,372 (down + closing). Projections, not guarantees.
Landlord ↔ Tenant lean methodology
- Overall (STATE)
- 90 Strongly Landlord-Friendly
- State Indiana
- 90 Strongly Landlord-Friendly · R+11
- County
- — inherits STATE
- City
- — inherits STATE
ZIP-level market 47424
- Home prices YoY
- -1.3%
- Active inventory
- 53
- Price-to-rent
- 8.9×
Monthly cashflow live
- Estimated rent
- $1,690 medium interval (Pro) →
- Mortgage (P&I)
- −$943
- Tax from tax record
- −$74 /mo · $893/yr
- Insurance
- −$75
- HOA
- −$0
- Vacancy / Maint / Mgmt
- −$355
- Net cashflow
- $242
Break-even live
UW: 25.0% down · 7.5% · 30yr · 1.5% tax · 5.0% vac · 8.0% maint · 8.0% mgmt
Financing live
Cash to close
- Down payment
- $44,975
- Closing costs
- $5,397
- Reserves months
- —
- Total cash needed
- —
Loan-product check · same deal, 3 products live
Conventional
25% down · 7.5% · 30yr
- Down + closing
- —
- Monthly P&I
- —
- Monthly cashflow
- —
- DSCR
- —
- Eligible?
- —
Personal DTI + credit; lowest rate.
DSCR
20% down · 8.5% · 30yr
- Down + closing
- —
- Monthly P&I
- —
- Monthly cashflow
- —
- DSCR
- —
- Eligible?
- —
No personal income docs; deal must DSCR.
Hard money
10% down · 12.0% · 12mo
- Down + closing
- —
- Monthly P&I
- —
- Monthly cashflow
- —
- DSCR
- —
- Eligible?
- —
Short-term bridge; refi at stabilization.
Listing history 7 events
-
2026-06-07statusdays on market $179,900 Pending 35 DOM
-
2026-06-04days on market $179,900 Active 34 DOM
-
2026-06-02days on market $179,900 Active 33 DOM
-
2026-06-01days on market $179,900 Active 32 DOM
-
2026-05-31days on market $179,900 Active 31 DOM
-
2026-05-31days on market $179,900 Active 30 DOM
-
2026-04-30$179,900 Active 860-char remark
ⓘ Source: listings_history table (triggers on properties + properties_extension) + one-shot
backfill from property_details.listing_events for pre-trigger history.
Tax reassessment forecast IN · Partial reset (capped growth)
- Current annual tax
- $893 · $74/mo
- Projected year-2 tax
- $1,211 · $101/mo
- Expected delta
- +$318/yr (+$26/mo · 35.6%)
ⓘ Screening estimate from a state-policy table — verify with the county assessor before closing.
Climate risk First Street
- Flood 1/10 Low FEMA zone X (unshaded) · 0% chance over 30 yrs
- Wildfire 3/10 Moderate
- Heat 4/10 Moderate 7 d/yr ≥106°F today · 18 d/yr by 30 yrs out
- Wind 2/10 Low 100% chance of damaging wind over 30 yrs
- Air quality 3/10 Moderate 2 unhealthy d/yr today · 3 by 30 yrs out
Nearby sold comps map
Loading sold comps map…
Walkable amenities ~0.75 mi
Loading nearby amenities…
Taxation est. · year 1
- Rental income
- $20,276
- − Mortgage interest
- −$10,077
- − Property taxes
- −$893
- − Insurance
- −$900
- − Repairs & maintenance
- −$1,622
- − Management
- −$1,622
- − Depreciation
- −$5,233
- Taxable loss
- −$71
- Est. tax savings @ 24.0%
- +$17
- After-tax cash flow
- $2,922/yr
For passive investors: Depreciation is non-cash, so a rental often shows a tax loss while cash-flowing — sheltering income. Rental losses are passive: they offset passive income freely, and up to $25,000/yr can offset ordinary (W-2) income if you actively participate and your MAGI is under $100k (phasing out to $0 by $150k); unused losses carry forward. On sale, claimed depreciation is recaptured at up to 25%, and gains may owe capital-gains tax (a 1031 exchange can defer both). Figures are a year-1 estimate at your 24.0% rate — not tax advice; consult a CPA.
Schools (NCES district)
- District
- Bloomfield School District
- NCES district ID
- 1800600
- Math proficiency
- 33% ▼ -11.00%
- Reading proficiency
- 41% ▼ -4.00%
- Median HH income
- $50,351
- Composite
- 32.01/100
- National rank
- #5828
- State rank
- #169 of 301 in IN
Livability — Bloomfield
- Score
- 73/100
- State rank
- #96
- US rank
- #5394
Category grades
Schools grade is shown separately in the Schools card above.
Census & demographics
- Census place
- Bloomfield, IN
- Population (ZIP)
- 8,620
Population outlook (Greene County) Hauer SSP2
- Today (2025)
- 30,724 people
- By 2030
- 29,506 · -4.0%
- By 2040
- 26,744 · -13.0%
- By 2050
- 23,879 · -22.3%
- By 2075
- 18,341 · -40.3%
- By 2100
- 13,976 · -54.5%
Race, ethnicity, and origin ACS 2023
- Neighborhood character
- Predominantly White (96%)
- Race & ethnicity
- White 96% Two or more races 2%
- Common ancestry
- Italian 2% Iranian 2% Slovak 2%
- Foreign-born
- 0%
Political lean MEDSL · Greene
- 2024 margin
- Solid R (+53.7) · D 22.4% · R 76.1% · Other 1.6%
- 2008→2024 swing
- -39.2pp toward R · 2008: -14.5pp · 2024: -53.7pp
- All cycles
- 2024: R+53.7 2020: R+52.2 2016: R+53.4 2012: R+31.4 2008: R+14.5
Not yet ingested
- Civics
- —
Market trends
- HPI YoY
- ▼ -2.84%
- Current HPI
- 208.554
- Rent YoY
- —
- Metro
- —
- State GDP YoY
- ▲ 2.90%
- F500 in state
- 18
Industry mix (Fortune 500 HQ in IN)
| Industry | F500 HQs | Revenue |
|---|---|---|
| Industrial Machinery | 2 | $37B |
|
||
| Healthcare | 1 | $177B |
|
||
| Pharmaceuticals | 1 | $45B |
|
||
| Metals / Steel | 1 | $18B |
|
||
| Agriculture | 1 | $17B |
|
||
| Packaging | 1 | $12B |
|
||
Price history
2 events — show timeline
- 2026-06-04 Pending — IRMLS
- 2026-04-30 Listed $179,900 IRMLS
Property tax history
-0.9%/yrLatest (2025): $893 · +2.0% YoY. Source: county tax records.
Cash-flow waterfall
monthlySold comps — $/sqft
last 12 mo · ≤1 miLoading sold comps…