5157 185th St W · Farmington, MN
Flood risk 1/10 · Minimal
- FEMA flood zone
- X (unshaded)
- Chance of flooding over 30 yrs
- 0.0%
- Est. flood insurance / yr
- $507 – $1,088
Fire risk 1/10 · Minimal
- Est. fire insurance / yr
- $888 – $1,650
Heat risk 2/10 · Minimal
- Hot days now (above 99°F)
- 7 days/yr
- Hot days in 30 yrs
- 14 days/yr
Wind risk 2/10 · Minimal
- Chance of severe wind over 30 yrs
- —
Air-quality risk 2/10 · Minimal
- Unhealthy air days now
- 1 days/yr
- Unhealthy air days in 30 yrs
- 1 days/yr
Risk factors via First Street. Map © Google.
Why this score? — see what drove the D grade
The composite is a weighted blend of 9 inputs, each scored 0–100. Each bar is that input's sub-score; the figure is the points it added to the 100-point composite (weight × sub-score).
- ARV discount +15.0/15.0
- Cash flow +8.1/30.0
- Schools +4.4/10.0
- Livability +3.8/5.0
- Rent growth +2.5/5.0
- Condition / age +2.5/5.0
- 1% rule +2.1/10.0
- DSCR +2.1/10.0
- Appreciation +0.0/10.0
$344,900
🖨 Deal sheet 📄 Offer letter ✓ Due diligence
Listing remarks MLS
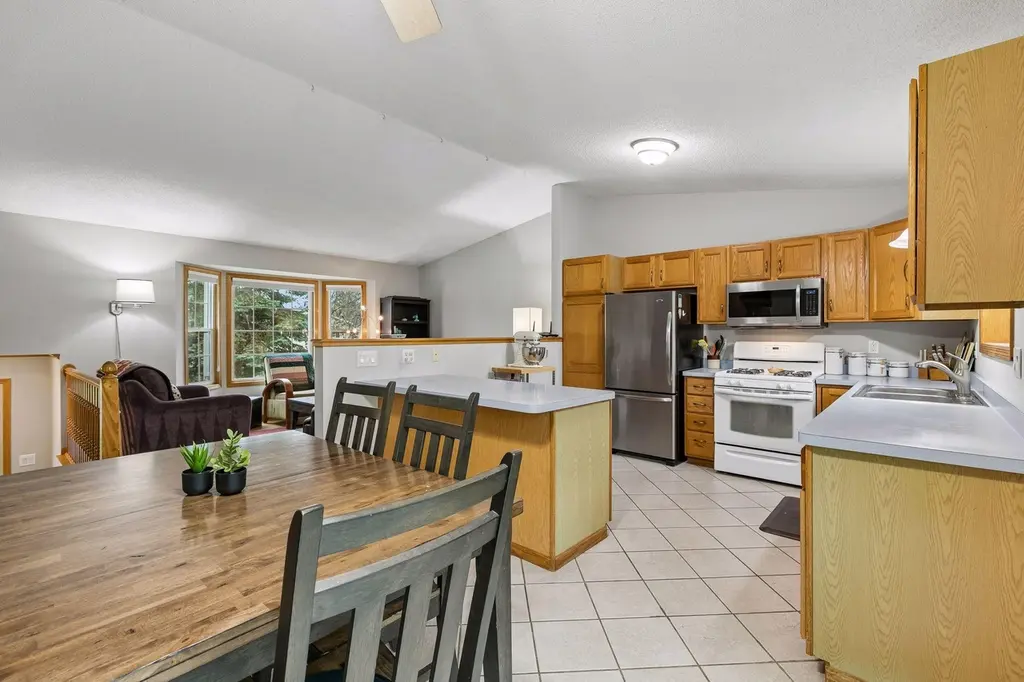
Move right in and enjoy this beautifully maintained 4 bedroom/2 bath home with tons of updates! New hardwood floors, ceramic tile, light fixtures, crown moldings, and lower level carpet-just to name a few! See supplement for more details.
Key facts
- 6,011 sq ft lot
- 2 garage spots
- Built 1995
Property features AI
Exterior
- Parking: Attached garage with garage door opener (2-car)
- Utilities: City water connected; City sewer connected; Natural gas fuel; Electric with circuit breakers
- Home design: Residential split-entry (bi-level) design; Pitched roof
- Construction: Block construction; Block foundation
- Exterior features: Deck; Full yard fencing; Metal and vinyl exterior; Light tree coverage; Public transit within six blocks; City street with curbs and paved streets; public maintained road
Interior
- Kitchen: Kitchen with breakfast bar and kitchen window; Eat-in kitchen / informal dining area
- Bedrooms: 4 bedrooms (includes a main floor bedroom); Bedroom sizes include 15x11, 14x11, 13x11, 11x9 (various levels)
- Bathrooms: 1 full bathroom on the main floor; 1 three-quarter bathroom in the basement
- Heating & cooling: Forced air heating; Central air conditioning
- Interior features: Ceiling fans; Vaulted ceilings; Natural woodwork; Washer/dryer hookup; Finished daylight/ look-out basement with egress windows
- Laundry & utility: Laundry on lower level; Washer and dryer included; Gas water heater
Neighborhood map
What this means for you Summary
Snapshot
- This is a 3-bed/2.0-bath single-family listed at $345k.
Deal economics
- At list price, monthly cash flow is $-339 ($-4k/yr) — negative.
- To cash-flow at today's rent, offer at most $285k (17.3% below list).
- To meet the 1% rule (rent ≥ 1% of price), the offer needs to be $244k (29.3% below list).
- Recommended offer: $244k (29.3% below list) — sets the bar for 1% rule.
- Cap rate 5.1% vs local median 3.8% in Farmington — top-decile yield for the area; either an underpriced asset or a hidden risk that comps aren't pricing in. Stress-test before assuming the spread holds.
Location & tenants
- Location reads 75/100 on livability (#203 in MN, #4,269 nationally) — a middle-class / working-renter tenant base. Strengths: crime A+, employment A+, housing A+; Watch: amenities F, commute F.
- Farmington Public School District (suburban): math 43% / reading 52% proficiency, ranked #104 of 301 in MN (top 35%) — families likely to look elsewhere, expect single-tenant / working-renter base with shorter leases; only 12% free/reduced lunch — higher-income household profile.
- Market conditions: 325 active listings in the ZIP; 6 comparable units currently listed for rent nearby; rentals at typical pace (median 19d on market — plan ~3-4 weeks tenant-placement turnaround); high-income renter base; 2,134 units permitted in Dakota County in 2024 (898 in 5+ unit buildings).
Forward outlook
- Local home prices are declining (-3.0%/yr); year-one equity from $2k of loan paydown is wiped out by about $10k of value loss. Plan a longer hold.
- Dakota County population projected at +11% by 2050 — modest demand growth; plan on rents tracking national, not racing it.
Negotiation context
- Only 11 days on market — expect competitive offers; lowballing is unlikely to land.
- 3 sale attempts since 23y ago with the ask held roughly flat each time — persistent listings suggest the price (not the market) is what's stuck; bring a comps-based counter.
Questions for the listing agent
- What do current leases actually rent for vs. the listed asking? Can we see a recent rent roll and the last 12 months of T-12 income?
- Is there a deadline driving the sale (1031 exchange, divorce, estate, relocation)? That informs how much negotiation room exists.
- Schools are B-rated — typically a magnet for longer-tenancy family renters. What's the average tenant stay here, and is there a school-zone premium baked into asking?
- The area grade is low — what's the realistic commute time and amenity access for the typical tenant pool here? Any planned neighborhood developments (good or bad) we should know about?
- What's the average days-on-market for RENTAL listings here right now (not sales)? A rising rental-DOM trend means longer vacancies and softer asking-rent achievability than the comps imply.
- What's the recent tenant-quality profile in this submarket — average credit score on applications, eviction rate, late-payment / NSF rate, and stable-employment percentage? A property-management company in the area should have these aggregated.
- How much new for-sale + rental construction is in the pipeline within 1–3 miles? Heavy new supply typically softens prices + rents 12–24 months out; constrained supply supports both.
Investment metrics
- 1% rule
- 0.71% ✗
- Cap rate
- 5.11%
- Cash-on-cash
- -4.21%
- DSCR
- 0.81
- GRM
- 11.8
CMA / ARV
- ARV (median comp)
- $420,947
- List price
- $344,900
- Delta
- -18.07%
- Verdict
- UNDERPRICED
- Comps
- 3 within 1.0 mi
Projected returns pro-forma
-3.0% appreciation · 3.0% rent growth · sell at horizon
- IRR
- -23.4%
- Equity multiple
- 0.20×
- Total profit
- $-77,495
- Equity at exit
- $51,426
- IRR
- -18.2%
- Equity multiple
- 0.01×
- Total profit
- $-95,402
- Equity at exit
- $29,821
Cash invested: $96,572 (down + closing). Projections, not guarantees.
Landlord ↔ Tenant lean methodology
- Overall (STATE)
- 46 Balanced
- State Minnesota
- 46 Balanced · D+2
- County
- — inherits STATE
- City
- — inherits STATE
ZIP-level market 55024
- Home prices YoY
- -31.2%
- Active inventory
- 325
- Price-to-rent
- 11.8×
Monthly cashflow live
- Estimated rent
- $2,439 high interval (Pro) →
- Mortgage (P&I)
- −$1,809
- Tax from tax record
- −$313 /mo · $3,758/yr
- Insurance
- −$144
- HOA
- −$0
- Vacancy / Maint / Mgmt
- −$512
- Net cashflow
- $-339
Break-even live
UW: 25.0% down · 7.5% · 30yr · 1.5% tax · 5.0% vac · 8.0% maint · 8.0% mgmt
Financing live
Cash to close
- Down payment
- $86,225
- Closing costs
- $10,347
- Reserves months
- —
- Total cash needed
- —
Loan-product check · same deal, 3 products live
Conventional
25% down · 7.5% · 30yr
- Down + closing
- —
- Monthly P&I
- —
- Monthly cashflow
- —
- DSCR
- —
- Eligible?
- —
Personal DTI + credit; lowest rate.
DSCR
20% down · 8.5% · 30yr
- Down + closing
- —
- Monthly P&I
- —
- Monthly cashflow
- —
- DSCR
- —
- Eligible?
- —
No personal income docs; deal must DSCR.
Hard money
10% down · 12.0% · 12mo
- Down + closing
- —
- Monthly P&I
- —
- Monthly cashflow
- —
- DSCR
- —
- Eligible?
- —
Short-term bridge; refi at stabilization.
Rent comps 6 comps
| Address | Beds | Baths | Sqft | Rent | $/sqft | DOM | Units | Dist |
|---|---|---|---|---|---|---|---|---|
| 18388 English Ave Farmington, MN | 2.0 | 2.0 | 1544 | $1,999 | $1.29 | 43d | 1 | 0.25mi |
| 19644 Escalade Way #906 Farmington, MN | 2.0 | 2.0 | 1500 | $1,999 | $1.33 | 43d | 1 | 1.33mi |
| 17079 Dysart Pl Lakeville, MN | 3.0 | 3.0 | 1894 | $2,795 | $1.48 | 10d | 1 | 1.35mi |
| 17074 Dysart Pl Unit 17074 Lakeville, MN | 3.0 | 2.5 | 1750 | $2,800 | $1.60 | 10d | 1 | 1.37mi |
| 17066 Dysart Pl Unit 17066 Lakeville, MN | 3.0 | 2.5 | 1894 | $2,895 | $1.53 | 19d | 1 | 1.39mi |
| 17040 Dysart Pl Unit 17040 Lakeville, MN | 3.0 | 2.5 | 1700 | $2,700 | $1.59 | 1d | 1 | 1.41mi |
Listing history 13 events
-
2026-05-11status Pending 633-char remark
-
2026-05-04historical Contingent - Inspection 633-char remark
-
2026-05-01$344,900 Active 633-char remark
-
2026-04-29historical $344,900 633-char remark
-
2005-07-19soldstatus $232,000
-
2005-06-30soldstatus $232,000 238-char remark
Show marketing remark (238 chars)
Move right in and enjoy this beautifully maintained 4 bedroom/2 bath home with tons of updates! New hardwood floors, ceramic tile, light fixtures, crown moldings, and lower level carpet-just to name a few! See supplement for more details.
-
2005-05-17historical 238-char remark
Show marketing remark (238 chars)
Move right in and enjoy this beautifully maintained 4 bedroom/2 bath home with tons of updates! New hardwood floors, ceramic tile, light fixtures, crown moldings, and lower level carpet-just to name a few! See supplement for more details.
-
2005-04-25$234,900 238-char remark
Show marketing remark (238 chars)
Move right in and enjoy this beautifully maintained 4 bedroom/2 bath home with tons of updates! New hardwood floors, ceramic tile, light fixtures, crown moldings, and lower level carpet-just to name a few! See supplement for more details.
-
2003-08-01soldstatus $184,900
-
2003-05-28soldstatus $184,900
Show marketing remark (184 chars)
4 BDRM. 2 Bath Split with vaulted ceilings...Open living room, and dining room. Maintenance free exterior, professional landscaping. Lower 11x16 family room. Ready for finishing touch!
-
2003-03-30historical
Show marketing remark (184 chars)
4 BDRM. 2 Bath Split with vaulted ceilings...Open living room, and dining room. Maintenance free exterior, professional landscaping. Lower 11x16 family room. Ready for finishing touch!
-
2003-03-21$184,900
Show marketing remark (184 chars)
4 BDRM. 2 Bath Split with vaulted ceilings...Open living room, and dining room. Maintenance free exterior, professional landscaping. Lower 11x16 family room. Ready for finishing touch!
-
1995-09-12soldstatus $100,790
ⓘ Source: listings_history table (triggers on properties + properties_extension) + one-shot
backfill from property_details.listing_events for pre-trigger history.
Tax reassessment forecast MN · Partial reset (capped growth)
- Current annual tax
- $3,758 · $313/mo
- Projected year-2 tax
- $3,810 · $318/mo
- Expected delta
- +$52/yr (+$4/mo · 1.4%)
ⓘ Screening estimate from a state-policy table — verify with the county assessor before closing.
Climate risk First Street
- Flood 1/10 Low FEMA zone X (unshaded) · 0% chance over 30 yrs
- Wildfire 1/10 Low
- Heat 2/10 Low 7 d/yr ≥99°F today · 14 d/yr by 30 yrs out
- Wind 2/10 Low
- Air quality 2/10 Low 1 unhealthy d/yr today · 1 by 30 yrs out
Nearby sold comps map
Loading sold comps map…
Walkable amenities ~0.75 mi
Loading nearby amenities…
Taxation est. · year 1
- Rental income
- $29,269
- − Mortgage interest
- −$19,320
- − Property taxes
- −$3,758
- − Insurance
- −$1,724
- − Repairs & maintenance
- −$2,342
- − Management
- −$2,342
- − Depreciation
- −$10,033
- Taxable loss
- −$10,250
- Est. tax savings @ 24.0%
- +$2,460
- After-tax cash flow
- $-1,604/yr
For passive investors: Depreciation is non-cash, so a rental often shows a tax loss while cash-flowing — sheltering income. Rental losses are passive: they offset passive income freely, and up to $25,000/yr can offset ordinary (W-2) income if you actively participate and your MAGI is under $100k (phasing out to $0 by $150k); unused losses carry forward. On sale, claimed depreciation is recaptured at up to 25%, and gains may owe capital-gains tax (a 1031 exchange can defer both). Figures are a year-1 estimate at your 24.0% rate — not tax advice; consult a CPA.
Schools (NCES district)
- District
- Farmington Public School District
- NCES district ID
- 2711820
- Math proficiency
- 43% ▼ -12.00%
- Reading proficiency
- 52% ▼ -7.00%
- Median HH income
- $83,959
- Composite
- 43.93/100
- National rank
- #2905
- State rank
- #104 of 301 in MN
Livability — Farmington
- Score
- 75/100
- State rank
- #203
- US rank
- #4269
Category grades
Schools grade is shown separately in the Schools card above.
Census & demographics
- Census place
- Farmington, MN
- County
- Dakota County · 417,704 people
- City population
- 37,287
- Metro
- Minneapolis-St. Paul-Bloomington, MN-WI
- Population (ZIP)
- 37,287
- Household income
- $127,280
- Rent vs Own
- Severe rent burden
- 288.0
Population outlook (Dakota County) Hauer SSP2
- Today (2025)
- 450,671 people
- By 2030
- 465,068 · +3.2%
- By 2040
- 486,770 · +8.0%
- By 2050
- 498,743 · +10.7%
- By 2075
- 533,865 · +18.5%
- By 2100
- 550,133 · +22.1%
Race, ethnicity, and origin ACS 2023
- Neighborhood character
- Predominantly White (84%)
- Race & ethnicity
- White 84% Hispanic / Latino 6% Two or more races 4% Black 4% Asian 3%
- Hispanic origin (detail)
- Mexican 3%
- Common ancestry
- Portuguese 14% Scottish 3% Romanian 3%
- Foreign-born
- 5% · Canada, Vietnam
- Languages at home
- 93% English-only · Spanish 3% Other Asian/Pacific 1% Russian/Polish/Slavic 1%
Political lean MEDSL · Dakota
- 2024 margin
- D (+12.9) · D 55.4% · R 42.5% · Other 2.1%
- 2008→2024 swing
- +7.4pp toward D · 2008: 5.5pp · 2024: 12.9pp
- All cycles
- 2024: D+12.9 2020: D+13.9 2016: D+4.7 2012: D+2.9 2008: D+5.5
Not yet ingested
- Civics
- —
Market trends
- HPI YoY
- ▼ -102.47%
- Current HPI
- 225.6882
- Rent YoY
- —
- Metro
- Minneapolis-St. Paul-Bloomington, MN-WI
- State GDP YoY
- ▲ 2.41%
- F500 in state
- 34
Industry mix (Fortune 500 HQ in MN)
| Industry | F500 HQs | Revenue |
|---|---|---|
| Healthcare | 2 | $407B |
|
||
| Retail | 2 | $150B |
|
||
| Consumer Goods | 2 | $32B |
|
||
| Industrial Machinery | 2 | $6B |
|
||
| Agriculture | 1 | $40B |
|
||
| Healthcare / Medical Devices | 1 | $32B |
|
||
Price history
+262.1% since first listed14 events — show timeline
- 2026-06-04 Sold (MLS) $365,000 NORTHSTARMLS as Distributed by MLS Grid
- 2026-05-11 Pending — NORTHSTARMLS as Distributed by MLS Grid
- 2026-05-04 Contingent — NORTHSTARMLS as Distributed by MLS Grid
- 2026-05-01 Listed $344,900 NORTHSTARMLS as Distributed by MLS Grid
- 2026-04-29 Coming Soon $344,900 NORTHSTARMLS as Distributed by MLS Grid
- 2005-07-19 Sold (Public Records) $232,000 Public Records
- 2005-06-30 Sold (MLS) $232,000 NORTHSTARMLS as Distributed by MLS Grid
- 2005-05-17 Listing Removed — NORTHSTARMLS as Distributed by MLS Grid
- 2005-04-25 Listed $234,900 NORTHSTARMLS as Distributed by MLS Grid
- 2003-08-01 Sold (Public Records) $184,900 Public Records
- 2003-05-28 Sold (MLS) $184,900 NORTHSTARMLS as Distributed by MLS Grid
- 2003-03-30 Listing Removed — NORTHSTARMLS as Distributed by MLS Grid
- 2003-03-21 Listed $184,900 NORTHSTARMLS as Distributed by MLS Grid
- 1995-09-12 Sold (Public Records) $100,790 Public Records
Property tax history
+3.7%/yrLatest (2025): $3,758 · +0.9% YoY. Source: county tax records.
Cash-flow waterfall
monthlySold comps — $/sqft
last 12 mo · ≤1 miLoading sold comps…