 Fourplex
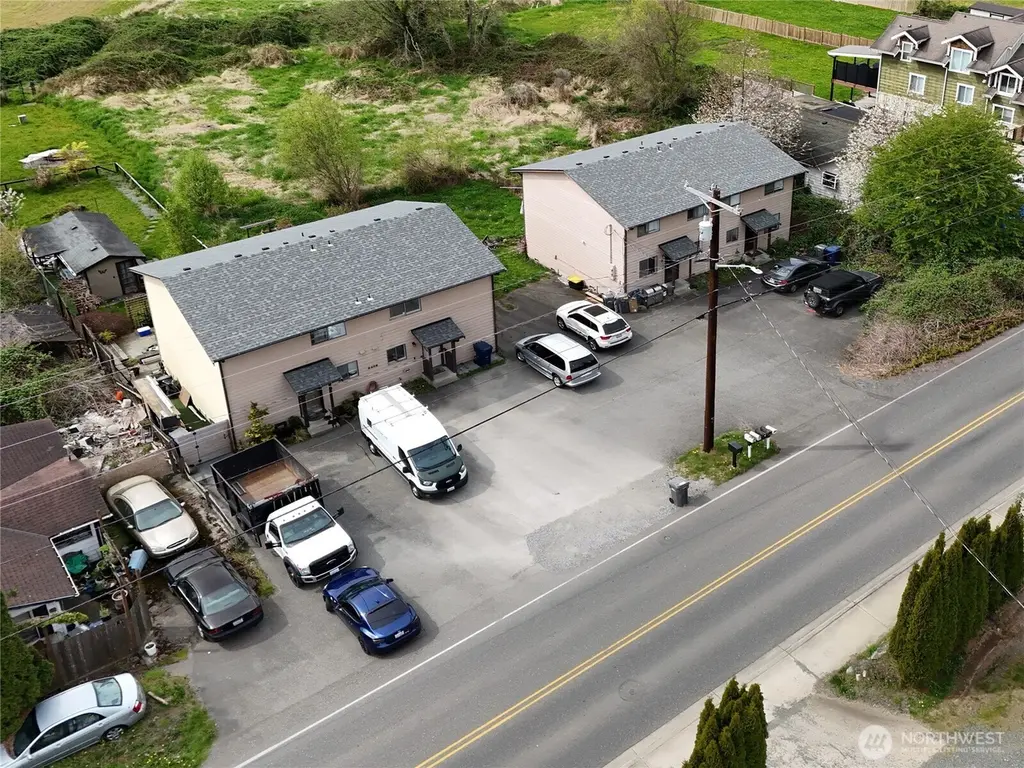
2406 & 2410 Callow Rd · Lake Stevens, WA
Flood risk 1/10 · Minimal
- FEMA flood zone
- X (unshaded)
- Chance of flooding over 30 yrs
- 0.0%
- Est. flood insurance / yr
- $507 – $1,088
Fire risk 1/10 · Minimal
- Est. fire insurance / yr
- $604 – $1,122
Heat risk 2/10 · Minimal
- Hot days now (above 86°F)
- 7 days/yr
- Hot days in 30 yrs
- 17 days/yr
Wind risk 1/10 · Minimal
- Chance of severe wind over 30 yrs
- —
Air-quality risk 6/10 · Moderate
- Unhealthy air days now
- 9 days/yr
- Unhealthy air days in 30 yrs
- 10 days/yr
Risk factors via First Street. Map © Google.
Why this score? — see what drove the D grade
The composite is a weighted blend of 9 inputs, each scored 0–100. Each bar is that input's sub-score; the figure is the points it added to the 100-point composite (weight × sub-score).
- Cash flow +17.6/30.0
- Schools +5.8/10.0
- DSCR +5.5/10.0
- Livability +4.2/5.0
- 1% rule +3.7/10.0
- Rent growth +2.5/5.0
- Condition / age +2.5/5.0
- ARV discount +0.0/15.0
- Appreciation +0.0/10.0
$1,150,000
🖨 Deal sheet 📄 Offer letter ✓ Due diligence
Multi-family units
County records classify this as Multi-Family (2-4 Unit). Listing-text estimate: 4 units. confirmed
Listing remarks
Rare multi-unit investment opportunity in the heart of Lake Stevens! This offering includes two side-by-side duplexes situated on a combined 0.72-acre lot, delivering scale, flexibility, and strong long-term upside. The unit mix features two 2-bedroom, 1.5-bath units at 2406 Callow Rd and two larger 3-bedroom, 1.5-bath units at 2410 Callow Rd—ideal for attracting a diverse tenant base. All four units include a stove, refrigerator, dishwasher, and in-unit washer/dryer hookups, providing the conveniences renters are looking for. Unit 2406 #B is available for showings and offers a representative look at the overall condition and layout. Both duplexes feature brand new roofs installed
Key facts
- Huge backyard
- Brand new roofs
- 0.72 acre lot
Tags
Neighborhood map
What this means for you Summary
Snapshot
- This is a 2×2bd/1.5ba + 2×3bd/1.5ba units multifamily listed at $1.15M.
Deal economics
- At list price, monthly cash flow is $911 ($11k/yr) — positive. Per door: $228/mo.
- The deal already cash-flows at list — no discount required.
- To meet the 1% rule (rent ≥ 1% of price), the offer needs to be $1.00M (12.6% below list).
- Recommended offer: $1.00M (12.6% below list) — sets the bar for 1% rule.
- Cap rate 7.2% vs local median 2.8% in Lake Stevens — top-decile yield for the area; either an underpriced asset or a hidden risk that comps aren't pricing in. Stress-test before assuming the spread holds.
Location & tenants
- Location reads 83/100 on livability (#51 in WA, #917 nationally) — a professional / high-income tenant draw. Strengths: crime A+, employment A+, housing A+; Watch: amenities C-, cost of living F.
- Lake Stevens School District (suburban): math 57% / reading 70% proficiency, ranked #31 of 291 in WA (top 11%) — acceptable for families but not a draw, mixed tenant base, ~2y average lease.
- Zoned schools: Highland Elementary (590 students, 26% FRL); Lake Stevens Sr High School (2,140 students, 31% FRL).
- Market conditions: Rents flat; 418 active listings in the ZIP; 5 comparable units currently listed for rent nearby; rentals lingering (median 44d on market — plan ~5-8 weeks vacancy on turnover, expect pricing pressure); 60% of comp listings sitting > 30 days — soft ceiling on asking rent; high-income renter base; 3,982 units permitted in Snohomish County in 2024 (1,492 in 5+ unit buildings).
- At $10,047/mo this rent would consume 97% of the median local household income ($124k/yr) (locally 786% of renters already pay >50% of income on rent) — very limited rent-growth headroom before tenants either downsize or default.
Forward outlook
- Local home prices are declining (-3.0%/yr); year-one equity from $8k of loan paydown is wiped out by about $34k of value loss. Plan a longer hold.
- Snohomish County population projected at +30% by 2050 — long-run rental-demand tailwind backs the buy-and-hold thesis.
Negotiation context
- Only 1 days on market — expect competitive offers; lowballing is unlikely to land.
- 2 sale attempts; this cycle's ask is 100% above the opening price — seller raised mid-cycle; expect resistance to lowballs.
- Current owner paid $125k; list at $1.15M implies a 820% gain — meaningful room to come down on a strong offer.
Questions for the listing agent
- Can we see the unit-by-unit rent roll, current vacancy, and any below-market leases? What's the average tenancy length?
- What capital expenditures (roof, boiler, parking lot, exteriors) have been made in the last 5 years, and what's planned in the next 2?
- Is there a deadline driving the sale (1031 exchange, divorce, estate, relocation)? That informs how much negotiation room exists.
- Schools are B-rated — typically a magnet for longer-tenancy family renters. What's the average tenant stay here, and is there a school-zone premium baked into asking?
- The area grade is low — what's the realistic commute time and amenity access for the typical tenant pool here? Any planned neighborhood developments (good or bad) we should know about?
- What's the average days-on-market for RENTAL listings here right now (not sales)? A rising rental-DOM trend means longer vacancies and softer asking-rent achievability than the comps imply.
- What's the recent tenant-quality profile in this submarket — average credit score on applications, eviction rate, late-payment / NSF rate, and stable-employment percentage? A property-management company in the area should have these aggregated.
- How much new apartment / multifamily construction is in the pipeline within 1–3 miles? Heavy new supply (>2% of stock underway) typically softens rents 12–24 months out; light construction supports rent growth.
Investment metrics
- 1% rule
- 0.87% ✗
- Cap rate
- 7.24%
- Cash-on-cash
- 3.39%
- DSCR
- 1.15
- GRM
- 9.5
CMA / ARV
- ARV (on-the-fly)
- $844,800
- Comps found
- 2
Show comp detail 2 sales within ~0.75 mi
| Address | Dist | Beds/Ba | Sqft | Sold | Price | $/sf | Match |
|---|---|---|---|---|---|---|---|
| 2406 99th Ave NE Unit 1-2 | 0.30mi | 4/5.0 | 2,298 (-4%) | 13mo | $810,000 | $352 | 60 |
| 2904 101st Ave NE Unit 1 & 2 | 0.36mi | 4/4.0 | 2,176 (-9%) | 16mo | $740,000 | $340 | 50 |
Match score weights: distance 35% · size 25% · config 20% · recency 20%. Top-matched comps best support the ARV.
Projected returns pro-forma
-3.0% appreciation · 0.19% rent growth · sell at horizon
- IRR
- -13.9%
- Equity multiple
- 0.51×
- Total profit
- $-156,395
- Equity at exit
- $171,469
- IRR
- -9.7%
- Equity multiple
- 0.47×
- Total profit
- $-170,369
- Equity at exit
- $99,431
Cash invested: $322,000 (down + closing). Projections, not guarantees.
Landlord ↔ Tenant lean methodology
- Overall (STATE)
- 28 Tenant-Leaning
- State Washington
- 28 Tenant-Leaning · D+8
- County
- — inherits STATE
- City
- — inherits STATE
ZIP-level market 98258
- Rents YoY
- 0.2%
- Active inventory
- 418
- Price-to-rent
- 40.9×
Monthly cashflow live
- Estimated rent
- $10,047 medium interval (Pro) →
- Mortgage (P&I)
- −$6,031
- Tax from tax record
- −$517 /mo · $6,199/yr
- Insurance
- −$479
- HOA
- −$0
- Vacancy / Maint / Mgmt
- −$2,110
- Net cashflow
- $911
Break-even live
4-unit breakdown (identical units grouped — click to expand)
| Units | Beds | Baths | Est. rent |
|---|---|---|---|
| 2× units | 2 | 1.5 | $4,682 |
| #1 | 2 | 1.5 | $2,341 |
| #2 | 2 | 1.5 | $2,341 |
| 2× units | 3 | 1.5 | $5,364 |
| #3 | 3 | 1.5 | $2,682 |
| #4 | 3 | 1.5 | $2,682 |
| Total (4 units) | $10,047 | ||
UW: 25.0% down · 7.5% · 30yr · 1.5% tax · 5.0% vac · 8.0% maint · 8.0% mgmt
Financing live
Cash to close
- Down payment
- $287,500
- Closing costs
- $34,500
- Reserves months
- —
- Total cash needed
- —
Loan-product check · same deal, 3 products live
Conventional
25% down · 7.5% · 30yr
- Down + closing
- —
- Monthly P&I
- —
- Monthly cashflow
- —
- DSCR
- —
- Eligible?
- —
Personal DTI + credit; lowest rate.
DSCR
20% down · 8.5% · 30yr
- Down + closing
- —
- Monthly P&I
- —
- Monthly cashflow
- —
- DSCR
- —
- Eligible?
- —
No personal income docs; deal must DSCR.
Hard money
10% down · 12.0% · 12mo
- Down + closing
- —
- Monthly P&I
- —
- Monthly cashflow
- —
- DSCR
- —
- Eligible?
- —
Short-term bridge; refi at stabilization.
Rent comps 5 comps
| Address | Beds | Baths | Sqft | Rent | $/sqft | DOM | Units | Dist |
|---|---|---|---|---|---|---|---|---|
| 10914 Willow Rd Unit A Lake Stevens, WA | 4.0 | 2.0 | 2280 | $3,195 | $1.40 | 2d | 1 | 0.35mi |
| 10185 33rd Pl NE Lake Stevens, WA | 4.0 | 2.5 | 2787 | $3,400 | $1.22 | 43d | 1 | 0.57mi |
| 11010 33rd St NE Lake Stevens, WA | 4.0 | 2.5 | 2297 | $3,500 | $1.52 | 11d | 1 | 0.64mi |
| 11704 20th St NE Lake Stevens, WA | 3.0 | 2.0 | 2558 | $5,800 | $2.27 | 43d | 1 | 0.89mi |
| 1229 92nd Ave NE Lake Stevens, WA | 4.0 | 2.5 | 1868 | $3,300 | $1.77 | 43d | 1 | 1.06mi |
Listing history 9 events
-
2026-04-24status Pending
-
2026-04-24status Pending
-
2026-04-22$1,150,000 Active
-
2026-04-22$575,000 Active
-
1991-08-01soldstatus $125,000
-
1989-07-31soldstatus $110,000
-
1988-08-11soldstatus $59,500
-
1987-06-16soldstatus $29,500
-
1985-10-21soldstatus $23,500
ⓘ Source: listings_history table (triggers on properties + properties_extension) + one-shot
backfill from property_details.listing_events for pre-trigger history.
Tax reassessment forecast WA · Resets to sale price
- Current annual tax
- $6,199 · $517/mo
- Projected year-2 tax
- $11,270 · $939/mo
- Expected delta
- +$5,071/yr (+$423/mo · 81.8%)
ⓘ Screening estimate from a state-policy table — verify with the county assessor before closing.
Climate risk First Street
- Flood 1/10 Low FEMA zone X (unshaded) · 0% chance over 30 yrs
- Wildfire 1/10 Low
- Heat 2/10 Low 7 d/yr ≥86°F today · 17 d/yr by 30 yrs out
- Wind 1/10 Low
- Air quality 6/10 Major 9 unhealthy d/yr today · 10 by 30 yrs out
Nearby sold comps map
Loading sold comps map…
Walkable amenities ~0.75 mi
Loading nearby amenities…
Taxation est. · year 1
- Rental income
- $120,564
- − Mortgage interest
- −$64,418
- − Property taxes
- −$6,199
- − Insurance
- −$5,750
- − Repairs & maintenance
- −$9,645
- − Management
- −$9,645
- − Depreciation
- −$33,455
- Taxable loss
- −$8,548
- Est. tax savings @ 24.0%
- +$2,051
- After-tax cash flow
- $12,979/yr
For passive investors: Depreciation is non-cash, so a rental often shows a tax loss while cash-flowing — sheltering income. Rental losses are passive: they offset passive income freely, and up to $25,000/yr can offset ordinary (W-2) income if you actively participate and your MAGI is under $100k (phasing out to $0 by $150k); unused losses carry forward. On sale, claimed depreciation is recaptured at up to 25%, and gains may owe capital-gains tax (a 1031 exchange can defer both). Figures are a year-1 estimate at your 24.0% rate — not tax advice; consult a CPA.
Schools (NCES district)
- District
- Lake Stevens School District
- NCES district ID
- 5304200
- Math proficiency
- 57% ▼ -2.00%
- Reading proficiency
- 70% ▬ 0.00%
- Median HH income
- $78,301
- Composite
- 58.12/100
- National rank
- #2141
- State rank
- #31 of 291 in WA
Livability — Lake Stevens
- Score
- 83/100
- State rank
- #51
- US rank
- #917
Category grades
Schools grade is shown separately in the Schools card above.
Census & demographics
- Census place
- Lake Stevens, WA
- County
- Snohomish County · 786,756 people
- City population
- 52,752
- Metro
- Seattle-Tacoma-Bellevue, WA
- Population (ZIP)
- 52,752
- Household income
- $123,898
- Rent vs Own
- Severe rent burden
- 786.0
Population outlook (Snohomish County) Hauer SSP2
- Today (2025)
- 899,800 people
- By 2030
- 960,975 · +6.8%
- By 2040
- 1,074,447 · +19.4%
- By 2050
- 1,171,954 · +30.2%
- By 2075
- 1,384,849 · +53.9%
- By 2100
- 1,497,296 · +66.4%
Race, ethnicity, and origin ACS 2023
- Neighborhood character
- Predominantly White (73%)
- Race & ethnicity
- White 73% Hispanic / Latino 12% Two or more races 11% Asian 6% Black 2%
- Hispanic origin (detail)
- Mexican 7%
- Common ancestry
- Portuguese 7% Italian 3% Slovak 2%
- Foreign-born
- 10% · Canada, Vietnam, China
- Languages at home
- 87% English-only · Spanish 5% Russian/Polish/Slavic 2% Other Indo-European 1%
Political lean MEDSL · Snohomish
- 2024 margin
- D (+19.0) · D 57.8% · R 38.9% · Other 3.3%
- 2008→2024 swing
- +0.1pp no change · 2008: 18.9pp · 2024: 19.0pp
- All cycles
- 2024: D+19.0 2020: D+20.6 2016: D+16.6 2012: D+16.2 2008: D+18.9
Not yet ingested
- Civics
- —
Market trends
- HPI YoY
- ▼ -725.77%
- Current HPI
- 303.8934
- Rent YoY
- ▲ 0.19%
- Metro
- Seattle-Tacoma-Bellevue, WA
- State GDP YoY
- ▲ 4.65%
- F500 in state
- 22
Industry mix (Fortune 500 HQ in WA)
| Industry | F500 HQs | Revenue |
|---|---|---|
| Retail | 2 | $269B |
|
||
| Technology / Retail | 1 | $638B |
|
||
| Technology | 1 | $245B |
|
||
| Telecommunications | 1 | $38B |
|
||
| Food / Beverage | 1 | $36B |
|
||
| Automotive / Trucks | 1 | $34B |
|
||
Price history
+2346.8% since first listed9 events — show timeline
- 2026-04-24 Pending — NWMLS as Distributed by MLS Grid
- 2026-04-24 Pending — NWMLS as Distributed by MLS Grid
- 2026-04-22 Listed $575,000 NWMLS as Distributed by MLS Grid
- 2026-04-22 Listed $1,150,000 NWMLS as Distributed by MLS Grid
- 1991-08-01 Sold (Public Records) $125,000 Public Records
- 1989-07-31 Sold (Public Records) $110,000 Public Records
- 1988-08-11 Sold (Public Records) $59,500 Public Records
- 1987-06-16 Sold (Public Records) $29,500 Public Records
- 1985-10-21 Sold (Public Records) $23,500 Public Records
Property tax history
+3.3%/yrLatest (2026): $6,199 · +11.9% YoY. Source: county tax records.
Cash-flow waterfall
monthlySold comps — $/sqft
last 12 mo · ≤1 miLoading sold comps…