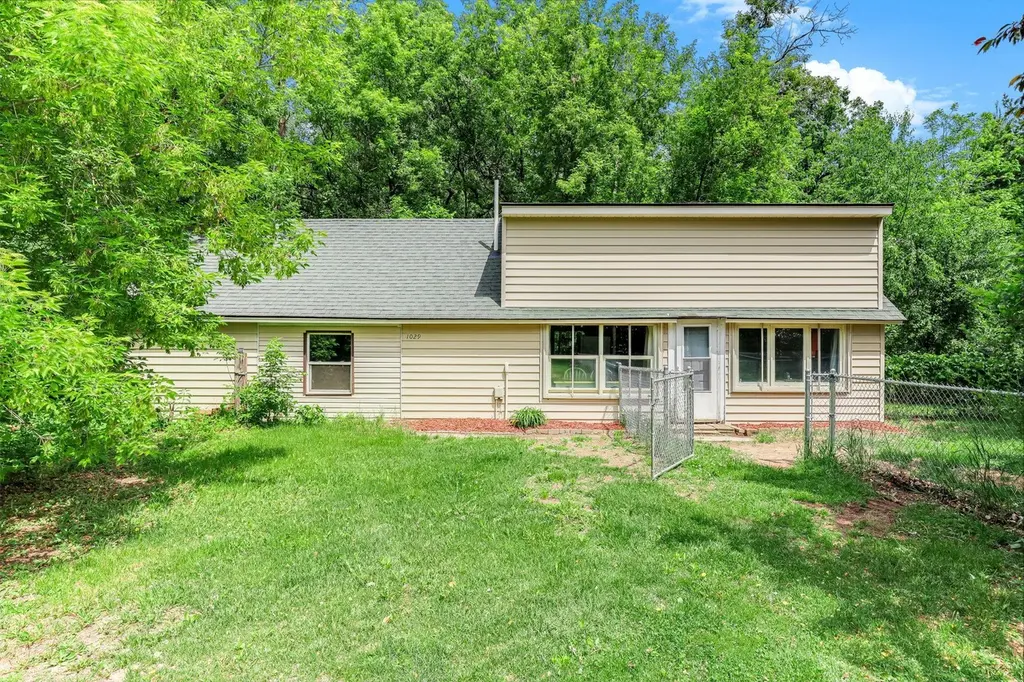
1029 197th Avenue NE Ave NE · East Bethel, MN
Flood risk 1/10 · Minimal
- FEMA flood zone
- X (unshaded)
- Chance of flooding over 30 yrs
- 0.0%
- Est. flood insurance / yr
- $507 – $1,088
Fire risk 5/10 · Moderate
- Est. fire insurance / yr
- $888 – $1,650
Heat risk 2/10 · Minimal
- Hot days now (above 99°F)
- 7 days/yr
- Hot days in 30 yrs
- 14 days/yr
Wind risk 2/10 · Minimal
- Chance of severe wind over 30 yrs
- —
Air-quality risk 2/10 · Minimal
- Unhealthy air days now
- 1 days/yr
- Unhealthy air days in 30 yrs
- 1 days/yr
Risk factors via First Street. Map © Google.
Why this score? — see what drove the F grade
The composite is a weighted blend of 9 inputs, each scored 0–100. Each bar is that input's sub-score; the figure is the points it added to the 100-point composite (weight × sub-score).
- Cash flow +8.2/30.0
- ARV discount +7.5/15.0
- Schools +3.8/10.0
- Livability +3.3/5.0
- Rent growth +2.5/5.0
- Condition / age +2.5/5.0
- 1% rule +2.3/10.0
- DSCR +2.2/10.0
- Appreciation +0.0/10.0
$209,900
🖨 Deal sheet 📄 Offer letter ✓ Due diligence
Listing remarks MLS
Excellent starter home with the ability to expand. Bring your horses for 4+ pasture acres, pond and woods with wildlife to explore - almost 7 acres total. See supplements for E. Bethel accessory building allowances - 3,000+ square feet allowed and 4 buildings! Cozy, quiet freshly painted home with easy access to Hwy 65 and Viking Blvd. Efficiently heated with main floor wall unit. Oversized garage. Septic just pumped and compliant.
Key facts
- 6.76 acre lot
- Built 1945
- Listed 5 days
Property features AI
Finance
- Other: Property sits on approximately 6.76 acres (lot dimensions 270 x 1090) with about 4.26 acres noted as pasture area
Exterior
- Parking: No onsite parking listed
- Utilities: City water connected and well; Private sewer; Natural gas fuel; Electric with circuit breakers
- Home design: Residential property; One-and-a-half story layout; Entry level: Main
- Construction: Frame construction; Asphalt roof; Foundation details: see remarks; Originally built area with 645 foundation area
- Exterior features: Vinyl exterior; Chain link fencing; Heavy tree coverage; Road frontage on a county road; Publicly maintained road access
Interior
- Kitchen: Range; Refrigerator
- Bedrooms: Two bedrooms (both on the upper level)
- Bathrooms: One full bathroom on the main floor
- Heating & cooling: Heating: Other; Cooling: Wall units
- Interior features: Informal dining area integrated with living/dining space; Kitchen window
- Laundry & utility: Washer hookup; Gas dryer hookup; Main-level laundry; Utility room on main level (7x6)
Neighborhood map
What this means for you Summary
Snapshot
- This is a 2-bed/1.0-bath single-family listed at $210k.
Deal economics
- At list price, monthly cash flow is $-200 ($-2k/yr) — negative.
- To cash-flow at today's rent, offer at most $175k (16.8% below list).
- To meet the 1% rule (rent ≥ 1% of price), the offer needs to be $154k (26.9% below list).
- Recommended offer: $154k (26.9% below list) — sets the bar for 1% rule.
- Cap rate 5.2% vs local median 3.2% in East Bethel — top-decile yield for the area; either an underpriced asset or a hidden risk that comps aren't pricing in. Stress-test before assuming the spread holds.
Location & tenants
- Location reads 66/100 on livability (#489 in MN) — a middle-class / working-renter tenant base. Strengths: employment A+, housing A+, crime A-; Watch: amenities F, commute F, health & safety F.
- St. Francis Area Schools (rural): math 35% / reading 47% proficiency, ranked #185 of 301 in MN (top 62%) — families likely to look elsewhere, expect single-tenant / working-renter base with shorter leases; only 20% free/reduced lunch — higher-income household profile.
- Market conditions: 97 active listings in the ZIP; 1,083 units permitted in Anoka County in 2024 (134 in 5+ unit buildings).
Forward outlook
- Local home prices are declining (-3.0%/yr); year-one equity from $1k of loan paydown is wiped out by about $6k of value loss. Plan a longer hold.
- Anoka County population projected at +11% by 2050 — modest demand growth; plan on rents tracking national, not racing it.
Negotiation context
- Only 5 days on market — expect competitive offers; lowballing is unlikely to land.
- 3 sale attempts since 19y ago with the ask held roughly flat each time — persistent listings suggest the price (not the market) is what's stuck; bring a comps-based counter.
- Current owner paid $182k; 15% above their basis — modest negotiation headroom, anchor on the comps not their cost.
Risks & watch-outs
- Watch-outs: built in 1945 — expect roof / HVAC / electrical / plumbing capex.
- Climate carrying-cost: moderate wildfire risk — expect insurance premiums to compound above CPI over the hold.
Questions for the listing agent
- What do current leases actually rent for vs. the listed asking? Can we see a recent rent roll and the last 12 months of T-12 income?
- Built in 1945 — when were the roof, HVAC, electrical panel, plumbing, and water heater last replaced?
- Is there a deadline driving the sale (1031 exchange, divorce, estate, relocation)? That informs how much negotiation room exists.
- Schools are B-rated — typically a magnet for longer-tenancy family renters. What's the average tenant stay here, and is there a school-zone premium baked into asking?
- The area grade is low — what's the realistic commute time and amenity access for the typical tenant pool here? Any planned neighborhood developments (good or bad) we should know about?
- What's the average days-on-market for RENTAL listings here right now (not sales)? A rising rental-DOM trend means longer vacancies and softer asking-rent achievability than the comps imply.
- What's the recent tenant-quality profile in this submarket — average credit score on applications, eviction rate, late-payment / NSF rate, and stable-employment percentage? A property-management company in the area should have these aggregated.
- How much new for-sale + rental construction is in the pipeline within 1–3 miles? Heavy new supply typically softens prices + rents 12–24 months out; constrained supply supports both.
Investment metrics
- 1% rule
- 0.73% ✗
- Cap rate
- 5.15%
- Cash-on-cash
- -4.08%
- DSCR
- 0.82
- GRM
- 11.4
CMA / ARV
No comps found within radius.
Projected returns pro-forma
-3.0% appreciation · 3.0% rent growth · sell at horizon
- IRR
- -23.2%
- Equity multiple
- 0.20×
- Total profit
- $-46,728
- Equity at exit
- $31,297
- IRR
- -17.8%
- Equity multiple
- 0.03×
- Total profit
- $-57,063
- Equity at exit
- $18,148
Cash invested: $58,772 (down + closing). Projections, not guarantees.
Landlord ↔ Tenant lean methodology
- Overall (STATE)
- 46 Balanced
- State Minnesota
- 46 Balanced · D+2
- County
- — inherits STATE
- City
- — inherits STATE
ZIP-level market 55011
- Home prices YoY
- -25.8%
- Active inventory
- 97
- Price-to-rent
- 11.4×
Monthly cashflow live
- Estimated rent
- $1,535 medium interval (Pro) →
- Mortgage (P&I)
- −$1,101
- Tax from tax record
- −$224 /mo · $2,689/yr
- Insurance
- −$87
- HOA
- −$0
- Vacancy / Maint / Mgmt
- −$322
- Net cashflow
- $-200
Break-even live
UW: 25.0% down · 7.5% · 30yr · 1.5% tax · 5.0% vac · 8.0% maint · 8.0% mgmt
Financing live
Cash to close
- Down payment
- $52,475
- Closing costs
- $6,297
- Reserves months
- —
- Total cash needed
- —
Loan-product check · same deal, 3 products live
Conventional
25% down · 7.5% · 30yr
- Down + closing
- —
- Monthly P&I
- —
- Monthly cashflow
- —
- DSCR
- —
- Eligible?
- —
Personal DTI + credit; lowest rate.
DSCR
20% down · 8.5% · 30yr
- Down + closing
- —
- Monthly P&I
- —
- Monthly cashflow
- —
- DSCR
- —
- Eligible?
- —
No personal income docs; deal must DSCR.
Hard money
10% down · 12.0% · 12mo
- Down + closing
- —
- Monthly P&I
- —
- Monthly cashflow
- —
- DSCR
- —
- Eligible?
- —
Short-term bridge; refi at stabilization.
Listing history 5 events
-
2026-06-10status $209,900 Pending 5 DOM
-
2026-06-09days on market $209,900 Active 5 DOM
-
2026-06-08days on market $209,900 Active 4 DOM
-
2026-06-07remarks 689-char remark
-
2026-06-07$209,900 Active 3 DOM
ⓘ Source: listings_history table (triggers on properties + properties_extension) + one-shot
backfill from property_details.listing_events for pre-trigger history.
Tax reassessment forecast MN · Partial reset (capped growth)
- Current annual tax
- $2,689 · $224/mo
- Projected year-2 tax
- $2,689 · $224/mo
- Expected delta
- $0/yr ($0/mo · 0.0%)
ⓘ Screening estimate from a state-policy table — verify with the county assessor before closing.
Climate risk First Street
- Flood 1/10 Low FEMA zone X (unshaded) · 0% chance over 30 yrs
- Wildfire 5/10 Major
- Heat 2/10 Low 7 d/yr ≥99°F today · 14 d/yr by 30 yrs out
- Wind 2/10 Low
- Air quality 2/10 Low 1 unhealthy d/yr today · 1 by 30 yrs out
Nearby sold comps map
Loading sold comps map…
Walkable amenities ~0.75 mi
Loading nearby amenities…
Taxation est. · year 1
- Rental income
- $18,420
- − Mortgage interest
- −$11,758
- − Property taxes
- −$2,689
- − Insurance
- −$1,050
- − Repairs & maintenance
- −$1,474
- − Management
- −$1,474
- − Depreciation
- −$6,106
- Taxable loss
- −$6,130
- Est. tax savings @ 24.0%
- +$1,471
- After-tax cash flow
- $-924/yr
For passive investors: Depreciation is non-cash, so a rental often shows a tax loss while cash-flowing — sheltering income. Rental losses are passive: they offset passive income freely, and up to $25,000/yr can offset ordinary (W-2) income if you actively participate and your MAGI is under $100k (phasing out to $0 by $150k); unused losses carry forward. On sale, claimed depreciation is recaptured at up to 25%, and gains may owe capital-gains tax (a 1031 exchange can defer both). Figures are a year-1 estimate at your 24.0% rate — not tax advice; consult a CPA.
Schools (NCES district)
- District
- St. Francis Area Schools
- NCES district ID
- 2733540
- Math proficiency
- 35% ▼ -22.00%
- Reading proficiency
- 47% ▼ -14.00%
- Median HH income
- $78,137
- Composite
- 37.97/100
- National rank
- #4300
- State rank
- #185 of 301 in MN
Livability — East Bethel
- Score
- 66/100
- State rank
- #489
- US rank
- #11735
Category grades
Schools grade is shown separately in the Schools card above.
Census & demographics
- Census place
- East Bethel, MN
- City population
- 15,781
- Population (ZIP)
- 11,025
Population outlook (Anoka County) Hauer SSP2
- Today (2025)
- 375,223 people
- By 2030
- 387,850 · +3.4%
- By 2040
- 407,239 · +8.5%
- By 2050
- 417,541 · +11.3%
- By 2075
- 448,447 · +19.5%
- By 2100
- 464,954 · +23.9%
Race, ethnicity, and origin ACS 2023
- Neighborhood character
- Predominantly White (93%)
- Race & ethnicity
- White 93% Two or more races 3% Asian 2% Hispanic / Latino 2%
- Common ancestry
- Portuguese 14% Romanian 7% Lithuanian 3%
- Foreign-born
- 3% · Canada
- Languages at home
- 97% English-only · Spanish 1% Other Asian/Pacific 1%
Political lean MEDSL · Anoka
- 2024 margin
- Toss-up / Even · D 46.6% · R 51.0% · Other 2.4%
- 2008→2024 swing
- -2.0pp toward R · 2008: -2.4pp · 2024: -4.4pp
- All cycles
- 2024: R+4.4 2020: R+1.9 2016: R+9.7 2012: R+2.6 2008: R+2.4
Not yet ingested
- Civics
- —
Market trends
- HPI YoY
- ▼ -92.25%
- Current HPI
- 265.1217
- Rent YoY
- —
- Metro
- —
- State GDP YoY
- ▲ 2.41%
- F500 in state
- 34
Industry mix (Fortune 500 HQ in MN)
| Industry | F500 HQs | Revenue |
|---|---|---|
| Healthcare | 2 | $407B |
|
||
| Retail | 2 | $150B |
|
||
| Consumer Goods | 2 | $32B |
|
||
| Industrial Machinery | 2 | $6B |
|
||
| Agriculture | 1 | $40B |
|
||
| Healthcare / Medical Devices | 1 | $32B |
|
||
Price history
+10.5% since first listed10 events — show timeline
- 2026-06-04 Listed $209,900 NORTHSTARMLS as Distributed by MLS Grid
- 2019-09-11 Sold (Public Records) $182,500 Public Records
- 2019-08-30 Sold (MLS) $182,500 NORTHSTARMLS as Distributed by MLS Grid
- 2019-08-12 Pending — NORTHSTARMLS as Distributed by MLS Grid
- 2019-07-31 Listing Removed — NORTHSTARMLS as Distributed by MLS Grid
- 2019-07-26 Listed $180,000 NORTHSTARMLS as Distributed by MLS Grid
- 2007-10-18 Listing Removed — NORTHSTARMLS as Distributed by MLS Grid
- 2007-10-11 Sold (MLS) $187,900 NORTHSTARMLS as Distributed by MLS Grid
- 2007-10-05 Sold (Public Records) $187,900 Public Records
- 2007-05-10 Listed $189,900 NORTHSTARMLS as Distributed by MLS Grid
Property tax history
+4.9%/yrLatest (2026): $2,689 · +15.3% YoY. Source: county tax records.
Cash-flow waterfall
monthlySold comps — $/sqft
last 12 mo · ≤1 miLoading sold comps…