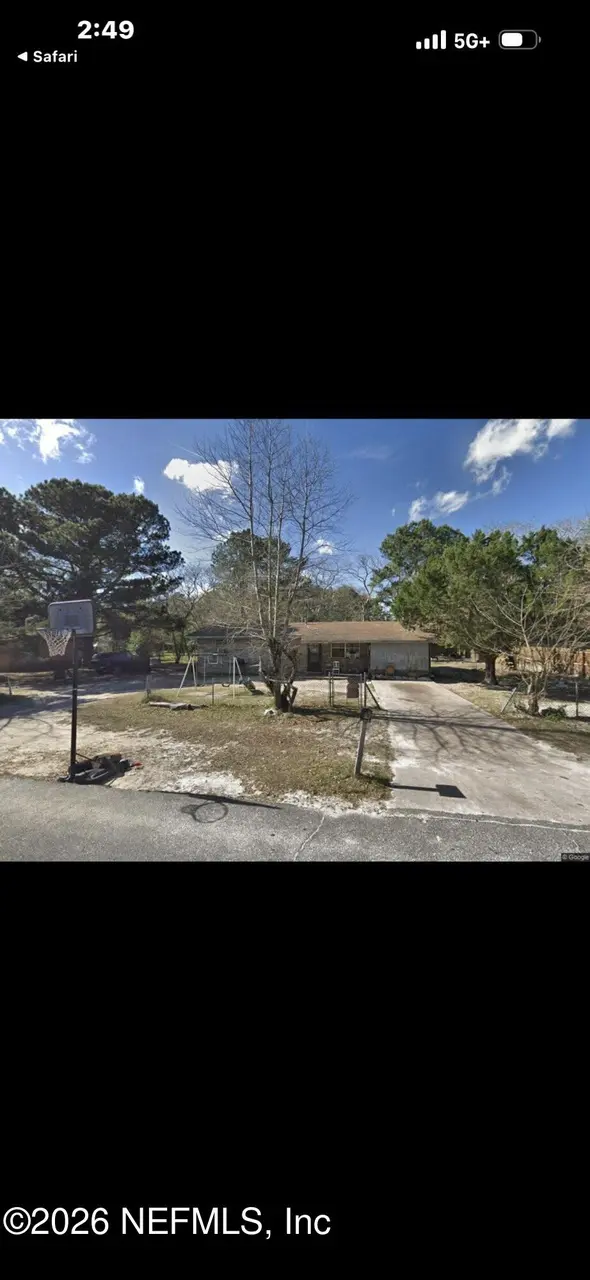
504 Quail Lane Ln · Macclenny, FL
Flood risk 1/10 · Minimal
- FEMA flood zone
- X (unshaded)
- Chance of flooding over 30 yrs
- 0.0%
- Est. flood insurance / yr
- $507 – $1,088
Fire risk 6/10 · Moderate
- Est. fire insurance / yr
- $947 – $1,759
Heat risk 8/10 · Major
- Hot days now (above 107°F)
- 7 days/yr
- Hot days in 30 yrs
- 21 days/yr
Wind risk 9/10 · Severe
- Chance of severe wind over 30 yrs
- 99.0%
Air-quality risk 5/10 · Moderate
- Unhealthy air days now
- 7 days/yr
- Unhealthy air days in 30 yrs
- 8 days/yr
Risk factors via First Street. Map © Google.
Why this score? — see what drove the B- grade
The composite is a weighted blend of 9 inputs, each scored 0–100. Each bar is that input's sub-score; the figure is the points it added to the 100-point composite (weight × sub-score).
- Cash flow +26.0/30.0
- ARV discount +15.0/15.0
- DSCR +8.7/10.0
- 1% rule +6.4/10.0
- Schools +4.4/10.0
- Livability +3.6/5.0
- Rent growth +2.5/5.0
- Condition / age +2.5/5.0
- Appreciation +0.0/10.0
$100,000
🖨 Deal sheet (PDF) 📄 Offer letter ✓ Due diligence
Listing remarks
Excellent bones and a great rehab. 3/1 brick. Metal Roof. Large yard. Paved Road. Ideal for investor looking to rehab. Would make a great rental. Close to shopping and restaurants.
Key facts
- Metal roof
- Paved road
- Large yard
Tags
Property features AI
Finance
- HOA & community: Not a senior community
Exterior
- Parking: Off-street parking
- Utilities: Public sewer; Sewer connected; Water connected
- Home design: Single-family residence; One level
- Construction: Brick and concrete construction; Metal roof; Other outbuilding/structure
- Exterior features: Paved road access; Few trees on the lot; No private pool
Interior
- Kitchen: No appliances included
- Bedrooms: 3 bedrooms (all on the main level)
- Flooring: Carpet; Laminate
- Bathrooms: 1 full bathroom
- Heating & cooling: Wall/window air conditioning units
- Interior features: 6 total rooms; In-unit laundry; Unfurnished
- Laundry & utility: Laundry located in the unit
Neighborhood map
What this means for you Summary
Snapshot
- This is a 3-bed/1.0-bath single-family listed at $100k.
Deal economics
- At list price, monthly cash flow is $248 ($3k/yr) — positive.
- The deal already cash-flows at list — no discount required.
- Meets the 1% rule at list price ($1k rent vs $100k).
- Recommended offer: $97k (3.0% below list) — sets the bar for market timing.
- Cap rate 9.3% vs local median 2.3% in Macclenny — top-decile yield for the area; either an underpriced asset or a hidden risk that comps aren't pricing in. Stress-test before assuming the spread holds.
Location & tenants
- Location reads 72/100 on livability (#355 in FL) — a middle-class / working-renter tenant base. Strengths: cost of living A+, housing A+, health & safety A+; Watch: amenities F, commute F.
- Baker (town): math 53% / reading 49% proficiency, ranked #28 of 73 in FL (top 38%) — acceptable for families but not a draw, mixed tenant base, ~2y average lease.
- Zoned schools: Macclenny Elementary School (math 71% / reading 70%, grade A-, #333 of 2,144 statewide, top 16%, 615 students, 58% FRL); Baker County Middle School (math 47% / reading 42%, grade D, #320 of 571 statewide, top 57%, 1,102 students, 52% FRL); Baker County Senior High School (math 41% / reading 48%, grade F, #237 of 667 statewide, top 36%, 1,425 students, 40% FRL) — zoned schools at 50% FRL track the district average.
- Market conditions: 76 active listings in the ZIP; 99 units permitted in Baker County in 2024 (0 in 5+ unit buildings).
Forward outlook
- Local home prices are declining (-3.0%/yr); year-one equity from $691 of loan paydown is wiped out by about $3k of value loss. Plan a longer hold.
- Baker County population projected to shrink 9% by 2050 — rents likely to lag national; underwrite the cash flow, not the appreciation.
Negotiation context
- It's been on market 32 days — a 3% lower offer ($97k) is reasonable based on typical stale-listing flexibility.
- Current owner paid $28k; list at $100k implies a 257% gain — meaningful room to come down on a strong offer.
Risks & watch-outs
- Climate carrying-cost: severe wind risk, 99% chance of damaging wind over 30y; major wildfire risk; extreme-heat days projected 7→21/yr by 2055 (HVAC capex compounding) — expect insurance premiums to compound above CPI over the hold.
Questions for the listing agent
- It's been on market 32 days. Have you received any prior offers? Is the seller open to a 3% concession, seller financing, or rate buy-down credit?
- Built in 1971 — when were the roof, HVAC, electrical panel, plumbing, and water heater last replaced?
- Is there a deadline driving the sale (1031 exchange, divorce, estate, relocation)? That informs how much negotiation room exists.
- Schools are B-rated — typically a magnet for longer-tenancy family renters. What's the average tenant stay here, and is there a school-zone premium baked into asking?
- What's the average days-on-market for RENTAL listings here right now (not sales)? A rising rental-DOM trend means longer vacancies and softer asking-rent achievability than the comps imply.
- What's the recent tenant-quality profile in this submarket — average credit score on applications, eviction rate, late-payment / NSF rate, and stable-employment percentage? A property-management company in the area should have these aggregated.
- How much new for-sale + rental construction is in the pipeline within 1–3 miles? Heavy new supply typically softens prices + rents 12–24 months out; constrained supply supports both.
Investment metrics
- 1% rule
- 1.14% ✓
- Cap rate
- 9.26%
- Cash-on-cash
- 10.61%
- DSCR
- 1.47
- GRM
- 7.3
CMA / ARV
- ARV (on-the-fly)
- $190,080
- Comps found
- 4
Show comp detail 4 sales within ~0.75 mi
| Address | Dist | Beds/Ba | Sqft | Sold | Price | $/sf | Match |
|---|---|---|---|---|---|---|---|
| 505 S 9th St | 0.03mi | 3/2.0 | 964 (+0%) | 17mo | $191,000 | $198 | 79 |
| 513 Quail Ln | 0.05mi | 3/2.0 | 999 (+4%) | 10mo | $181,000 | $181 | 78 |
| 520 Railroad Ave W | 0.35mi | 3/1.0 | 954 (-1%) | 6mo | $200,000 | $210 | 78 |
| 661 Douberly Rd | 0.55mi | 3/1.0 | 1,055 (+10%) | 12mo | $77,500 | $73 | 47 |
Match score weights: distance 35% · size 25% · config 20% · recency 20%. Top-matched comps best support the ARV.
Projected returns pro-forma
-3.0% appreciation · 3.0% rent growth · sell at horizon
- IRR
- -0.4%
- Equity multiple
- 0.98×
- Total profit
- $-439
- Equity at exit
- $14,910
- IRR
- 9.2%
- Equity multiple
- 1.71×
- Total profit
- $19,905
- Equity at exit
- $8,646
Cash invested: $28,000 (down + closing). Projections, not guarantees.
Landlord ↔ Tenant lean methodology
- Overall (STATE)
- 87 Strongly Landlord-Friendly
- State Florida
- 87 Strongly Landlord-Friendly · R+3
- County
- — inherits STATE
- City
- — inherits STATE
ZIP-level market 32063
- Home prices YoY
- -32.2%
- Active inventory
- 76
- Price-to-rent
- 7.3×
Monthly cashflow live
- Estimated rent
- $1,144 medium interval (Pro) →
- Mortgage (P&I)
- −$524
- Tax from tax record
- −$90 /mo · $1,080/yr
- Insurance
- −$42
- HOA
- −$0
- Vacancy / Maint / Mgmt
- −$240
- Net cashflow
- $248
Break-even live
Sensitivity live
| Price | -10% $304 | -5% $276 | +0% $248 | +5% $219 | +10% $191 |
|---|---|---|---|---|---|
| Rent | -10% $157 | -5% $202 | +0% $248 | +5% $293 | +10% $338 |
| Rate | -1.0pp $298 | -0.5pp $273 | base $248 | +0.5pp $222 | +1.0pp $195 |
UW: 25.0% down · 7.5% · 30yr · 1.5% tax · 5.0% vac · 8.0% maint · 8.0% mgmt
Financing live
Cash to close
- Down payment
- $25,000
- Closing costs
- $3,000
- Reserves months
- —
- Total cash needed
- —
Loan-product check · same deal, 3 products live
Conventional
25% down · 7.5% · 30yr
- Down + closing
- —
- Monthly P&I
- —
- Monthly cashflow
- —
- DSCR
- —
- Eligible?
- —
Personal DTI + credit; lowest rate.
DSCR
20% down · 8.5% · 30yr
- Down + closing
- —
- Monthly P&I
- —
- Monthly cashflow
- —
- DSCR
- —
- Eligible?
- —
No personal income docs; deal must DSCR.
Hard money
10% down · 12.0% · 12mo
- Down + closing
- —
- Monthly P&I
- —
- Monthly cashflow
- —
- DSCR
- —
- Eligible?
- —
Short-term bridge; refi at stabilization.
Listing history 15 events
-
2026-06-16status $100,000 Pending 32 DOM
-
2026-06-15days on market $100,000 Active 32 DOM
-
2026-06-14days on market $100,000 Active 30 DOM
-
2026-06-12days on market $100,000 Active 29 DOM
-
2026-06-09days on market $100,000 Active 26 DOM
-
2026-06-08days on market $100,000 Active 25 DOM
-
2026-06-07days on market $100,000 Active 24 DOM
-
2026-06-05days on market $100,000 Active 21 DOM
-
2026-06-02days on market $100,000 Active 19 DOM
-
2026-06-01days on market $100,000 Active 18 DOM
-
2026-05-31days on market $100,000 Active 17 DOM
-
2026-05-30days on market $100,000 Active 16 DOM
-
2026-05-14$100,000 Active
-
1993-08-01soldstatus $28,000
-
1993-07-01soldstatus $27,000
ⓘ Source: listings_history table (triggers on properties + properties_extension) + one-shot
backfill from property_details.listing_events for pre-trigger history.
Tax reassessment forecast FL · Resets to sale price
- Current annual tax
- $1,080 · $90/mo
- Projected year-2 tax
- $1,080 · $90/mo
- Expected delta
- $0/yr ($0/mo · 0.0%)
ⓘ Screening estimate from a state-policy table — verify with the county assessor before closing.
Climate risk First Street
- Flood 1/10 Low FEMA zone X (unshaded) · 0% chance over 30 yrs
- Wildfire 6/10 Major
- Heat 8/10 Severe 7 d/yr ≥107°F today · 21 d/yr by 30 yrs out
- Wind 9/10 Extreme 99% chance of damaging wind over 30 yrs
- Air quality 5/10 Major 7 unhealthy d/yr today · 8 by 30 yrs out
Nearby sold comps map
Loading sold comps map…
Walkable amenities ~0.75 mi
Loading nearby amenities…
Taxation est. · year 1
- Rental income
- $13,726
- − Mortgage interest
- −$5,602
- − Property taxes
- −$1,080
- − Insurance
- −$500
- − Repairs & maintenance
- −$1,098
- − Management
- −$1,098
- − Depreciation
- −$2,909
- Taxable income
- $1,440
- Est. tax owed @ 24.0%
- −$346
- After-tax cash flow
- $2,626/yr
For passive investors: Depreciation is non-cash, so a rental often shows a tax loss while cash-flowing — sheltering income. Rental losses are passive: they offset passive income freely, and up to $25,000/yr can offset ordinary (W-2) income if you actively participate and your MAGI is under $100k (phasing out to $0 by $150k); unused losses carry forward. On sale, claimed depreciation is recaptured at up to 25%, and gains may owe capital-gains tax (a 1031 exchange can defer both). Figures are a year-1 estimate at your 24.0% rate — not tax advice; consult a CPA.
Schools (NCES district)
- District
- Baker
- NCES district ID
- 1200060
- Math proficiency
- 53% ▼ -6.00%
- Reading proficiency
- 49% ▼ -3.00%
- Median HH income
- $50,301
- Composite
- 43.67/100
- National rank
- #2958
- State rank
- #28 of 73 in FL
Livability — Macclenny
- Score
- 72/100
- State rank
- #355
- US rank
- #6194
Category grades
Schools grade is shown separately in the Schools card above.
Census & demographics
- Census place
- Macclenny, FL
- City population
- 14,546
- Population (ZIP)
- 14,546
Population outlook (Baker County) Hauer SSP2
- Today (2025)
- 27,607 people
- By 2030
- 27,452 · -0.6%
- By 2040
- 26,637 · -3.5%
- By 2050
- 25,103 · -9.1%
- By 2075
- 19,576 · -29.1%
- By 2100
- 11,664 · -57.7%
Race, ethnicity, and origin ACS 2023
- Neighborhood character
- Predominantly White (75%)
- Race & ethnicity
- White 75% Black 12% Two or more races 9% Hispanic / Latino 5% Asian 1%
- Common ancestry
- Iranian 1% Lithuanian 1% Italian 1%
- Foreign-born
- 2% · Canada
- Languages at home
- 94% English-only · Spanish 4%
Political lean MEDSL · Baker
- 2024 margin
- Solid R (+73.1) · D 13.2% · R 86.3%
- 2008→2024 swing
- -15.7pp toward R · 2008: -57.4pp · 2024: -73.1pp
- All cycles
- 2024: R+73.1 2020: R+70.2 2016: R+64.8 2012: R+58.6 2008: R+57.4
Not yet ingested
- Civics
- —
Market trends
- HPI YoY
- ▼ -87.23%
- Current HPI
- 183.4377
- Rent YoY
- —
- Metro
- —
- State GDP YoY
- ▲ 3.28%
- F500 in state
- 36
Industry mix (Fortune 500 HQ in FL)
| Industry | F500 HQs | Revenue |
|---|---|---|
| Industrial Technology | 2 | $29B |
|
||
| Insurance | 2 | $17B |
|
||
| Retail | 1 | $60B |
|
||
| Technology Distribution | 1 | $58B |
|
||
| Homebuilding | 1 | $35B |
|
||
| Technology Manufacturing | 1 | $35B |
|
||
Price history
+270.4% since first listed3 events — show timeline
- 2026-05-14 Listed $100,000 realMLS
- 1993-08-01 Sold (Public Records) $28,000 Public Records
- 1993-07-01 Sold (Public Records) $27,000 Public Records
Property tax history
+17.7%/yrLatest (2025): $1,080 · +0.8% YoY. Source: county tax records.
Cash-flow waterfall
monthlySold comps — $/sqft
last 12 mo · ≤1 miLoading sold comps…