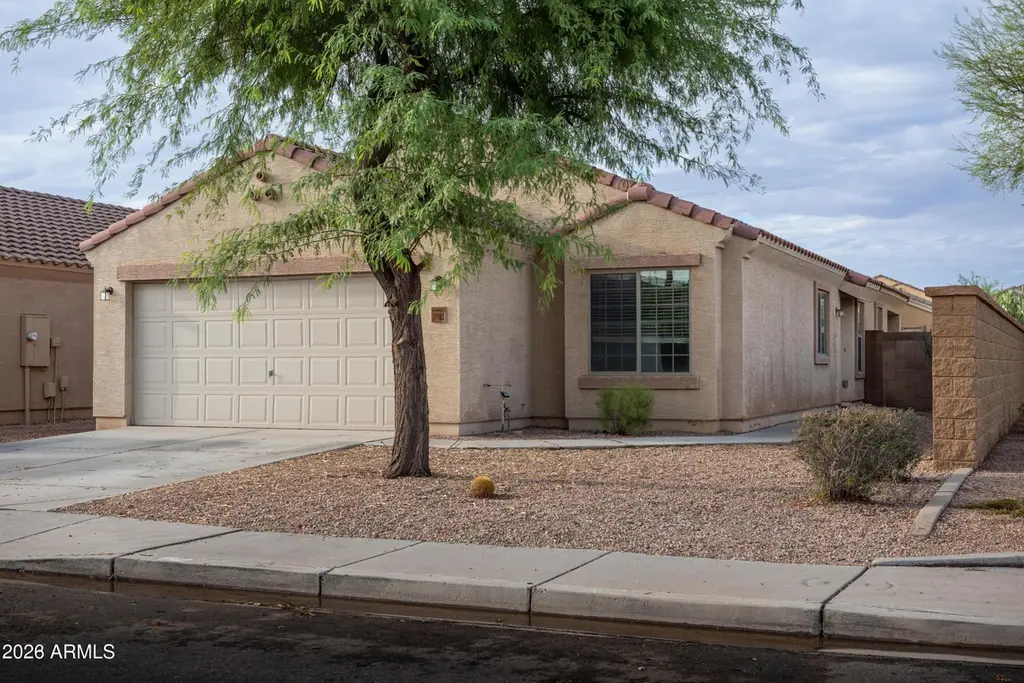
37153 W Amalfi Ave · Maricopa, AZ
Flood risk 1/10 · Minimal
- FEMA flood zone
- X (shaded)
- Chance of flooding over 30 yrs
- 0.0%
- Est. flood insurance / yr
- $507 – $1,088
Fire risk 7/10 · Major
- Est. fire insurance / yr
- $610 – $1,132
Heat risk 9/10 · Severe
- Hot days now (above 114°F)
- 7 days/yr
- Hot days in 30 yrs
- 17 days/yr
Wind risk 1/10 · Minimal
- Chance of severe wind over 30 yrs
- —
Air-quality risk 2/10 · Minimal
- Unhealthy air days now
- 1 days/yr
- Unhealthy air days in 30 yrs
- 1 days/yr
Risk factors via First Street. Map © Google.
Why this score? — see what drove the D- grade
The composite is a weighted blend of 9 inputs, each scored 0–100. Each bar is that input's sub-score; the figure is the points it added to the 100-point composite (weight × sub-score).
- ARV discount +12.6/15.0
- Cash flow +7.4/30.0
- Appreciation +4.6/10.0
- Livability +3.6/5.0
- Rent growth +2.9/5.0
- Condition / age +2.5/5.0
- Schools +2.3/10.0
- DSCR +1.6/10.0
- 1% rule +1.5/10.0
$289,000
🖨 Deal sheet 📄 Offer letter ✓ Due diligence
Listing remarks MLS
This inviting 3-bedroom home with a versatile den sits on a desirable corner lot and features a bright split floorplan designed for both privacy and connection. Vaulted ceilings create an open, airy feel throughout the main living spaces, while the kitchen comes fully equipped with all appliances for an easy move-in. The den offers the perfect flex space for a home office, playroom, or guest area. Located in a growing Maricopa community, this home blends comfort, convenience, and everyday livability.
Key facts
- Split floorplan
- Flex space
- Vaulted ceilings
Tags
Neighborhood map
What this means for you Summary
Snapshot
- This is a 3-bed/2.0-bath single-family listed at $289k.
Deal economics
- At list price, monthly cash flow is $-371 ($-4k/yr) — negative.
- To cash-flow at today's rent, offer at most $223k (22.7% below list).
- To meet the 1% rule (rent ≥ 1% of price), the offer needs to be $187k (35.3% below list).
- Recommended offer: $187k (35.3% below list) — sets the bar for 1% rule.
- Cap rate 4.8% vs local median 3.7% in Maricopa — meaningfully above typical; check what's discounted (condition, days-on-market, listing class) to confirm the premium yield is real.
Location & tenants
- Location reads 72/100 on livability (#28 in AZ) — a middle-class / working-renter tenant base. Strengths: housing A+, employment A-, crime B+; Watch: amenities F, commute F, health & safety F.
- Maricopa Unified School District (4441) (town): math 20% / reading 29% proficiency, ranked #128 of 249 in AZ (top 51%) — low school quality limits family demand, transient renter base, plan for 1-2y turnover.
- Market conditions: Rents rising (+1.8%/yr); 845 active listings in the ZIP; 40 comparable units currently listed for rent nearby; rentals at typical pace (median 17d on market — plan ~3-4 weeks tenant-placement turnaround); solid renter incomes; 9,504 units permitted in Pinal County in 2024 (776 in 5+ unit buildings).
Forward outlook
- Local home prices are declining (-0.9%/yr); year-one equity from $2k of loan paydown is wiped out by about $3k of value loss. Plan a longer hold.
Negotiation context
- It's been on market 99 days — a 9% lower offer ($263k) is reasonable based on typical stale-listing flexibility.
- 3 sale attempts since 4y ago; this cycle's ask has dropped $20k (6%) from the opening price — seller is motivated, your offer sets the floor, not the list.
Risks & watch-outs
- Climate carrying-cost: major wildfire risk; extreme-heat days projected 7→17/yr by 2055 (HVAC capex compounding) — expect insurance premiums to compound above CPI over the hold.
Questions for the listing agent
- What do current leases actually rent for vs. the listed asking? Can we see a recent rent roll and the last 12 months of T-12 income?
- It's been on market 99 days. Have you received any prior offers? Is the seller open to a 35% concession, seller financing, or rate buy-down credit?
- What does the HOA fee cover, when was the last increase, and are there any pending special assessments or reserve-fund shortfalls?
- Why hasn't it sold? Are there any deal-killer items the seller is aware of (foundation, flood, title, zoning, code violations)?
- Is there a deadline driving the sale (1031 exchange, divorce, estate, relocation)? That informs how much negotiation room exists.
- Schools are B-rated — typically a magnet for longer-tenancy family renters. What's the average tenant stay here, and is there a school-zone premium baked into asking?
- The area grade is low — what's the realistic commute time and amenity access for the typical tenant pool here? Any planned neighborhood developments (good or bad) we should know about?
- What's the average days-on-market for RENTAL listings here right now (not sales)? A rising rental-DOM trend means longer vacancies and softer asking-rent achievability than the comps imply.
- What's the recent tenant-quality profile in this submarket — average credit score on applications, eviction rate, late-payment / NSF rate, and stable-employment percentage? A property-management company in the area should have these aggregated.
- How much new for-sale + rental construction is in the pipeline within 1–3 miles? Heavy new supply typically softens prices + rents 12–24 months out; constrained supply supports both.
Investment metrics
- 1% rule
- 0.65% ✗
- Cap rate
- 4.75%
- Cash-on-cash
- -5.50%
- DSCR
- 0.76
- GRM
- 12.9
CMA / ARV
- ARV (median comp)
- $326,141
- List price
- $289,000
- Delta
- -11.39%
- Verdict
- UNDERPRICED
- Comps
- 20 within 1.0 mi
Show comp detail 12 sales within ~0.75 mi
| Address | Dist | Beds/Ba | Sqft | Sold | Price | $/sf | Match |
|---|---|---|---|---|---|---|---|
| 37635 W Capri Ave | 0.32mi | 3/2.0 | 1,525 (-0%) | 1mo | $295,000 | $193 | 84 |
| 18570 N Toledo Ave | 0.46mi | 3/2.0 | 1,571 (+2%) | 3mo | $295,000 | $188 | 72 |
| 36618 W San Sisto Ave | 0.39mi | 3/2.0 | 1,434 (-6%) | 1mo | $285,000 | $199 | 70 |
| 38031 W San Alvarez Ave | 0.56mi | 3/2.0 | 1,573 (+3%) | 1mo | $309,000 | $196 | 69 |
| 36796 W Mondragone Ln | 0.35mi | 3/2.0 | 1,381 (-10%) | 2mo | $260,000 | $188 | 66 |
| 38149 W Isabella Ln | 0.69mi | 3/2.0 | 1,542 (+1%) | 1mo | $299,000 | $194 | 66 |
| 36797 W Nina St | 0.67mi | 3/2.0 | 1,593 (+4%) | 1mo | $309,990 | $195 | 61 |
| 38135 W Cannataro Ln | 0.63mi | 4/2.0 (+1) | 1,572 (+3%) | 1mo | $312,000 | $198 | 60 |
| 36795 W Santa Maria St | 0.62mi | 4/2.0 (+1) | 1,705 (+11%) | 3mo | $309,990 | $182 | 45 |
| 18953 N Avelino Dr | 0.69mi | 4/2.0 (+1) | 1,705 (+11%) | 0mo | $332,990 | $195 | 44 |
| 17490 N Salerno Dr | 0.74mi | 3/2.0 | 1,317 (-14%) | 1mo | $324,990 | $247 | 41 |
| 17580 N Salerno Dr | 0.72mi | 3/2.0 | 1,317 (-14%) | 2mo | $316,000 | $240 | 41 |
Match score weights: distance 35% · size 25% · config 20% · recency 20%. Top-matched comps best support the ARV.
Projected returns pro-forma
-0.89% appreciation · 1.78% rent growth · sell at horizon
- IRR
- -13.3%
- Equity multiple
- 0.43×
- Total profit
- $-46,241
- Equity at exit
- $71,322
- IRR
- -7.6%
- Equity multiple
- 0.32×
- Total profit
- $-54,954
- Equity at exit
- $76,232
Cash invested: $80,920 (down + closing). Projections, not guarantees.
Landlord ↔ Tenant lean methodology
- Overall (STATE)
- 87 Strongly Landlord-Friendly
- State Arizona
- 87 Strongly Landlord-Friendly · R+3
- County
- — inherits STATE
- City
- — inherits STATE
ZIP-level market 85138
- Home prices YoY
- -0.3%
- Rents YoY
- 1.8%
- Active inventory
- 845
- Price-to-rent
- 12.9×
Monthly cashflow live
- Estimated rent
- $1,871 high interval (Pro) →
- Mortgage (P&I)
- −$1,516
- Tax from tax record
- −$138 /mo · $1,650/yr
- Insurance
- −$120
- HOA
- −$75
- Vacancy / Maint / Mgmt
- −$393
- Net cashflow
- $-371
Break-even live
UW: 25.0% down · 7.5% · 30yr · 1.5% tax · 5.0% vac · 8.0% maint · 8.0% mgmt
Financing live
Cash to close
- Down payment
- $72,250
- Closing costs
- $8,670
- Reserves months
- —
- Total cash needed
- —
Loan-product check · same deal, 3 products live
Conventional
25% down · 7.5% · 30yr
- Down + closing
- —
- Monthly P&I
- —
- Monthly cashflow
- —
- DSCR
- —
- Eligible?
- —
Personal DTI + credit; lowest rate.
DSCR
20% down · 8.5% · 30yr
- Down + closing
- —
- Monthly P&I
- —
- Monthly cashflow
- —
- DSCR
- —
- Eligible?
- —
No personal income docs; deal must DSCR.
Hard money
10% down · 12.0% · 12mo
- Down + closing
- —
- Monthly P&I
- —
- Monthly cashflow
- —
- DSCR
- —
- Eligible?
- —
Short-term bridge; refi at stabilization.
Rent comps 40 comps
| Address | Beds | Baths | Sqft | Rent | $/sqft | DOM | Units | Dist |
|---|---|---|---|---|---|---|---|---|
| 37154 W Amalfi Ave Maricopa, AZ | 4.0 | 2.5 | 2223 | $1,695 | $0.76 | 24d | 1 | 0.02mi |
| 37144 W Amalfi Ave Maricopa, AZ | 4.0 | 2.0 | 1516 | $1,669 | $1.10 | 1d | 1 | 0.03mi |
| 37144 W Amalfi Ave Maricopa, AZ | 4.0 | 2.0 | 1516 | $1,839 | $1.21 | 24d | 1 | 0.03mi |
| 37088 W Amalfi Ave Maricopa, AZ | 4.0 | 2.0 | 1516 | $1,735 | $1.14 | 43d | 1 | 0.06mi |
| 17936 N Lettere Cir Maricopa, AZ | 4.0 | 2.5 | 2012 | $1,800 | $0.89 | 5d | 1 | 0.17mi |
| 37392 W Capri Ave Maricopa, AZ | 3.0 | 2.0 | 1764 | $1,695 | $0.96 | 16d | 1 | 0.22mi |
| 37392 W Capri Ave Maricopa, AZ | 3.0 | 2.0 | 1764 | $1,695 | $0.96 | 15d | 1 | 0.22mi |
| 37078 W Mondragone Ln Maricopa, AZ | 3.0 | 2.0 | 1409 | $1,600 | $1.14 | 1d | 1 | 0.34mi |
| 37128 W Mondragone Ln Maricopa, AZ | 3.0 | 2.0 | 1409 | $1,450 | $1.03 | 43d | 1 | 0.36mi |
| 36837 W Mediterranean Way Maricopa, AZ | 3.0 | 2.0 | 1278 | $1,695 | $1.33 | 43d | 1 | 0.44mi |
| 36837 W Mediterranean Way Maricopa, AZ | 3.0 | 2.0 | 1278 | $1,595 | $1.25 | 1d | 1 | 0.44mi |
| 17878 N Pietra Rd Maricopa, AZ | 3.0 | 2.0 | 1555 | $1,625 | $1.05 | 43d | 1 | 0.44mi |
| 36822 W Maddaloni Ave Maricopa, AZ | 4.0 | 2.0 | 1825 | $1,775 | $0.97 | 1d | 1 | 0.46mi |
| 36605 W Mondragone Ln Maricopa, AZ | 3.0 | 2.0 | 1170 | $1,595 | $1.36 | 10d | 1 | 0.48mi |
| 36419 W San Ildefanso Ave Maricopa, AZ | 4.0 | 2.0 | 1849 | $1,795 | $0.97 | 15d | 1 | 0.54mi |
| 36990 W Nola Way Maricopa, AZ | 3.0 | 2.0 | 1769 | $1,639 | $0.93 | 10d | 1 | 0.58mi |
| 38128 W San Sisto Ave Maricopa, AZ | 3.0 | 2.0 | 1593 | $1,995 | $1.25 | 43d | 1 | 0.59mi |
| 38060 W Frascati Ave Maricopa, AZ | 4.0 | 2.0 | 1790 | $1,995 | $1.11 | 43d | 1 | 0.60mi |
| 38105 W Isabella Ln Maricopa, AZ | 3.0 | 2.0 | 1795 | $1,736 | $0.97 | 5d | 1 | 0.63mi |
| 17589 N Del Mar Ave Maricopa, AZ | 3.0 | 2.0 | 1177 | $1,895 | $1.61 | 44d | 1 | 0.63mi |
| 36355 W Mediterranean Way Maricopa, AZ | 3.0 | 2.0 | 1411 | $2,050 | $1.45 | 1d | 1 | 0.63mi |
| 38165 W Excussare Way Maricopa, AZ | 4.0 | 2.0 | 1572 | $1,995 | $1.27 | 5d | 1 | 0.66mi |
| 36085 W San Sisto Ave Maricopa, AZ | 4.0 | 2.0 | 1605 | $2,500 | $1.56 | 1d | 1 | 0.70mi |
| 18853 N Vemto St Maricopa, AZ | 4.0 | 3.0 | 2233 | $1,895 | $0.85 | 24d | 1 | 0.70mi |
| 38248 W Santa Clara Ave Maricopa, AZ | 3.0 | 2.0 | 1700 | $2,150 | $1.26 | 24d | 1 | 0.75mi |
| 36043 W Santa Clara Ave Maricopa, AZ | 3.0 | 2.0 | 1700 | $1,895 | $1.11 | 1d | 1 | 0.77mi |
| 35963 W San Alvarez Ave Maricopa, AZ | 4.0 | 2.0 | 1922 | $1,995 | $1.04 | 24d | 1 | 0.78mi |
| 36033 W San Clemente Ave Maricopa, AZ | 4.0 | 2.0 | 1775 | $1,700 | $0.96 | 43d | 1 | 0.86mi |
| 37014 W Prado St Maricopa, AZ | 3.0 | 2.0 | 1568 | $1,700 | $1.08 | 16d | 1 | 0.87mi |
| 36972 W Prado St Maricopa, AZ | 3.0 | 2.0 | 1568 | $1,700 | $1.08 | 16d | 1 | 0.87mi |
| 37043 W Vera Cruz Dr Maricopa, AZ | 4.0 | 2.0 | 1832 | $2,300 | $1.26 | 1d | 1 | 0.89mi |
| 19270 N Costa Verdez Ave Maricopa, AZ | 3.0 | 2.0 | 1220 | $1,610 | $1.32 | 43d | 1 | 0.92mi |
| 19270 N Costa Verdez Ave Maricopa, AZ | 3.0 | 2.0 | 1220 | $1,730 | $1.42 | 1d | 1 | 0.92mi |
| 18392 N Los Gabrieles Way Maricopa, AZ | 3.0 | 2.0 | 1662 | $1,785 | $1.07 | 4d | 1 | 0.99mi |
| 35579 W San Capistrano Ave Maricopa, AZ | 3.0 | 2.0 | 1662 | $1,650 | $0.99 | 5d | 1 | 1.03mi |
| 36635 W Honeycutt Rd Maricopa, AZ | 1.0–3.0 | 1.0–2.0 | 972 | $2,259 | $2.32 | 1d | 82 | 1.04mi |
| 18099 N Los Gabrieles Way Maricopa, AZ | 4.0 | 2.0 | 1700 | $2,000 | $1.18 | 43d | 1 | 1.05mi |
| 35423 W San Sisto Ave Maricopa, AZ | 3.0 | 2.0 | 1571 | $1,950 | $1.24 | 4d | 1 | 1.11mi |
| 35420 W San Alvarez Ave Maricopa, AZ | 3.0 | 2.0 | 1571 | $1,800 | $1.15 | 24d | 1 | 1.12mi |
| 35408 W San Alvarez Ave Maricopa, AZ | 3.0 | 2.0 | 1525 | $1,599 | $1.05 | 24d | 1 | 1.13mi |
HOA detail
- Monthly dues
- $75 · $900/yr
Listing history 24 events
-
2026-06-18days on market $289,000 Active 99 DOM
-
2026-06-17days on market $289,000 Active 98 DOM
-
2026-06-16days on market $289,000 Active 97 DOM
-
2026-06-15days on market $289,000 Active 96 DOM
-
2026-06-13days on market $289,000 Active 94 DOM
-
2026-06-13days on market $289,000 Active 93 DOM
-
2026-06-09days on market $289,000 Active 90 DOM
-
2026-06-08days on market $289,000 Active 89 DOM
-
2026-06-07days on market $289,000 Active 88 DOM
-
2026-06-04days on market $289,000 Active 85 DOM
-
2026-06-03days on market $289,000 Active 84 DOM
-
2026-06-02pricedays on market $289,000 Active 83 DOM
-
2026-06-01days on market $299,000 Active 82 DOM
-
2026-05-31days on market $299,000 Active 81 DOM
-
2026-03-26price $299,000 505-char remark
Show marketing remark (505 chars)
This inviting 3-bedroom home with a versatile den sits on a desirable corner lot and features a bright split floorplan designed for both privacy and connection. Vaulted ceilings create an open, airy feel throughout the main living spaces, while the kitchen comes fully equipped with all appliances for an easy move-in. The den offers the perfect flex space for a home office, playroom, or guest area. Located in a growing Maricopa community, this home blends comfort, convenience, and everyday livability.
-
2026-03-11$309,000 Active 505-char remark
Show marketing remark (505 chars)
This inviting 3-bedroom home with a versatile den sits on a desirable corner lot and features a bright split floorplan designed for both privacy and connection. Vaulted ceilings create an open, airy feel throughout the main living spaces, while the kitchen comes fully equipped with all appliances for an easy move-in. The den offers the perfect flex space for a home office, playroom, or guest area. Located in a growing Maricopa community, this home blends comfort, convenience, and everyday livability.
-
2023-10-27historical
-
2023-09-01$327,900 Active
-
2022-07-01soldstatus $345,000
-
2022-06-30soldstatus $345,000 Closed
-
2022-06-14status Pending
-
2022-06-03historical Under Contract Accepting Backups
-
2022-05-18$350,000 Active
-
2005-06-15soldstatus $7,608,250
ⓘ Source: listings_history table (triggers on properties + properties_extension) + one-shot
backfill from property_details.listing_events for pre-trigger history.
Tax reassessment forecast AZ · Resets to sale price
- Current annual tax
- $1,650 · $138/mo
- Projected year-2 tax
- $1,907 · $159/mo
- Expected delta
- +$257/yr (+$21/mo · 15.6%)
ⓘ Screening estimate from a state-policy table — verify with the county assessor before closing.
Climate risk First Street
- Flood 1/10 Low FEMA zone X (shaded) · 0% chance over 30 yrs
- Wildfire 7/10 Severe
- Heat 9/10 Extreme 7 d/yr ≥114°F today · 17 d/yr by 30 yrs out
- Wind 1/10 Low
- Air quality 2/10 Low 1 unhealthy d/yr today · 1 by 30 yrs out
Nearby sold comps map
Loading sold comps map…
Walkable amenities ~0.75 mi
Loading nearby amenities…
Taxation est. · year 1
- Rental income
- $22,446
- − Mortgage interest
- −$16,188
- − Property taxes
- −$1,650
- − Insurance
- −$1,445
- − Repairs & maintenance
- −$1,796
- − Management
- −$1,796
- − HOA
- −$900
- − Depreciation
- −$8,407
- Taxable loss
- −$9,736
- Est. tax savings @ 24.0%
- +$2,337
- After-tax cash flow
- $-2,113/yr
For passive investors: Depreciation is non-cash, so a rental often shows a tax loss while cash-flowing — sheltering income. Rental losses are passive: they offset passive income freely, and up to $25,000/yr can offset ordinary (W-2) income if you actively participate and your MAGI is under $100k (phasing out to $0 by $150k); unused losses carry forward. On sale, claimed depreciation is recaptured at up to 25%, and gains may owe capital-gains tax (a 1031 exchange can defer both). Figures are a year-1 estimate at your 24.0% rate — not tax advice; consult a CPA.
Schools (NCES district)
- District
- Maricopa Unified School District (4441)
- NCES district ID
- 0404720
- Math proficiency
- 20% ▼ -18.00%
- Reading proficiency
- 29% ▼ -9.00%
- Median HH income
- $63,725
- Composite
- 22.92/100
- National rank
- #7993
- State rank
- #128 of 249 in AZ
Livability — Maricopa
- Score
- 72/100
- State rank
- #28
- US rank
- #5943
Category grades
Schools grade is shown separately in the Schools card above.
Census & demographics
- Census place
- Maricopa, AZ
- County
- Pinal County · 399,947 people
- City population
- 76,044
- Metro
- Phoenix-Mesa-Chandler, AZ
- Population (ZIP)
- 55,260
- Household income
- $95,867
- Rent vs Own
- Severe rent burden
- 432.0
Population outlook (Pinal County) Hauer SSP2
- Today (2025)
- 437,574 people
- By 2030
- 446,903 · +2.1%
- By 2040
- 452,589 · +3.4%
- By 2050
- 444,126 · +1.5%
- By 2075
- 430,300 · -1.7%
- By 2100
- 393,536 · -10.1%
Race, ethnicity, and origin ACS 2023
- Neighborhood character
- Diverse neighborhood (Simpson 0.69)
- Race & ethnicity
- White 45% Hispanic / Latino 30% Two or more races 17% Black 13% Native American 3% Asian 3% Pacific Islander 1%
- Hispanic origin (detail)
- Mexican 26% Puerto Rican 1%
- Common ancestry
- Lithuanian 2% Romanian 2% Italian 2%
- Foreign-born
- 10% · Canada
- Languages at home
- 79% English-only · Spanish 16% Other Asian/Pacific 1% Other Indo-European 1%
Political lean MEDSL · Pinal
- 2024 margin
- Strong R (+22.1) · D 38.5% · R 60.6%
- 2008→2024 swing
- -7.6pp toward R · 2008: -14.5pp · 2024: -22.1pp
- All cycles
- 2024: R+22.1 2020: R+17.3 2016: R+19.3 2012: R+17.1 2008: R+14.5
Not yet ingested
- Civics
- —
Market trends
- HPI YoY
- ▼ -0.89%
- Current HPI
- 258.1461
- Rent YoY
- ▲ 1.78%
- Metro
- Phoenix-Mesa-Chandler, AZ
- State GDP YoY
- ▲ 4.54%
- F500 in state
- 20
Industry mix (Fortune 500 HQ in AZ)
| Industry | F500 HQs | Revenue |
|---|---|---|
| Technology | 2 | $13B |
|
||
| Mining / Metals | 1 | $23B |
|
||
| Environmental Services | 1 | $16B |
|
||
| Metals / Steel | 1 | $14B |
|
||
| Technology Distribution | 1 | $9B |
|
||
| Homebuilding | 1 | $8B |
|
||
Price history
-96.1% since first listed10 events — show timeline
- 2026-03-26 Price Changed $299,000 ARMLS
- 2026-03-11 Listed $309,000 ARMLS
- 2023-10-27 Listing Removed — ARMLS
- 2023-09-01 Listed $327,900 ARMLS
- 2022-07-01 Sold (Public Records) $345,000 Public Records
- 2022-06-30 Sold (MLS) $345,000 ARMLS
- 2022-06-14 Pending — ARMLS
- 2022-06-03 Contingent — ARMLS
- 2022-05-18 Listed $350,000 ARMLS
- 2005-06-15 Sold (Public Records) $7,608,250 Public Records
Property tax history
+0.2%/yrLatest (2025): $1,650 · -1.5% YoY. Source: county tax records.
Cash-flow waterfall
monthlySold comps — $/sqft
last 12 mo · ≤1 miLoading sold comps…