 Duplex
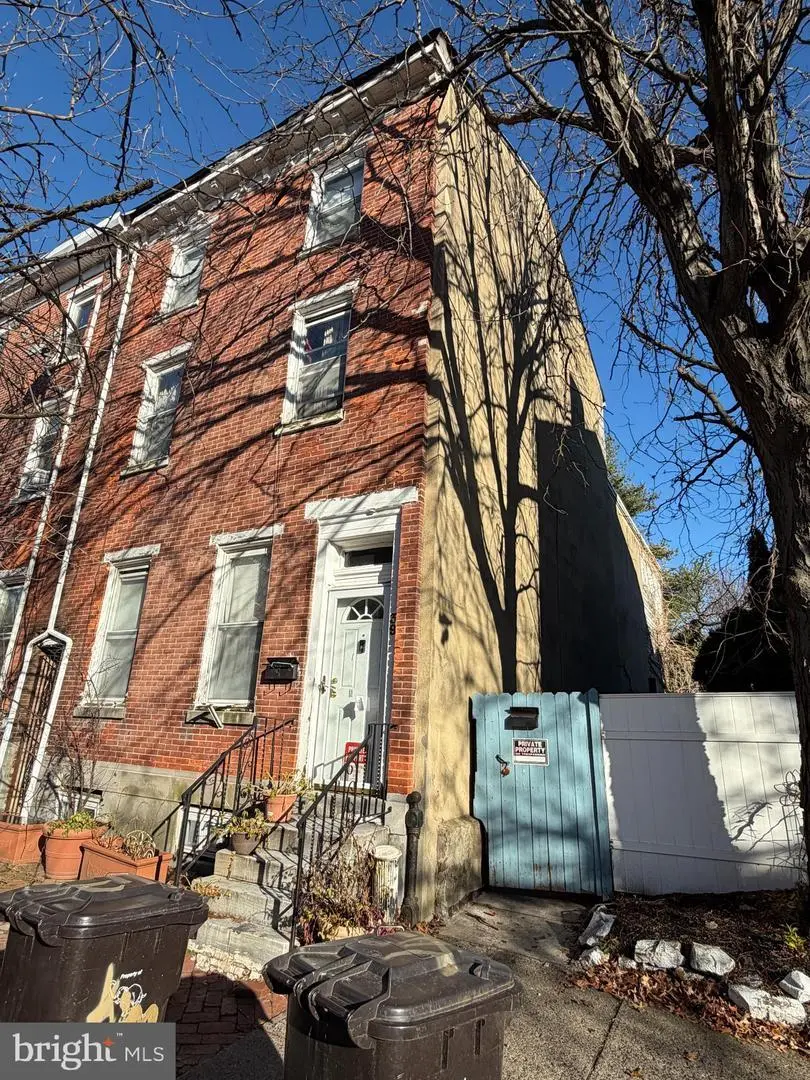
39 Jacoby St · Norristown, PA
Flood risk 1/10 · Minimal
- FEMA flood zone
- X (unshaded)
- Chance of flooding over 30 yrs
- 0.0%
- Est. flood insurance / yr
- $473 – $860
Fire risk 1/10 · Minimal
- Est. fire insurance / yr
- $511 – $949
Heat risk 6/10 · Moderate
- Hot days now (above 102°F)
- 7 days/yr
- Hot days in 30 yrs
- 15 days/yr
Wind risk 6/10 · Moderate
- Chance of severe wind over 30 yrs
- 27.0%
Air-quality risk 4/10 · Minor
- Unhealthy air days now
- 5 days/yr
- Unhealthy air days in 30 yrs
- 8 days/yr
Risk factors via First Street. Map © Google.
Why this score? — see what drove the B+ grade
The composite is a weighted blend of 9 inputs, each scored 0–100. Each bar is that input's sub-score; the figure is the points it added to the 100-point composite (weight × sub-score).
- Cash flow +30.0/30.0
- ARV discount +15.0/15.0
- 1% rule +10.0/10.0
- DSCR +10.0/10.0
- Livability +4.2/5.0
- Rent growth +2.8/5.0
- Condition / age +2.5/5.0
- Schools +2.2/10.0
- Appreciation +0.0/10.0
$175,000
🖨 Deal sheet 📄 Offer letter ✓ Due diligence
Multi-family units
County records classify this as Multi-Family (2-4 Unit). Listing-text estimate: 2 units. confirmed
Listing remarks
Massive duplex opportunity in the heart of Norristown! This oversized brick end-row property offers tremendous upside for investors looking to capitalize on the strong rental demand in the area. The first-floor unit features 1 bedroom and 1 full bath, while the expansive second and third-floor unit offers 4 bedrooms and 1 full bath with plenty of living space. The property is in need of renovation and is being sold strictly as-is, making it the perfect value-add project for investors, flippers, or savvy buyers looking to build equity. Solid brick construction, end-unit row, and generous square footage provide an excellent foundation for your next investment. This is a no-brainer opportunity
Key facts
- 2,200 sq ft lot
- Built 1900
- Listed 4 days
Property features AI
Exterior
- Parking: On-street parking
- Utilities: Public water; Public sewer
- Home design: 2 total units; End of row/townhouse
- Construction: Brick construction; Stone foundation; Built year source: Assessor
- Exterior features: Brick exterior; Stone foundation; Above-grade and below-grade structures
Interior
- Bedrooms: One 1-bedroom unit (multi-unit property)
- Heating & cooling: Central heating; Natural gas heating; Natural gas hot water
- Interior features: End of row/townhouse layout; Fee simple ownership
Neighborhood map
What this means for you Summary
Snapshot
- This is a 2 × 2-bed/1.0-bath units multifamily listed at $175k.
Deal economics
- At list price, monthly cash flow is $2k ($20k/yr) — positive. Per door: $835/mo.
- The deal already cash-flows at list — no discount required.
- Meets the 1% rule at list price ($4k rent vs $175k).
- Cap rate 17.7% vs local median 4.5% in Norristown — top-decile yield for the area; either an underpriced asset or a hidden risk that comps aren't pricing in. Stress-test before assuming the spread holds.
Location & tenants
- Location reads 84/100 on livability (#100 in PA, #720 nationally) — a professional / high-income tenant draw. Strengths: amenities A+, commute A+, cost of living A+; Watch: schools C-, crime D-.
- Norristown Area SD (suburban): math 18% / reading 31% proficiency, ranked #466 of 539 in PA (top 86%) — low school quality limits family demand, transient renter base, plan for 1-2y turnover; 70% free/reduced lunch — lower-income household profile, screen leases tightly.
- Market conditions: Rents rising (+1.3%/yr); 164 active listings in the ZIP; 4 comparable units currently listed for rent nearby; rentals at typical pace (median 24d on market — plan ~3-4 weeks tenant-placement turnaround); 1,936 units permitted in Montgomery County in 2024 (530 in 5+ unit buildings).
- At $3,847/mo this rent would consume 66% of the median local household income ($70k/yr) (locally 2725% of renters already pay >50% of income on rent) — very limited rent-growth headroom before tenants either downsize or default.
Forward outlook
- Local home prices are declining (-3.0%/yr); year-one equity from $1k of loan paydown is wiped out by about $5k of value loss. Plan a longer hold.
- Montgomery County population projected at +5% by 2050 — modest demand growth; plan on rents tracking national, not racing it.
- At projected returns (-3.0% appreciation + 1.3% rent growth), your $49k cash investment doubles in ~3 years — after that, you're playing with house money.
Negotiation context
- Only 4 days on market — expect competitive offers; lowballing is unlikely to land.
- Current owner paid $50k; list at $175k implies a 250% gain — meaningful room to come down on a strong offer.
Risks & watch-outs
- Watch-outs: property tax is 2.6% of price; built in 1900 — expect roof / HVAC / electrical / plumbing capex.
- Climate carrying-cost: major wind risk, 27% chance of damaging wind over 30y; extreme-heat days projected 7→15/yr by 2055 (HVAC capex compounding) — expect insurance premiums to compound above CPI over the hold.
Questions for the listing agent
- Can we see the unit-by-unit rent roll, current vacancy, and any below-market leases? What's the average tenancy length?
- What capital expenditures (roof, boiler, parking lot, exteriors) have been made in the last 5 years, and what's planned in the next 2?
- Built in 1900 — when were the roof, HVAC, electrical panel, plumbing, and water heater last replaced?
- Property tax is high relative to price — has the assessment been appealed recently, and will the sale trigger a re-assessment?
- Is there a deadline driving the sale (1031 exchange, divorce, estate, relocation)? That informs how much negotiation room exists.
- Crime grade is D in this area — have there been break-ins, vandalism, or insurance claims at this property in the last 3 years? What carrier currently insures it and at what premium?
- What's the average days-on-market for RENTAL listings here right now (not sales)? A rising rental-DOM trend means longer vacancies and softer asking-rent achievability than the comps imply.
- What's the recent tenant-quality profile in this submarket — average credit score on applications, eviction rate, late-payment / NSF rate, and stable-employment percentage? A property-management company in the area should have these aggregated.
- How much new apartment / multifamily construction is in the pipeline within 1–3 miles? Heavy new supply (>2% of stock underway) typically softens rents 12–24 months out; light construction supports rent growth.
Investment metrics
- 1% rule
- 2.20% ✓
- Cap rate
- 17.74%
- Cash-on-cash
- 40.89%
- DSCR
- 2.82
- GRM
- 3.8
CMA / ARV
- ARV (on-the-fly)
- $260,100
- Comps found
- 9
Show comp detail 9 sales within ~0.75 mi
| Address | Dist | Beds/Ba | Sqft | Sold | Price | $/sf | Match |
|---|---|---|---|---|---|---|---|
| 664 Chain St | 0.44mi | 6/2.0 (+1) | 2,568 (+1%) | 10mo | $350,000 | $136 | 65 |
| 711 Swede St | 0.16mi | 5/— | 2,196 (-14%) | 7mo | $223,000 | $102 | 64 |
| 424 E Marshall St | 0.46mi | 5/— | 2,278 (-11%) | 7mo | $223,000 | $98 | 55 |
| 514 Astor St | 0.51mi | 5/2.0 | 2,418 (-5%) | 15mo | $188,990 | $78 | 55 |
| 1418 Pine St | 0.49mi | 4/— (-1) | 2,323 (-9%) | 6mo | $330,000 | $142 | 52 |
| 515 Cherry St | 0.33mi | 5/5.0 | 2,664 (+4%) | 16mo | $395,000 | $148 | 52 |
| 418 W Airy St | 0.57mi | 4/— (-1) | 2,352 (-8%) | 10mo | $175,000 | $74 | 47 |
| 905 W Marshall St | 0.74mi | 5/— | 2,176 (-15%) | 3mo | $323,000 | $148 | 39 |
| 536 Haws Ave | 0.66mi | 4/2.0 (-1) | 2,793 (+10%) | 24mo | $242,500 | $87 | 29 |
Match score weights: distance 35% · size 25% · config 20% · recency 20%. Top-matched comps best support the ARV.
Projected returns pro-forma
-3.0% appreciation · 1.29% rent growth · sell at horizon
- IRR
- 35.4%
- Equity multiple
- 2.46×
- Total profit
- $71,645
- Equity at exit
- $26,093
- IRR
- 41.2%
- Equity multiple
- 4.55×
- Total profit
- $174,167
- Equity at exit
- $15,131
Cash invested: $49,000 (down + closing). Projections, not guarantees.
Landlord ↔ Tenant lean methodology
- Overall (STATE)
- 62 Landlord-Friendly
- State Pennsylvania
- 62 Landlord-Friendly · EVEN
- County
- — inherits STATE
- City
- — inherits STATE
ZIP-level market 19401
- Rents YoY
- 1.3%
- Active inventory
- 164
- Price-to-rent
- 7.6×
Monthly cashflow live
- Estimated rent
- $3,847 high interval (Pro) →
- Mortgage (P&I)
- −$918
- Tax from tax record
- −$379 /mo · $4,544/yr
- Insurance
- −$73
- HOA
- −$0
- Vacancy / Maint / Mgmt
- −$808
- Net cashflow
- $1,670
Break-even live
2-unit breakdown (identical units grouped — click to expand)
| Units | Beds | Baths | Est. rent |
|---|---|---|---|
| 2× units | 2 | 1 | $3,848 |
| #1 | 2 | 1 | $1,924 |
| #2 | 2 | 1 | $1,924 |
| Total (2 units) | $3,847 | ||
UW: 25.0% down · 7.5% · 30yr · 1.5% tax · 5.0% vac · 8.0% maint · 8.0% mgmt
Financing live
Cash to close
- Down payment
- $43,750
- Closing costs
- $5,250
- Reserves months
- —
- Total cash needed
- —
Loan-product check · same deal, 3 products live
Conventional
25% down · 7.5% · 30yr
- Down + closing
- —
- Monthly P&I
- —
- Monthly cashflow
- —
- DSCR
- —
- Eligible?
- —
Personal DTI + credit; lowest rate.
DSCR
20% down · 8.5% · 30yr
- Down + closing
- —
- Monthly P&I
- —
- Monthly cashflow
- —
- DSCR
- —
- Eligible?
- —
No personal income docs; deal must DSCR.
Hard money
10% down · 12.0% · 12mo
- Down + closing
- —
- Monthly P&I
- —
- Monthly cashflow
- —
- DSCR
- —
- Eligible?
- —
Short-term bridge; refi at stabilization.
Rent comps 4 comps
| Address | Beds | Baths | Sqft | Rent | $/sqft | DOM | Units | Dist |
|---|---|---|---|---|---|---|---|---|
| 217 E Marshall St Norristown, PA | 5.0 | 1.5 | 2142 | $2,450 | $1.14 | 4d | 1 | 0.27mi |
| 540 George St Norristown, PA | 5.0 | 2.0 | 2054 | $2,595 | $1.26 | 24d | 1 | 0.55mi |
| 533 Buttonwood St Norristown, PA | 5.0 | 2.0 | 1888 | $2,300 | $1.22 | 14d | 1 | 0.91mi |
| 310 Prospect Ave Bridgeport, PA | 4.0 | 2.5 | 1920 | $3,100 | $1.61 | 43d | 1 | 1.15mi |
Listing history 3 events
-
2026-05-12status Pending
-
2026-05-08$175,000 Active
-
1988-10-14soldstatus $50,000
ⓘ Source: listings_history table (triggers on properties + properties_extension) + one-shot
backfill from property_details.listing_events for pre-trigger history.
Tax reassessment forecast PA · Partial reset (capped growth)
- Current annual tax
- $4,544 · $379/mo
- Projected year-2 tax
- $4,544 · $379/mo
- Expected delta
- $0/yr ($0/mo · 0.0%)
ⓘ Screening estimate from a state-policy table — verify with the county assessor before closing.
Climate risk First Street
- Flood 1/10 Low FEMA zone X (unshaded) · 0% chance over 30 yrs
- Wildfire 1/10 Low
- Heat 6/10 Major 7 d/yr ≥102°F today · 15 d/yr by 30 yrs out
- Wind 6/10 Major 27% chance of damaging wind over 30 yrs
- Air quality 4/10 Moderate 5 unhealthy d/yr today · 8 by 30 yrs out
Nearby sold comps map
Loading sold comps map…
Walkable amenities ~0.75 mi
Loading nearby amenities…
Taxation est. · year 1
- Rental income
- $46,164
- − Mortgage interest
- −$9,803
- − Property taxes
- −$4,544
- − Insurance
- −$875
- − Repairs & maintenance
- −$3,693
- − Management
- −$3,693
- − Depreciation
- −$5,091
- Taxable income
- $18,466
- Est. tax owed @ 24.0%
- −$4,432
- After-tax cash flow
- $15,607/yr
For passive investors: Depreciation is non-cash, so a rental often shows a tax loss while cash-flowing — sheltering income. Rental losses are passive: they offset passive income freely, and up to $25,000/yr can offset ordinary (W-2) income if you actively participate and your MAGI is under $100k (phasing out to $0 by $150k); unused losses carry forward. On sale, claimed depreciation is recaptured at up to 25%, and gains may owe capital-gains tax (a 1031 exchange can defer both). Figures are a year-1 estimate at your 24.0% rate — not tax advice; consult a CPA.
Schools (NCES district)
- District
- Norristown Area SD
- NCES district ID
- 4216980
- Math proficiency
- 18% ▼ -11.00%
- Reading proficiency
- 31% ▼ -14.00%
- Median HH income
- $56,024
- Composite
- 22.17/100
- National rank
- #8166
- State rank
- #466 of 539 in PA
Livability — Norristown
- Score
- 84/100
- State rank
- #100
- US rank
- #720
Category grades
Schools grade is shown separately in the Schools card above.
Census & demographics
- Census place
- Norristown, PA
- County
- Montgomery County · 712,331 people
- City population
- 87,376
- Metro
- Philadelphia-Camden-Wilmington, PA-NJ-DE-MD
- Population (ZIP)
- 43,359
- Household income
- $69,908
- Rent vs Own
- Severe rent burden
- 2725.0
Population outlook (Montgomery County) Hauer SSP2
- Today (2025)
- 856,074 people
- By 2030
- 870,887 · +1.7%
- By 2040
- 891,195 · +4.1%
- By 2050
- 896,417 · +4.7%
- By 2075
- 903,212 · +5.5%
- By 2100
- 843,240 · -1.5%
Race, ethnicity, and origin ACS 2023
- Neighborhood character
- Highly diverse neighborhood (Simpson 0.72)
- Race & ethnicity
- White 33% Black 29% Hispanic / Latino 29% Two or more races 16% Asian 3% Native American 2%
- Hispanic origin (detail)
- Mexican 16% Puerto Rican 5% Dominican 2%
- Common ancestry
- Romanian 3% Slovak 1%
- Foreign-born
- 17% · Canada, Jamaica, South Korea
- Languages at home
- 71% English-only · Spanish 22% Other Indo-European 2% Russian/Polish/Slavic 1%
Political lean MEDSL · Montgomery
- 2024 margin
- Strong D (+22.8) · D 60.9% · R 38.1% · Other 1.1%
- 2008→2024 swing
- +2.0pp toward D · 2008: 20.8pp · 2024: 22.8pp
- All cycles
- 2024: D+22.8 2020: D+26.3 2016: D+21.1 2012: D+14.3 2008: D+20.8
Not yet ingested
- Civics
- —
Market trends
- HPI YoY
- ▼ -203.75%
- Current HPI
- 301.7748
- Rent YoY
- ▲ 1.29%
- Metro
- Philadelphia-Camden-Wilmington, PA-NJ-DE-MD
- State GDP YoY
- ▲ 1.68%
- F500 in state
- 34
Industry mix (Fortune 500 HQ in PA)
| Industry | F500 HQs | Revenue |
|---|---|---|
| Healthcare | 2 | $309B |
|
||
| Insurance | 2 | $27B |
|
||
| Telecommunications / Media | 1 | $124B |
|
||
| Industrial Distribution | 1 | $22B |
|
||
| Financial Services | 1 | $20B |
|
||
| Chemicals / Materials | 1 | $18B |
|
||
Price history
+250.0% since first listed3 events — show timeline
- 2026-05-12 Pending — BRIGHT MLS
- 2026-05-08 Listed $175,000 BRIGHT MLS
- 1988-10-14 Sold (Public Records) $50,000 Public Records
Property tax history
+2.6%/yrLatest (2026): $4,544 · +2.3% YoY. Source: county tax records.
Cash-flow waterfall
monthlySold comps — $/sqft
last 12 mo · ≤1 miLoading sold comps…